. 2017:2017:7353252.
doi: 10.1155/2017/7353252. Epub 2017 Mar 20.

All-Trans Retinoic Acid Modulates TLR4/NF- κ B Signaling Pathway Targeting TNF- α and Nitric Oxide Synthase 2 Expression in Colonic Mucosa during Ulcerative Colitis and Colitis Associated Cancer

Affiliations

All-Trans Retinoic Acid Modulates TLR4/NF- κ B Signaling Pathway Targeting TNF- α and Nitric Oxide Synthase 2 Expression in Colonic Mucosa during Ulcerative Colitis and Colitis Associated Cancer

Hayet Rafa et al. Mediators Inflamm. 2017.

Abstract

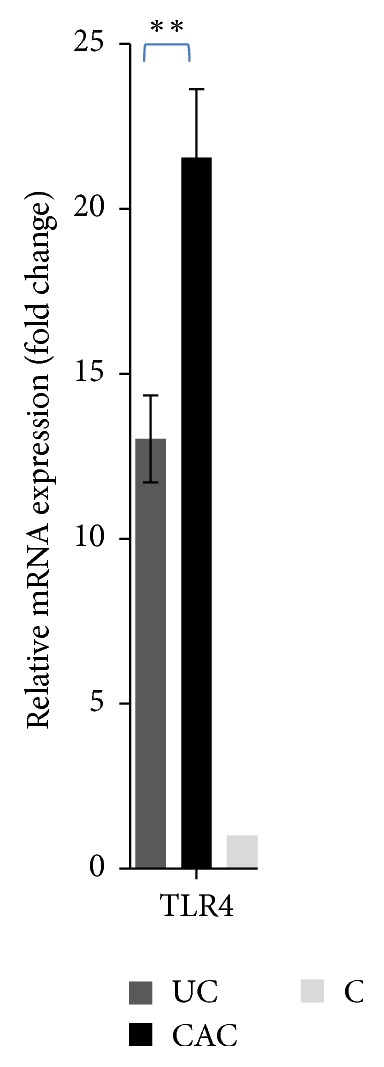
Colitis associated cancer (CAC) is the colorectal cancer (CRC) subtype that is associated with bowel disease such as ulcerative colitis (UC). The data on role of NF-κB signaling in development and progression of CAC were derived from preclinical studies, whereas data from human are rare. The aim of this work was to study the contribution of NF-κB pathway during UC and CAC, as well as the immunomodulatory effect of all-trans retinoic acid (AtRA). We analyzed the expression of NOS2, TNF-α, TLR4, and NF-κB, in colonic mucosa. We also studied NO/TNF-α modulation by LPS in colonic mucosa pretreated with AtRA. A marked increase in TLR4, NF-κB, TNF-α, and NOS2 expression was reported in colonic mucosa. The relationship between LPS/TLR4 and TNF-α/NO production, as well as the role of NF-κB signaling, was confirmed by ex vivo experiments and the role of LPS/TLR4 in NOS2/TNF-α induction through NF-κB pathway was suggested. AtRA downregulates NOS2 and TNF-α expression. Collectively, our study indicates that AtRA modulates in situ LPS/TLR4/NF-κB signaling pathway targeting NOS2 and TNF-α expression. Therefore, we suggest that AtRA has a potential value in new strategies to improve the current therapy, as well as in the clinical prevention of CAC development and progression.


Figures

Figure 1
Figure 1
Correlation between the serum NO levels and the serum TNF-α levels in Algerian patients with (a) active UC and (b) CAC. (a) There is a significant correlation between NO levels and TNF-α levels in patients with active UC (R2 = 0.78). (b) There is a significant correlation between the NO levels and TNF-α (R2 = 0.92) levels in patients with CAC (TNF-α, tumor necrosis factor-alpha; NO, nitric oxide; UC, ulcerative colitis; CAC, colitis associated cancer).
Figure 2
Figure 2
Messenger-RNA (mRNA) transcripts of TNF-α, TNFR (p55, p75), and iNOS were quantitated in colonic mucosa of patients with UC and CAC. Expression was normalized against β-actin and GAPDH housekeeping gene, and relative expression was represented data as fold differences by the 2−ΔΔCt method, where ΔCt = Ct target gene − Ct MG and ΔΔCt = ΔCt inflamed colonic mucosa −  ΔCt normal colonic mucosa. Fold changes were calculated using the comparative Ct method. Data represent mean ± standard deviation. Significant difference between the two groups of patients (UC/CAC) is indicated (P < 0.05). ns, no significant difference, P > 0.05 (UC, ulcerative colitis, n = 12; CAC, colitis associated cancer, n = 5; C, control, n = 5).
Figure 3
Figure 3
TNF-α and NOS2 expression in inflamed colonic mucosa of active UC and CAC patients detected by immunofluorescent staining (IF). TNF-α and NOS2 expression was upregulated in inflamed colonic mucosa (higher inflammation score) of active UC and CAC patients compared with control. Immunofluorescence staining of NOS2 (score 3) and TNF-α (score 3) was more intense in inflamed colonic mucosa of UC patients compared with control (score 0). High score and intensity of NOS2 (score 3) and TNF-α (score 3) were also evaluated in colonic mucosa of CAC patients (UC, ulcerative colitis, n = 5; CAC, colitis associated cancer, n = 3; C, control, n = 4).
Figure 4
Figure 4
Representative photomicrographs of H&E-stained (a) colonic mucosa from control, (b) active UC patients (severe inflammation; higher score 5.4), and (c) CAC patients (severe inflammation; higher score 5.4). Arrows show cellular infiltrate and crypt destruction (UC, ulcerative colitis, n = 10; CAC, colitis associated cancer, n = 9; C, control, n = 5).
Figure 5
Figure 5
Percentage of mixed leukocytes in areas with high or low expression of iNOS and TNF-α. Mixed leukocytes (inflammatory cell infiltrate) were counted in 4 wells nonoverlapping in areas of iNOS/TNF-α overexpression and areas with low expression. High density of mixed leukocytes was observed in areas of iNOS and TNF-α overexpression as compared with areas of low iNOS/TNF-α expression in colonic mucosa of UC and CAC patients (∗∗P < 0.01).
Figure 6
Figure 6
mRNA transcripts of TLR4 were quantitated in colonic mucosa of UC and CAC patients. Expression was normalized against β-actin, HPRT, and GAPDH housekeeping gene, and relative expression was represented data as fold differences by the 2−ΔΔCt method, where ΔCt = Ct target gene − Ct MG and ΔΔCt = ΔCt inflamed colonic mucosa −  ΔCt normal colonic mucosa. Fold changes were calculated using the comparative Ct method. Data represent mean ± standard deviation. Significant difference between patients (UC/CAC) and controls is indicated (P < 0.001). Significant difference between 2 groups of patients (UC/CAC) is indicated (∗∗P < 0.01) (UC, ulcerative colitis, n = 12; CAC, colitis associated cancer, n = 5; C, control, n = 5).
Figure 7
Figure 7
The expressions of TLR4 in colonic mucosa of UC and CAC patients detected by Western blot. (a) Representative Western blot analysis of total biopsies homogenate from colonic mucosa of active UC and CAC patients. A TLR4 specific polyclonal antibody recognized a protein whose molecular weight was approximately 95 kDa. (b) The relative intensity of TLR4 (C: control, colonic mucosa, n = 3; UC: ulcerative colitis, n = 5; CAC: colitis associated cancer, n = 3).
Figure 8
Figure 8
Immunohistochemical expression of TLR4. Control colonic mucosa shows a low expression of TLR4 (score 0). This expression was profoundly increased in colonic mucosa of patients UC (score 3) and CAC (score 3) (UC: ulcerative colitis, n = 6; CAC: colitis associated cancer, n = 4; C: control, normal mucosa, n = 3).
Figure 9
Figure 9
The expression of NF-κB (P50) and ikkγ in colonic mucosa of UC and CAC patients detected by IF. NF-κB (score 3) and ikkγ (score 3) expression was upregulated in colonic mucosa of active UC and CAC patients compared with control (score 0) (UC: ulcerative colitis, n = 6; CAC: colitis associated cancer, n = 4; C: control, normal mucosa, n = 3).
Figure 10
Figure 10
Role of NF-κB signaling on nitric oxide (a) and TNF-α (b) production by colonic mucosa stimulated with LPS (10 μg/ml) in UC and CAC patients. Values represent mean ± standard deviation. Significance compared with control: ∗∗∗P < 0.001, ∗∗P < 0.01, and P < 0.05; ns: no significant difference (UC: ulcerative colitis; CAC: colitis associated cancer; C: control, normal mucosa).
Figure 11
Figure 11
Effect of LPS (10 µg/ml) in the presence or absence of AtRA (10-7 M) on NO2 (a) and TNF-α (b) mRNA expression in colonic mucosa of patients with active UC and CAC. Values represent mean ± standard deviation. Significance compared with control: P < 0.05, ∗∗P < 0.01 (UC: ulcerative colitis; CAC: colitis associated cancer).
Figure 12
Figure 12
Effect of LPS (10 µg/ml) in the presence or absence of AtRA (10-7 M) on NO (a) and TNF-α (b) production by colonic mucosa of patients with active UC and CAC. Values represent mean ± standard deviation. Significance compared with control: P < 0.05, ∗∗P < 0.01, and ∗∗∗P < 0.001. ns, no significant difference, P > 0.05 (UC: ulcerative colitis; CAC: colitis associated cancer; C: control, normal mucosa).
Figure 13
Figure 13
Effect of LPS (10 µg/ml) in the presence or absence of AtRA (10-7 M) on NOS2 (iNOS) expression in inflamed colonic mucosa of patients with active UC and CAC. AtRA reduced NOS2 expression in colonic mucosa (UC: ulcerative colitis; CAC: colitis associated cancer).

References

    1. Jemal A., Bray F., Center M. M., Ferlay J., Ward E., Forman D. Global cancer statistics. CA Cancer Journal for Clinicians. 2011;61(2):69–90. doi: 10.3322/caac.20107. - DOI - PubMed
    1. Ullman T. A., Itzkowitz S. H. Intestinal inflammation and cancer. Gastroenterology. 2011;140(6):1807–1816. doi: 10.1053/j.gastro.2011.01.057. - DOI - PubMed
    1. Ligibel J. Lifestyle factors in cancer survivorship. Journal of Clinical Oncology. 2012;30(30):3697–3704. doi: 10.1200/jco.2012.42.0638. - DOI - PubMed
    1. Wei E. K., Giovannucci E., Wu K., et al. Comparison of risk factors for colon and rectal cancer. International Journal of Cancer. 2004;108(3):433–442. doi: 10.1002/ijc.11540. - DOI - PMC - PubMed
    1. Hagemann T., Balkwill F., Lawrence T. Inflammation and cancer: a double-edged sword. Cancer Cell. 2007;12(4):300–301. doi: 10.1016/j.ccr.2007.10.005. - DOI - PMC - PubMed

Substances

LinkOut - more resources