. 2017:2017:5724046.
doi: 10.1155/2017/5724046. Epub 2017 Mar 20.

Differential Regulation of Cardiac Function and Intracardiac Cytokines by Rapamycin in Healthy and Diabetic Rats

Affiliations

Differential Regulation of Cardiac Function and Intracardiac Cytokines by Rapamycin in Healthy and Diabetic Rats

Christian Luck et al. Oxid Med Cell Longev. 2017.

Abstract

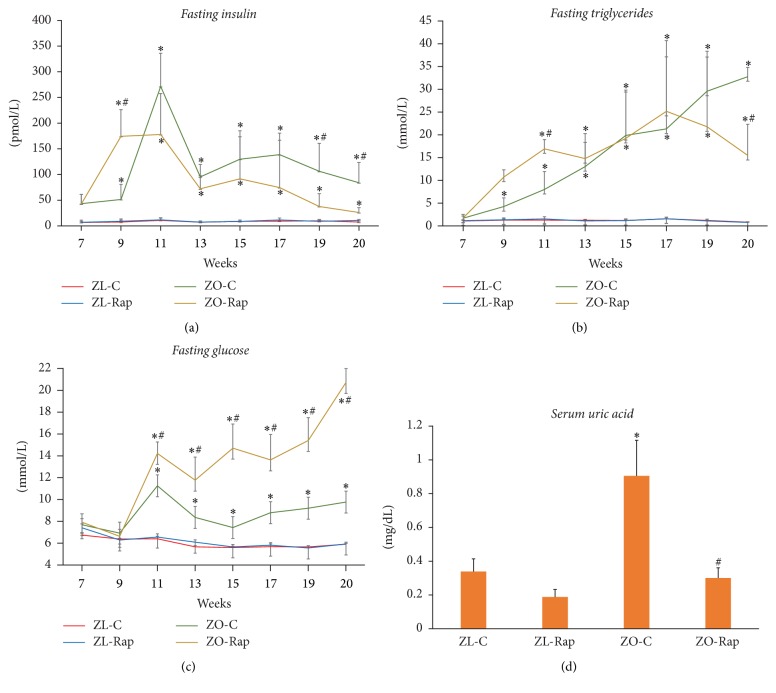
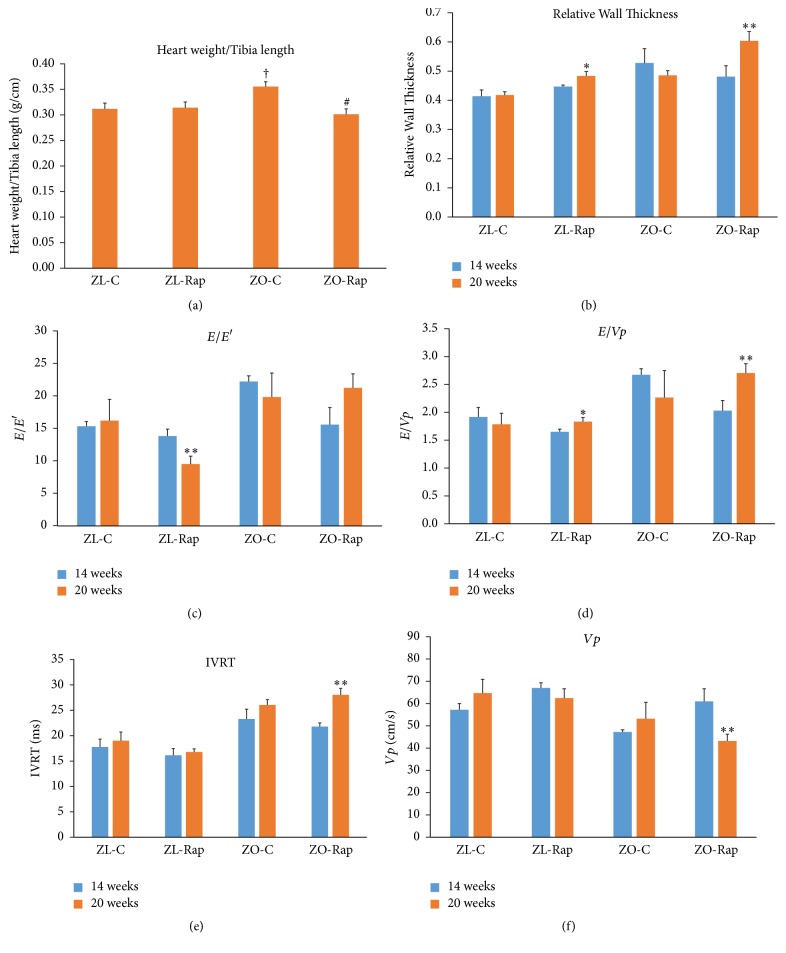
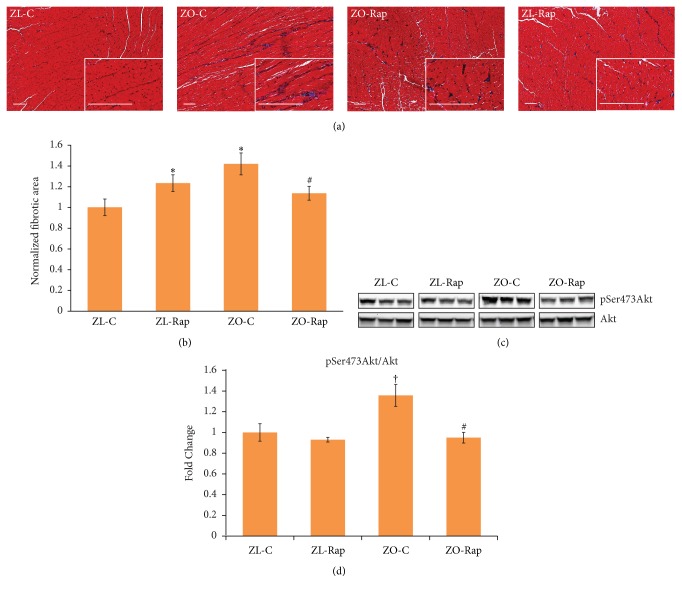
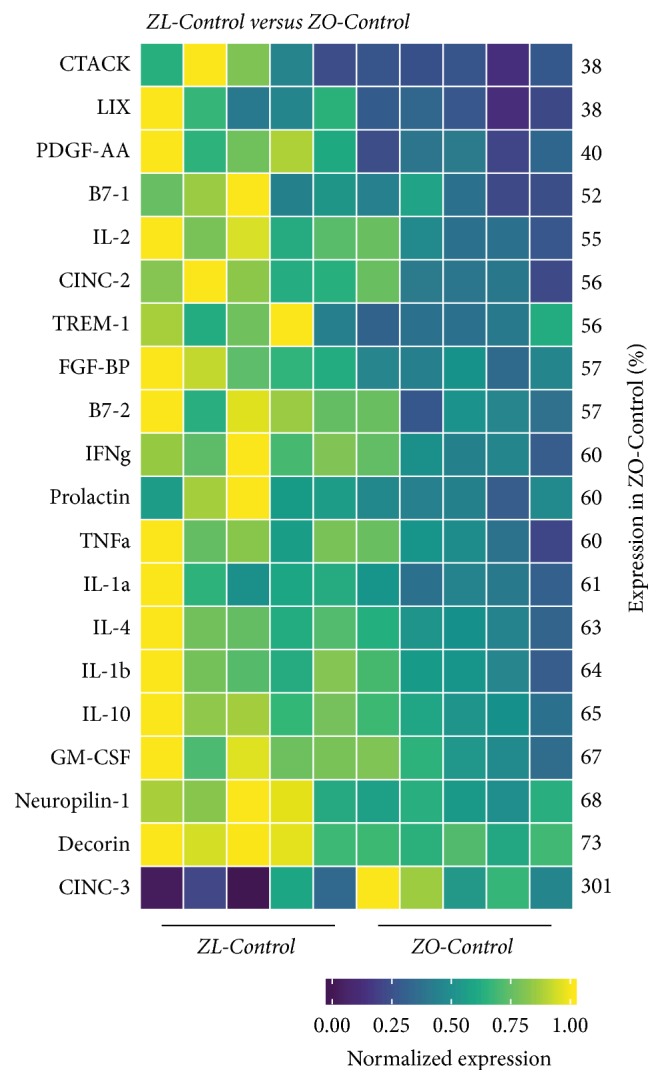
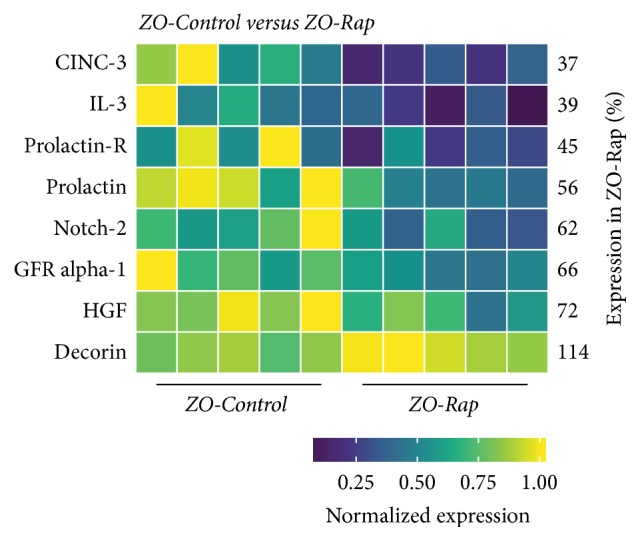
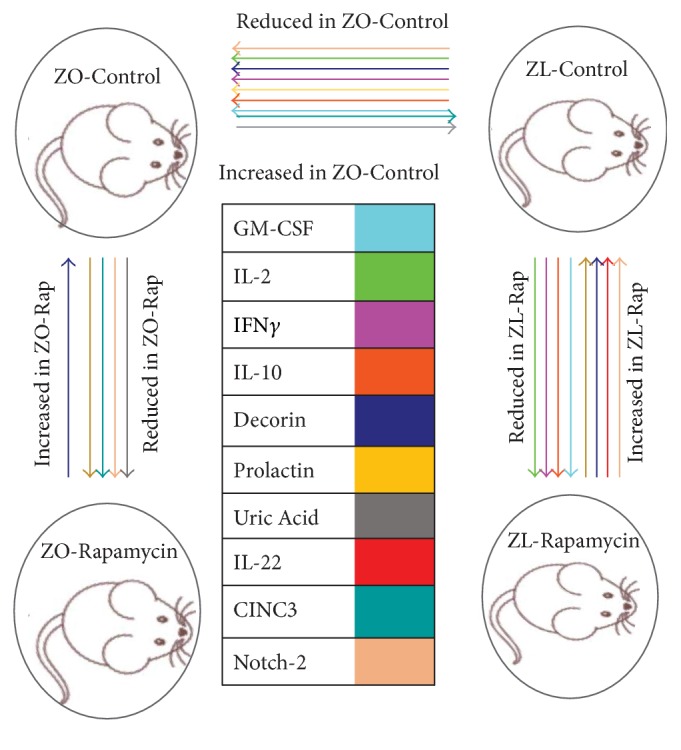
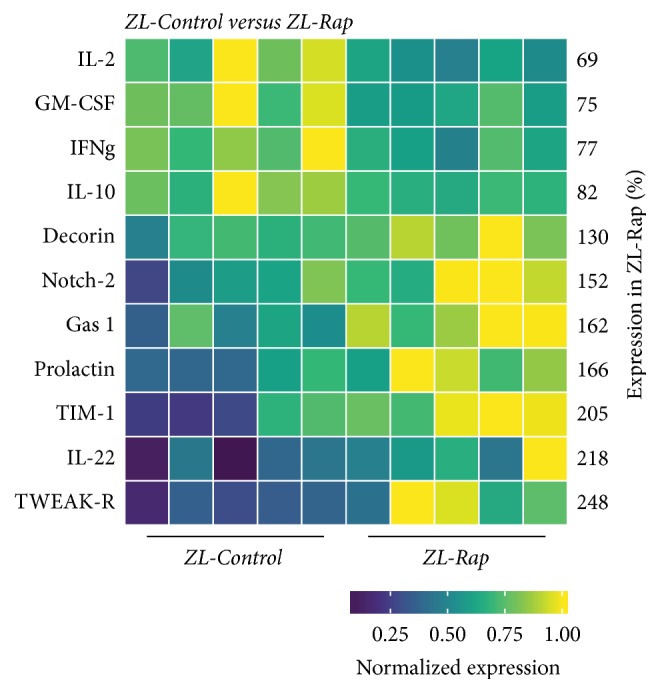
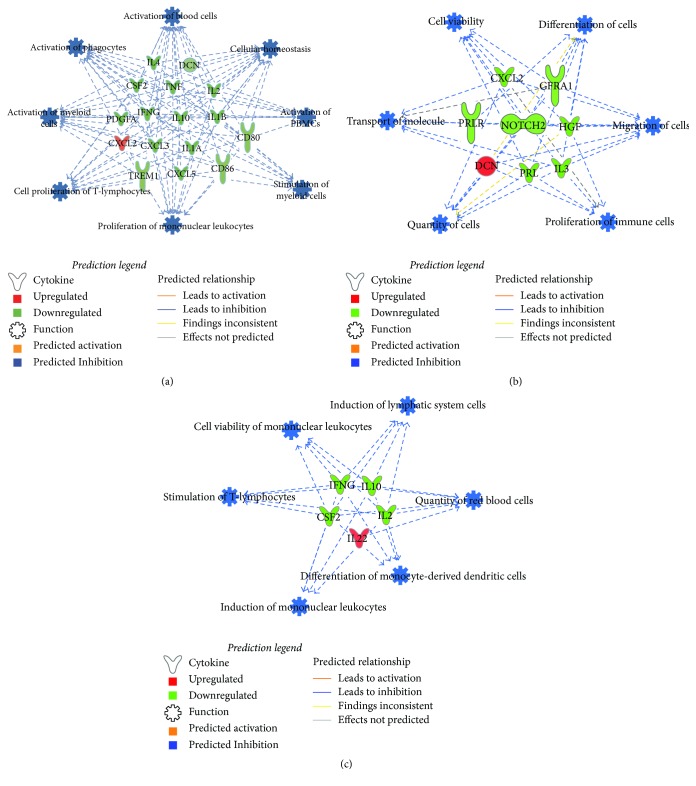
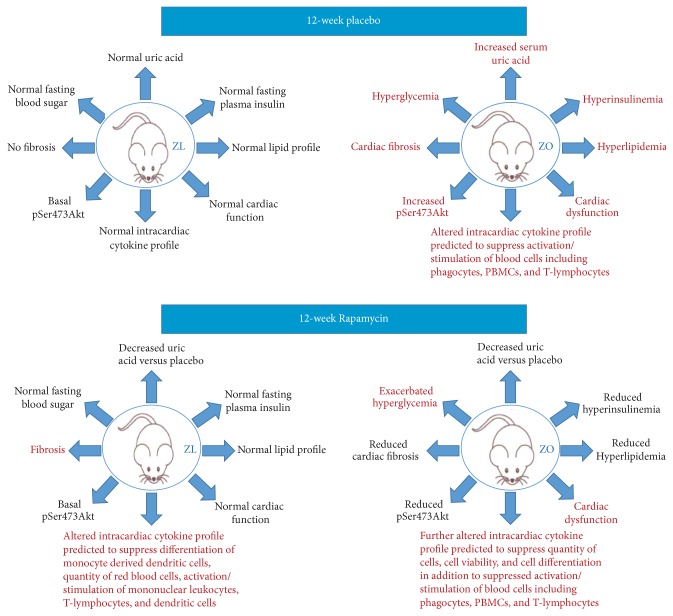
Diabetes is comorbid with cardiovascular disease and impaired immunity. Rapamycin improves cardiac functions and extends lifespan by inhibiting the mechanistic target of rapamycin complex 1 (mTORC1). However, in diabetic murine models, Rapamycin elevates hyperglycemia and reduces longevity. Since Rapamycin is an immunosuppressant, we examined whether Rapamycin (750 μg/kg/day) modulates intracardiac cytokines, which affect the cardiac immune response, and cardiac function in male lean (ZL) and diabetic obese Zucker (ZO) rats. Rapamycin suppressed levels of fasting triglycerides, insulin, and uric acid in ZO but increased glucose. Although Rapamycin improved multiple diastolic parameters (E/E', E'/A', E/Vp) initially, these improvements were reversed or absent in ZO at the end of treatment, despite suppression of cardiac fibrosis and phosphoSer473Akt. Intracardiac cytokine protein profiling and Ingenuity® Pathway Analysis indicated suppression of intracardiac immune defense in ZO, in response to Rapamycin treatment in both ZO and ZL. Rapamycin increased fibrosis in ZL without increasing phosphoSer473Akt and differentially modulated anti-fibrotic IL-10, IFNγ, and GM-CSF in ZL and ZO. Therefore, fundamental difference in intracardiac host defense between diabetic ZO and healthy ZL, combined with differential regulation of intracardiac cytokines by Rapamycin in ZO and ZL hearts, underlies differential cardiac outcomes of Rapamycin treatment in health and diabetes.


Figures

Figure 1
Figure 1
Changes in fasting serum triglyceride levels, insulin, and glucose, and serum uric acid of lean and obese rats treated with and without Rapamycin. Six-hour fasting blood collection of the indicated groups was performed for analysis of (a) serum insulin, (b) serum triglyceride levels, and (c) plasma glucose. (d) Uric acid was measured from serum samples collected at the time of sacrifice. Analysis was performed using commercially available assays (Beckman-Coulter, Brea, CA) on an automated clinical chemistry instrument (AU680, Beckman-Coulter, Brea, CA) for triglycerides, glucose, and uric acid. Insulin was measured by an ELISA kit specific for rat insulin. Values are means ± SEM. n = 6 for ZL-C, ZL-Rap, and ZO-C, and n = 5 for ZO-Rap. p < 0.05 versus ZL-C, and #p < 0.05 versus ZO-C using two-way repeated measures ANOVA or Student's t-test as appropriate.
Figure 2
Figure 2
Heart weight, cardiac function, and myocardial strain analysis in 14- and 20-week-old rats. (a) Graph shows heart weight determined at the time of sacrifice after normalizing to tibial length. (b) LV relative wall thickness (RWT) calculated by using the formula PWTd + AWd/LVIDd, where AW is the anterior LV diastolic wall thickness and LVID is the LV internal diameter. (c) Graph shows E/E′, a powerful predictor of primary cardiac event in humans, (d) E/Vp, (e) isovolumic relaxation time (IVRT), (f) flow propagation velocity (Vp). Values are means ± SEM. n = 6 for ZL-C, ZL-Rap, and ZO-C, and n = 5 for ZO-Rap for (a) p < 0.05 versus ZL-C, #p < 0.05 versus ZO-C. For (b)–(f), n = 4 for all groups, p < 0.1 and ∗∗p < 0.05 compared to 14 weeks for each respective group. p values were determined using two-way repeated measures ANOVA or Student's t-test as appropriate.
Figure 3
Figure 3
Effect of Rapamycin treatment on fibrosis and phosphorylation status Ser473 residue of Akt in ZL and ZO rats. (a) Representative images of Trichrome stained heart sections of ZL-C, ZL-Rap, ZO-C, and ZO-Rap are shown. Images were taken at 10x magnification and the insets were taken at 40x magnification (scale bars = 200 μm). (b) Graph shows the cumulative data for normalized fibrotic area from 10 images for each animal (n = 5 animals per group; 50 images total for one group). Fibrosis was higher in the heart tissue sections of ZO-C and ZL-Rap compared to that of ZL-C. ZO-Rap heart tissue sections displayed reduced fibrosis compared to ZO-C. (c) Representative images of Western blots probed with anti-phosphoSer473 Akt and anti-Akt antibodies. Data for 3 different animals per group are shown. All bands are from the same gel. (d). Bar graph shows the ratio of intensity of bands corresponding to phosphoSer473 Akt to total Akt after normalizing to total protein levels (n ≥ 3). p < 0.05 for ZL-C versus ZO-C or ZO-Rap and #p < 0.05 for ZO-Rap versus ZO-C and p = 0.06 for ZO-C versus ZL-C.
Figure 4
Figure 4
Changes in cardiac cytokines of ZO-Control rats compared to ZL-Control rats. Significant differential expression of 20 cytokines was determined in cardiac tissues of ZO-C and ZL-C rats. The heatmap is a graphic representation of relative expression of cardiac protein levels with individual cardiac samples arranged along the x-axis and protein markers along the y-axis. Expression was normalized for each protein across all animals (across each row). Average relative expression in ZO-C hearts compared to ZL-C hearts for each respective protein is given as a percentage next to each row. Statistical significance was determined using Student's t-test. p < 0.05 for all proteins, n = 5 for each group.
Figure 5
Figure 5
Changes in cardiac cytokines of ZO-Control rats compared to ZO-Rap rats. Significant differential expression of 8 cytokines was determined in cardiac tissues of ZO-C and ZO-Rap rats. The heatmap is a graphic representation of relative expression of cardiac protein levels with individual cardiac samples arranged along the x-axis and protein markers along the y-axis. Expression was normalized for each protein across all animals (across each row). Average relative expression in ZO-Rap hearts compared to ZO-C hearts for each respective protein is given as a percentage next to each row. Statistical significance was determined using Student's t-test. p < 0.05 for all proteins, n = 5 for each group.
Figure 6
Figure 6
Rapamycin treatment widened the differences in intracardiac cytokine profiles of ZL-C and ZO-C. Cartoon diagram shows the intracardiac proteins that were differentially expressed in response to both diabetes and Rapamycin treatment. Arrowhead points towards reduced expression. Direction of change in the protein is labeled. Expressions of GM-CSF, IL-2, IFN-γ, and IL-10 are reduced by both diabetes (in ZO-C) and Rapamycin treatment (in ZL-Rap) compared to ZL-C. Prolactin and Notch 2 are suppressed by Rapamycin treatment in ZO rat but increased in response to Rapamycin treatment in ZL rats. Uric acid and CINC-3 were increased by diabetes in ZO rats compared to ZL rats but suppressed by Rapamycin treatment. Decorin was suppressed by diabetes (ZL-C versus ZO-C) but increased by Rapamycin treatment in both ZL and ZO rats. Rapamycin treatment increased IL-22 only in ZL rats. IL-1α, IL-1β, B7-1 (CD-80), B7-2 (CD-86), and other molecules that were suppressed by diabetes but not modulated by Rapamycin are not shown here.
Figure 7
Figure 7
Changes in cardiac cytokines of ZL-Control rats compared to ZL-Rap rats. Significant differential expression of 11 cytokines was determined in cardiac tissues of ZL-C and ZL-Rap rats. The heatmap is a graphic representation of relative expression of cardiac protein levels with individual cardiac samples arranged along the x-axis and protein markers along the y-axis. Expression was normalized for each protein across all animals (across each row). Average relative expression in ZL-Rap hearts compared to ZL-C hearts for each respective protein is given as a percentage next to each row. Statistical significance was determined using Student's t-test. p < 0.05 for all proteins, n = 5 for each group.
Figure 8
Figure 8
Predicted intracardiac immune responses modulated by DM or Rapamycin treatment or their combination. Disease and function networks generated by bioinformatic pathway analysis through the use of the Ingenuity Pathway Analysis (IPA®, QIAGEN Redwood City) software (65) for ZO-C versus ZL-C (a), ZO-Rap versus ZO-C (b), and ZL-Rap versus ZL-C (c) are shown. Ensemble ID numbers for the genes encoding proteins listed in Figures 4, 5, and 7 were used as input for IPA. List of gene symbols used in networks and respective proteins is given in (d). Predicted functions/diseases with the highest absolute activation z-scores were combined into networks for each comparison. Direction of change in expression is indicated by colors of the molecules as indicated in the legend shown. IPA analysis indicated suppression of various immune functions (shown in blue as described in the legend) in the heart tissues of ZO-C compared to ZL-C, ZO-Rap compared to ZO-C, and ZL-Rap compared to ZL-C.
Figure 9
Figure 9
Summary of the effects of DM and Rapamycin treatment on metabolic and cardiac outcomes in diabetic and healthy rats.

Similar articles

Cited by

References

    1. Kennedy B. K., Lamming D. W. The mechanistic target of rapamycin: the grand ConducTOR of metabolism and aging. Cell Metabolism. 2016;23(6):990–1003. doi: 10.1016/j.cmet.2016.05.009. - DOI - PMC - PubMed
    1. Nacarelli T., Sell C. Targeting metabolism in cellular senescence, a role for intervention. Molecular and Cellular Endocrinology. 2016 doi: 10.1016/j.mce.2016.08.049. - DOI - PubMed
    1. Lamming D. W. Inhibition of the mechanistic target of rapamycin (mTOR)—Rapamycin and beyond. Cold Spring Harbor Perspectives in Medicine. 2016;6(5) doi: 10.1101/cshperspect.a025924.a025924 - DOI - PMC - PubMed
    1. Sengupta S., Peterson T. R., Sabatini D. M. Regulation of the mTOR complex 1 pathway by nutrients, growth factors, and stress. Molecular Cell. 2010;40(2):310–322. doi: 10.1016/j.molcel.2010.09.026. - DOI - PMC - PubMed
    1. Zoncu R., Efeyan A., Sabatini D. M. MTOR: from growth signal integration to cancer, diabetes and ageing. Nature Reviews Molecular Cell Biology. 2011;12(1):21–35. doi: 10.1038/nrm3025. - DOI - PMC - PubMed

MeSH terms

LinkOut - more resources