. 2016 Dec 17:13:321-331.
doi: 10.2142/biophysico.13.0_321. eCollection 2016.

Actin binding domain of filamin distinguishes posterior from anterior actin filaments in migrating Dictyostelium cells

Affiliations

Actin binding domain of filamin distinguishes posterior from anterior actin filaments in migrating Dictyostelium cells

Keitaro Shibata et al. Biophys Physicobiol. .

Abstract

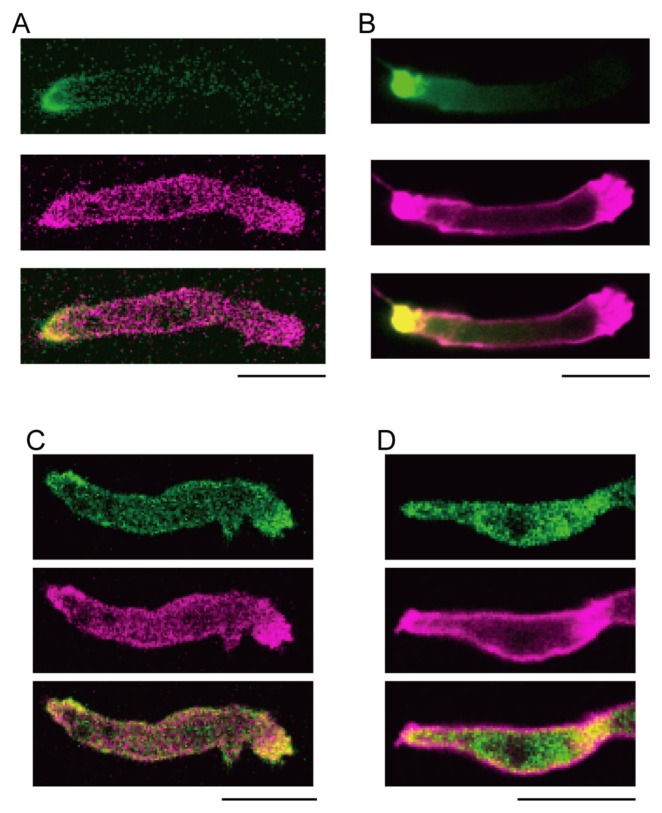
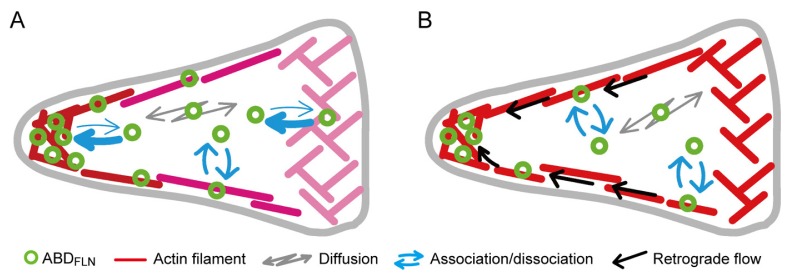
Actin filaments in different parts of a cell interact with specific actin binding proteins (ABPs) and perform different functions in a spatially regulated manner. However, the mechanisms of those spatially-defined interactions have not been fully elucidated. If the structures of actin filaments differ in different parts of a cell, as suggested by previous in vitro structural studies, ABPs may distinguish these structural differences and interact with specific actin filaments in the cell. To test this hypothesis, we followed the translocation of the actin binding domain of filamin (ABDFLN) fused with photoswitchable fluorescent protein (mKikGR) in polarized Dictyostelium cells. When ABDFLN-mKikGR was photoswitched in the middle of a polarized cell, photoswitched ABDFLN-mKikGR rapidly translocated to the rear of the cell, even though actin filaments were abundant in the front. The speed of translocation (>3 μm/s) was much faster than that of the retrograde flow of cortical actin filaments. Rapid translocation of ABDFLN-mKikGR to the rear occurred normally in cells lacking GAPA, the only protein, other than actin, known to bind ABDFLN. We suggest that ABDFLN recognizes a certain feature of actin filaments in the rear of the cell and selectively binds to them, contributing to the posterior localization of filamin.

Keywords: photoswitchable fluorescent protein (mKikGR); structural polymorphism.


Conflict of interest statement

Conflicts of Interest All the authors declare that they have no conflict of interest.

Figures

Figure 1
Figure 1
Localization of actin filaments and ABDs fused with GFP. (A) Fluorescence micrographs of a polarized cell expressing ABDFLN-GFP (top), mCherry-lifeact (middle) and the merged image (bottom). (B) Intensity profile of each fluorescence along the cortex, measured along the white line in the direction of the arrow in the merged image (inset, the same cell as in A) with the 0 μm set at the rear end. Green and magenta lines show the intensity of ABDFLN-GFP and mCherry-lifeact, respectively. (C) Fluorescence micrographs of a polarized cell expressing ABDACTN-GFP (top), mCherry-lifeact (middle) and the merged image (bottom). (D) Intensity profile of each fluorescence along the cell cortex, measured along the white line in the direction of the arrow in the merged image (inset, the same cell as in C) with the 0 μm set at the rear end. Green and magenta lines show the intensity of ABDACTN-GFP and mCherry-lifeact, respectively. (E) Ratio of the fluorescence intensity of ABD-GFP to that of mCherry-lifeact along the white lines in the merged images. The purple line shows ABDFLN-GFP : mCherry-lifeact, and the orange line shows ABDACTN-GFP: mCherry-lifeact. The intensity ratios at the rear end of the cells are set at 1. (F) Fluorescence micrographs of polarized cells expressing GFP (left), mCherry-lifeact (middle) and the merged image (right). Cells of (A) and (C) migrated toward the right of the images and cells of (F) migrated downward. Scale bars: 10 μm. Additional representative cells of each condition are shown in Supplementary Figure S2.
Figure 2
Figure 2
Translocation of ABDFLN-mKikGR. Time lapse images of a polarized cell expressing ABDFLN-mKikGR and migrating toward the right (A, B and C). (A) and (B) show the green and red fluorescence images of mKikGR, respectively, and (C) shows the merged images. The region bound by the yellow square was irradiated by 405 nm laser light for 0.38 s immediately after taking the pre-irradiation image (−4.9 s). Scanning for subsequent images were started at 0.9, 5.5, 10.1, and 14.7 s after starting the 405 nm laser irradiation, which was set as time = 0. Scale bar: 10 μm. (D) Profiles of fluorescence intensity along the cell cortex shown by the white arrows in (C), with the 0 μm set at the rear end. The green and magenta lines show fluorescence intensities of ABDFLN-mKikGR in the green and red channels, respectively. The cyan lines show red fluorescence intensities of ABDFLN-mKikGR after subtracting the fluorescence intensities in the red channel that were unrelated to stimulated photoswitching. The purple vertical bar in the −4.9 s graph shows the irradiated region on the cell cortex. The white and black arrowheads show two minor peaks along both cell sides near the irradiation site. Two additional cells analyzed in a similar way are shown in Supplementary Figure S4.
Figure 3
Figure 3
Translocation of ABDACTN-mKikGR. Time lapse images of a polarized cell expressing ABDACTN-mKikGR and migrating toward the right (A, B and C). (A) and (B) show the green and red fluorescence image of mKikGR, respectively, and (C) shows the merged images. The region bound by the yellow square was irradiated by 405 nm laser light for 0.7 s immediately after taking the pre-irradiation image (−4.8 s). Scanning for the subsequent images were started at 1.2, 5.8, 10.4, and 33.4 s after starting the 405 nm laser irradiation set as 0 s. Scale bar: 10 μm. (D) Profile of fluorescence intensity along the cortex, measured along the white arrows in the merged image (width: 1 μm) in (C), with 0 μm set at the rear end. The green and magenta lines show green and red fluorescence intensity of ABDACTN-mKikGR, respectively. The cyan lines show red fluorescence intensities of ABDACTN-mKikGR after subtracting the fluorescence intensities in the red channel that were unrelated to stimulated photoswitching. Two additional cells analyzed in a similar way are shown in Supplementary Figure S6.
Figure 4
Figure 4
Localization of actin filaments in cells expressing ABD-mKikGR. (A and C) Fluorescence micrographs of polarized cells expressing ABDFLN-mKikGR and mCherry-lifeact (A), or ABDACTN-mKikGR and mCherry-lifeact (C). The top and middle of each set show fluorescence images of mKikGR and mCherry, respectively, and the bottom of each set is the merged image of the two. (B and D) Permeabilized and fixed polarized cells expressing ABDFLN-mKikGR (B) or ABDACTN-mKikGR (D) stained with rhodamine-phalloidin. The top and middle images show fluorescence of mKikGR and rhodamine, respectively, and the bottom of each set is the merged image of the two. All cells migrated toward the right. Scale bars: 10 μm.
Figure 5
Figure 5
Localization of GAPA and translocation of ABDFLN-mKikGR in a GAPA null cell. (A) Fluorescence micrographs of a polarized cell expressing GFP-GAPA. The cell migrated toward the right of the images. (B) Intensity profile of GFP along the cortex, measured along the white line in the direction of the arrow in the inserted image (same as A). Another representative cell is shown in Supplementary Figure S7, A and B. (C–E) Time lapse images of a GAPA null cell expressing ABDFLN-mKikGR and migrating toward the right. (C) and (D) show the green and red fluorescence images of mKikGR, respectively, and (E) shows the merged images. The region bound by the yellow square was irradiated by 405 nm laser light for 2.4 s immediately after taking the pre-irradiation image (−4.9 s). Scanning of the subsequent images were started at 2.9, 7.6, 12.2, and 16.9 s after starting the 405 nm irradiation set as 0 s. Scale bars: 10 μm. (F) Profiles of fluorescence intensities along the cell cortex in the region and direction shown by the white arrows in (E), with the 0 μm set at the rear end. The green and magenta lines show fluorescence intensities of ABDFLN-mKikGR in the green and red channels, respectively. The cyan line shows red fluorescence intensity of ABDFLN-mKikGR after subtracting the fluorescence intensity in the red channel that was unrelated to the stimulated photoswitch. The purple vertical bars in the −4.9 s graph shows the irradiated region on the cell cortex. Two additional cells analyzed in a similar way are shown in Supplementary Figure S7 C–J.
Figure 6
Figure 6
Schematic illustration of the two mechanisms of ABDFLN translocation from the cytosol in the middle to the rear cortex of a polarized cell. (A) Diffusion and specific capture mechanism. The affinity between actin filaments and ABDFLN differs depending on the position in the cell, as indicated by the graded intensity of the red color of actin filaments. Since the affinity of the rear actin filaments for ABDFLN is stronger than other actin filaments, ABDFLN that is rapidly diffusing in the cytoplasm is specifically captured by the rear actin filaments and accumulates there. (B) Cortical actin flow mechanism. Cytosolic ABDFLN interacts with cortical actin filaments and is carried to the rear of the cell by retrograde flow (black arrows) of the cortical actin filaments. In both schemes, the front of the cell is to the right.

Similar articles

Cited by

References

    1. Pantaloni D, Le Clainche C, Carlier MF. Mechanism of actin-based motility. Science. 2001;292:1502–1506. - PubMed
    1. Small JV, Stradal T, Vignal E, Rottner K. The lamellipodium: where motility begins. Trends Cell Biol. 2002;12:112–120. - PubMed
    1. Le Clainche C, Carlier MF. Regulation of actin assembly associated with protrusion and adhesion in cell migration. Physiol Rev. 2008;88:489–513. - PubMed
    1. Pollard TD, Cooper JA. Actin, a central player in cell shape and movement. Science. 2009;326:1208–1212. - PMC - PubMed
    1. Uyeda TQP, Iwadate Y, Umeki N, Nagasaki A, Yumura S. Stretching actin filaments within cells enhances their affinity for the myosin II motor domain. PLoS ONE. 2011;6:e26200. - PMC - PubMed