. 2017:2017:6483572.
doi: 10.1155/2017/6483572. Epub 2017 Mar 20.

PGC1 α Activators Mitigate Diabetic Tubulopathy by Improving Mitochondrial Dynamics and Quality Control

Affiliations

PGC1 α Activators Mitigate Diabetic Tubulopathy by Improving Mitochondrial Dynamics and Quality Control

So-Young Lee et al. J Diabetes Res. 2017.

Abstract

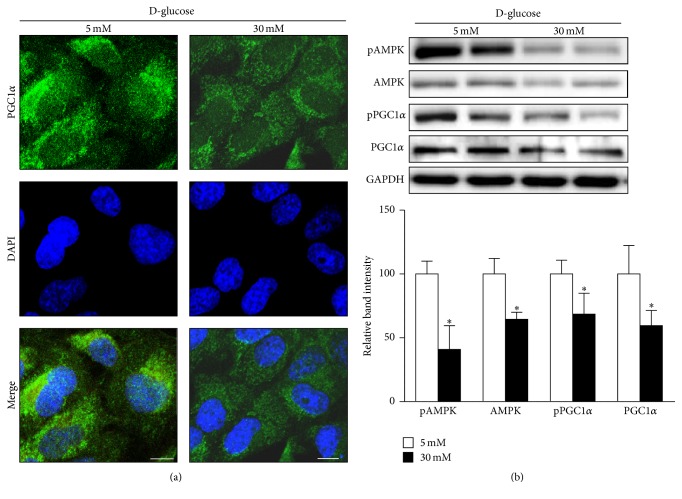
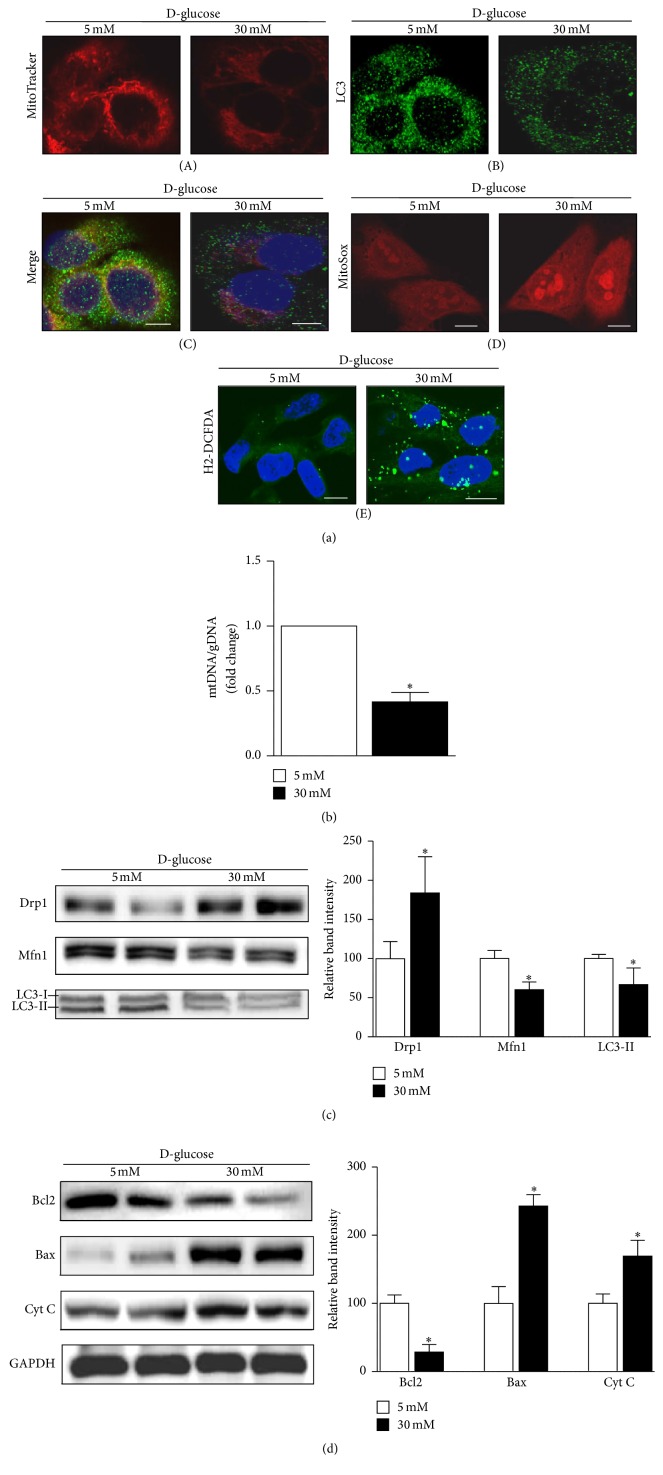
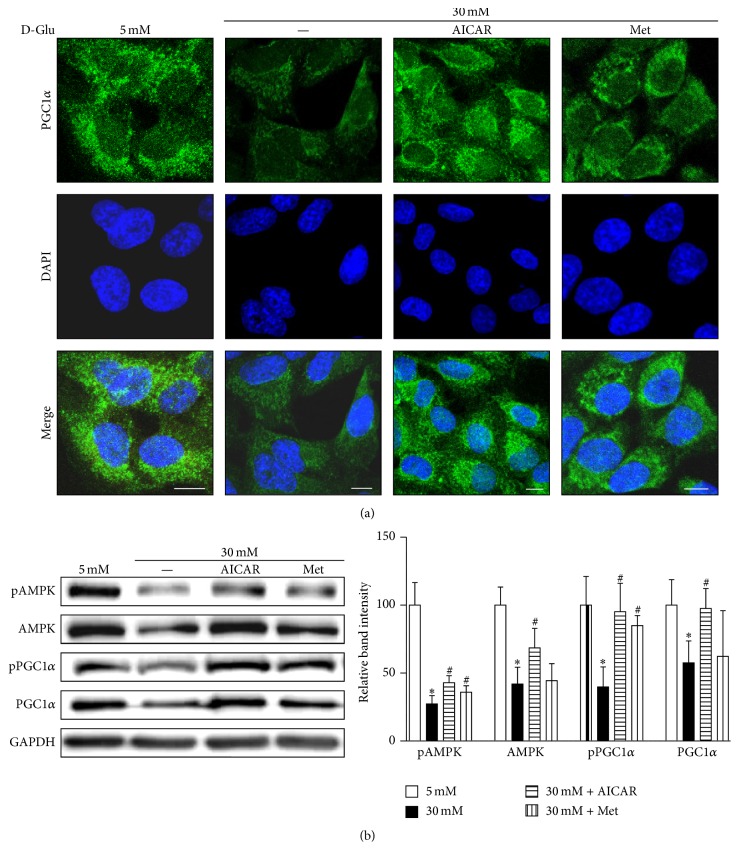
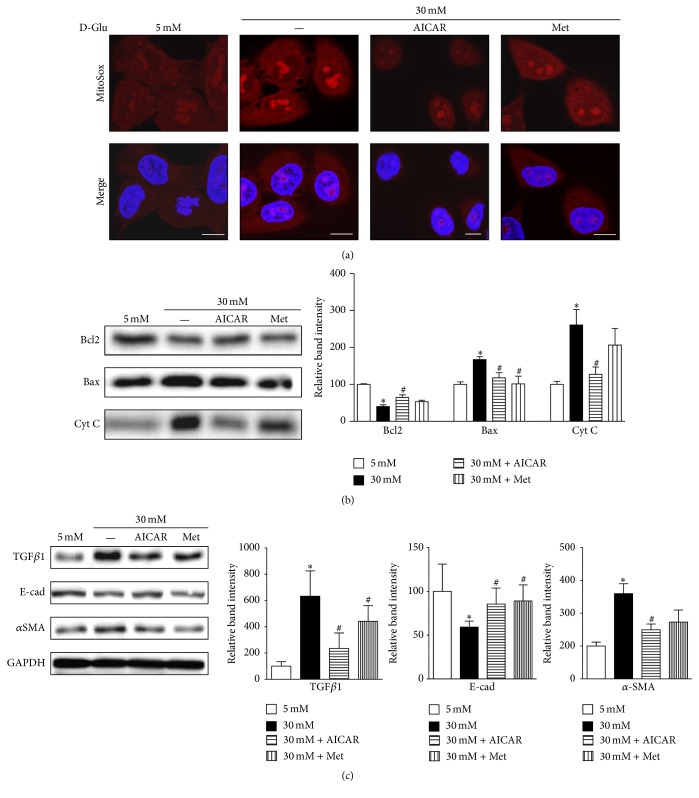
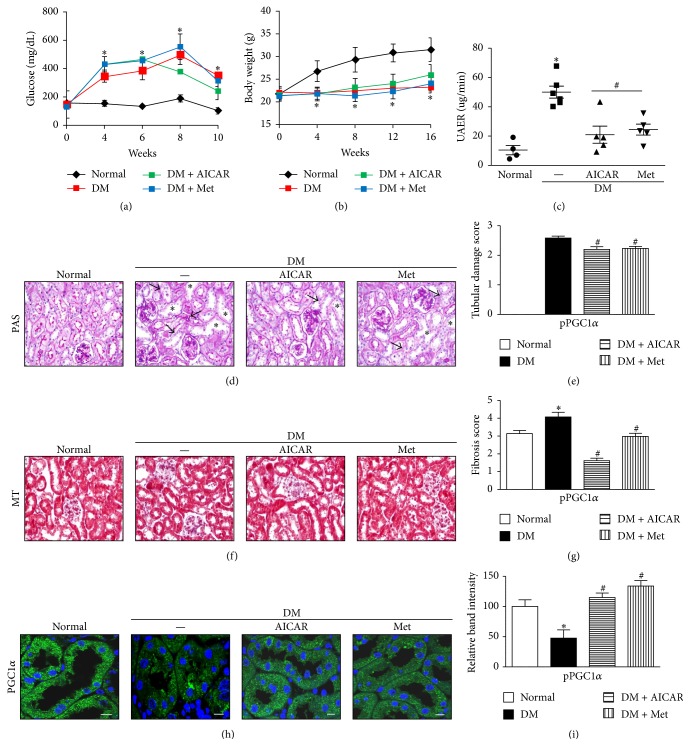
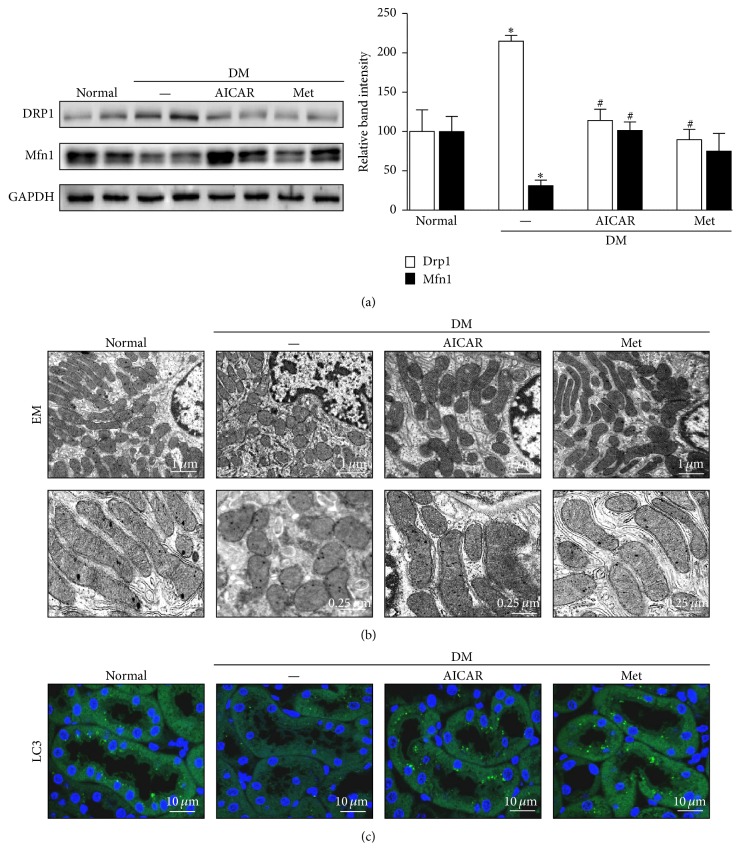
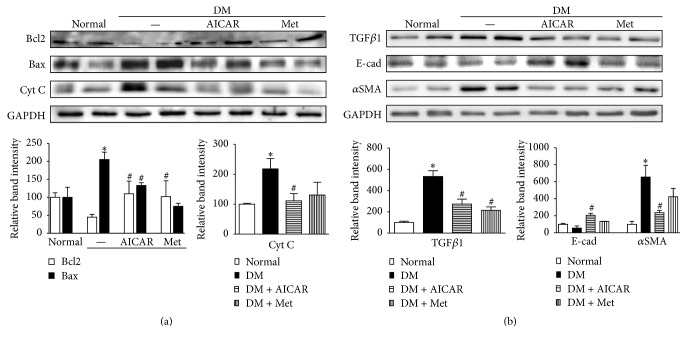
Purpose. In this study, we investigated the effect of PGC1α activators on mitochondrial fusion, fission, and autophagic quality control in renal tubular cells in a diabetic environment in vivo and in vitro. We also examined whether the upregulation of PGC1α attenuates diabetic tubulopathy by normalizing mitochondrial homeostasis. Methods. HKC8 cells were subjected to high-glucose conditions (30 mM D-glucose). Diabetes was induced with streptozotocin (STZ, 50 mg/kg i.p. for 5 days) in male C57/BL6J mice. AICAR or metformin was used as a PGC1α activator. Results. Treatment with the PGC1α activators AICAR and metformin improved functional mitochondrial mass in HKC8 cells in high-glucose conditions. Moreover, in renal proximal tubular cells, increased PGC1α activity correlated with the reversal of changes in Drp1, Mfn1, and LC3-II protein expression in a high-glucose environment. Normalized mitochondrial life cycles resulted in low ROS production and reduced apoptosis. AICAR and metformin treatment effectively mitigated albuminuria and renal histopathology and decreased the expression of TGFβ1 and αSMA in the kidneys of diabetic mice. Conclusions. Our results demonstrate that increases in PGC1α activity improve diabetic tubulopathy by modulating mitochondrial dynamics and autophagy.


Conflict of interest statement

All the authors declared no competing interests.

Figures

Figure 1
Figure 1
PGC1α and AMPK expression in human renal proximal tubular cells (RPTCs) under high-glucose conditions. (a) Representative confocal fluorescence images of PGC1α indicate that high-glucose conditions suppress PGC1α expression in human RPTCs. (b) Western blot analyses reveal downregulation of PGC1α and AMPK under high-glucose conditions (p < 0.05 compared with the 5 mM glucose condition, scale bar 10 μm).
Figure 2
Figure 2
Effect of high-glucose (HG) conditions on mitochondrial dynamics, autophagy, apoptosis, and ROS production in human renal proximal tubular cells (RPTCs). (a, A, B, and C) Under high-glucose conditions, the number of MitoTracker Red-labeled mitochondria and the expression of LC3, an autophagy marker, decrease. (a, D and E) However, mitochondrial and cytosolic ROS increase, as detected by MitoSOX (red) or H2-DCFDA (green) staining. (b) Decreased mitochondrial mass, as assessed by the mtDNA/gDNA ratio, in human RPTCs under high-glucose condition. (c) Western blot analyses reveal upregulation of the mitochondrial profission protein Drp1; the profusion protein Mfn1 and the autophagy-related protein LC3II were downregulated. (d) Bax and cytochrome C, apoptosis regulatory proteins, were upregulated in a HG environment, whereas Bcl2, an antiapoptotic protein, was downregulated (p < 0.05 versus the 5 mM glucose condition; scale bar 10 μm).
Figure 3
Figure 3
AICAR and metformin protect against the decrease in AMPK and PGC1α expression under high-glucose (HG, 30 mM) concentrations in human renal proximal tubular cells. (a) Representative confocal fluorescence images of PGC1α indicate that AICAR or metformin restore PGCα activity in human RPTCs subjected to HG concentrations. (b) Immunoblotting results show that increased AMPK activity and restored PGC1α expression are observed in human RPTCs subjected to high glucose and AICAR or metformin treatment (p < 0.05 versus 5 mM glucose treatment; #p < 0.05 versus 30 mM glucose treatment; scale bar 10 μm).
Figure 4
Figure 4
AICAR and metformin ameliorate the effect of high-glucose (HG) concentrations on mitochondrial dynamics and autophagy in human renal proximal tubular cells (RPTCs). (a, A, B, and C) Representative confocal fluorescence images of MitoTracker and LC3 show an increase in functional mitochondria and autophagic activity after exposure to HG and treatment with AICAR or metformin in human RPTCs. (b) Increased mtDNA to gDNA ratio was observed in human RPTCs treated with metformin or AICAR in the presence of HG. (c) Western blot analyses showed the reversal of alterations in the expression levels of profission (Drp1), profusion (Mfn1), and autophagy-related proteins (LC3-II) in the presence of HG after treatment with AICAR or metformin. (p < 0.05 versus 5 mM glucose; #p < 0.05 versus 30 mM glucose; scale bar 5 μm).
Figure 5
Figure 5
AICAR and metformin reduce ROS production and apoptosis and decrease TGFβ1 and αSMA expression in human renal proximal tubular cells (RPTCs) exposed to high glucose (HG). (a) Representative confocal images of MitoSOX indicate a reduction in mitochondrial ROS production after treatment with AICAR or metformin in human RPTCs subjected to HG. (b) Western blot analyses reveal decreased expression of the apoptogenic proteins cytochrome C and Bax and increased expression of the antiapoptotic protein Bcl2 after AICAR or metformin treatment under HG conditions. (c) Western blot analyses show that AICAR or metformin treatment induces the downregulation of TGFβ1 and αSMA, but upregulation of E-cad under HG conditions in human RPTCs (p < 0.05 versus 5 mM glucose; #p < 0.05 versus 30 mM; scale bar 10 μm).
Figure 6
Figure 6
AICAR and metformin increase PGC1α expression and ameliorate albuminuria and renal morphologic characteristics in kidneys of streptozotocin- (STZ-) induced diabetic mice. (a and b) The STZ-induced diabetes group had higher blood glucose levels and reduced body weights compared with the normal control group. (c) The STZ-induced diabetic mice treated with AICAR or metformin exhibited a significant reduction in urine albumin excretion rate (UAER). (d and e) Tubular dilatation (asterisk) and tubular epithelial disruption (arrow) were observed in the diabetic control group. Treatment of STZ-induced diabetic mice with AICAR or metformin resulted in less cellular disruption. (f and g) Representative photographs of Masson's trichrome-stained kidneys showed decreased renal fibrotic lesions in both AICAR and metformin-treated groups compared with the diabetic control group. (h and i) Restored PGC1α activity was confirmed by immunofluorescence and immunoblot analysis in diabetic kidneys treated with AICAR or metformin (p < 0.05 versus normal; #p < 0.05 versus diabetic control; scale bar 10 μm).
Figure 7
Figure 7
Restoration of altered mitochondrial dynamics and autophagy in STZ-induced diabetic mice after treatment of AICAR or metformin. (a) Western blot analysis revealed that AICAR or metformin treatment reverses the changes in the expression of Drp1 and Mfn1 in diabetic kidneys. (b) Electron micrographs of mitochondria in renal tubular cells. The control group displayed elongated mitochondria, whereas the diabetic group displayed short or spherical shaped mitochondria. The administration of AICAR or metformin markedly attenuated mitochondrial fragmentation in the renal tubular cells of diabetic kidneys. (c) The basal level of autophagy, indicated by punctate LC3 staining, was seen in the renal tubules of the control group and was decreased in the tubules of the diabetic group. Notably, autophagic activity was restored in the AICAR and metformin groups (p < 0.05 versus normal; #p < 0.05 versus diabetic control).
Figure 8
Figure 8
PGC1α activators attenuate renal expression of apoptogenic and fibrotic proteins in STZ-induced diabetic mice. (a) In diabetic kidneys, the protein expression of the antiapoptotic protein Bcl2 was markedly decreased, whereas the expression of the apoptogenic proteins Bax and cytochrome C (Cyt C) increased greatly. PGC1α treatment reversed the expression of these apoptogenic-related proteins. (b) Increased expression levels of TGFβ1 and αSMA were seen in the kidneys from the diabetic group, and reduced expression levels of these proteins were seen in the AICAR- and metformin-treated groups. (p < 0.05 versus normal; #p < 0.05 versus diabetic control).

References

    1. Roglic G. WHO Global report on diabetes: a summary. International Journal of Noncommunicable Diseases. 2016;1(1):3–8. doi: 10.4103/2468-8827.184853. - DOI
    1. Gnudi L., Coward R. J., Long D. A. Diabetic nephropathy: perspective on novel molecular mechanisms. Trends in Endocrinology & Metabolism. 2016;27(11):820–830. doi: 10.1016/j.tem.2016.07.002. - DOI - PubMed
    1. Ding Y., Choi M. E. Autophagy in diabetic nephropathy. The Journal of Endocrinology. 2015;224(1):R15–R30. doi: 10.1530/joe-14-0437. - DOI - PMC - PubMed
    1. Dickson L. E., Wagner M. C., Sandoval R. M., Molitoris B. A. The proximal tubule and albuminuria: really! Journal of the American Society of Nephrology. 2014;25(3):443–453. doi: 10.1681/asn.2013090950. - DOI - PMC - PubMed
    1. Tang S. C. W., Leung J. C. K., Lai K. N. Diabetic tubulopathy: an emerging entity. Contributions to Nephrology. 2011;170:124–134. doi: 10.1159/000325647. - DOI - PubMed

MeSH terms

LinkOut - more resources