. 2017 Jun;27(6):784-800.
doi: 10.1038/cr.2017.54. Epub 2017 Apr 14.

Chemotherapy-induced intestinal inflammatory responses are mediated by exosome secretion of double-strand DNA via AIM2 inflammasome activation

Affiliations

Chemotherapy-induced intestinal inflammatory responses are mediated by exosome secretion of double-strand DNA via AIM2 inflammasome activation

Qiaoshi Lian et al. Cell Res. 2017 Jun.

Abstract

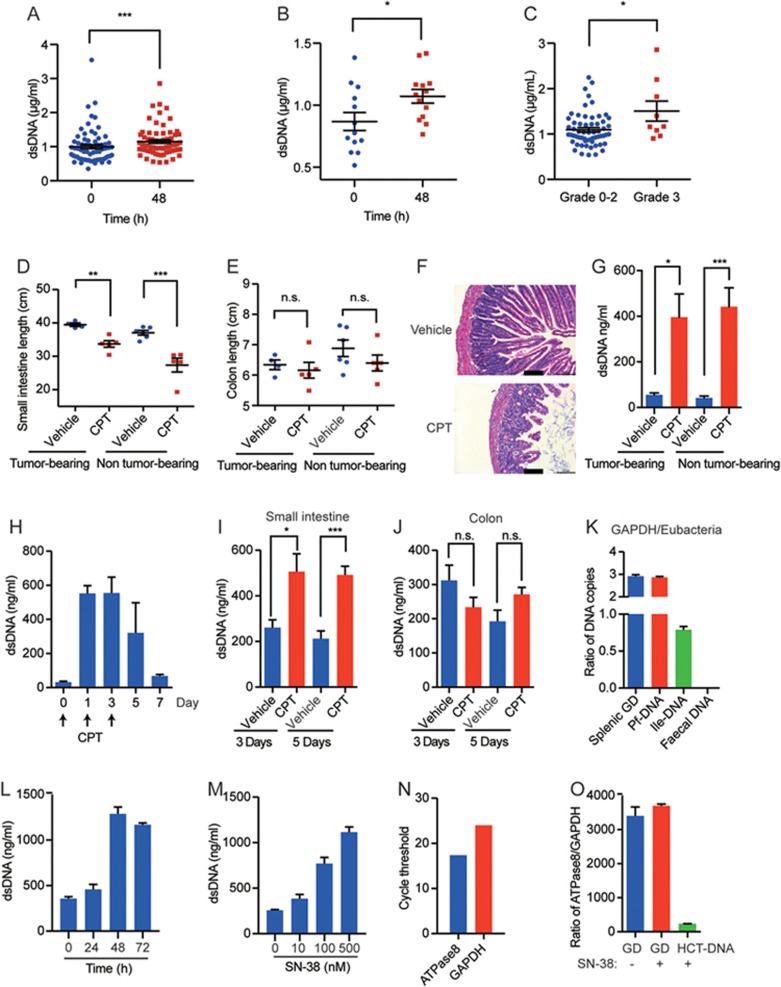
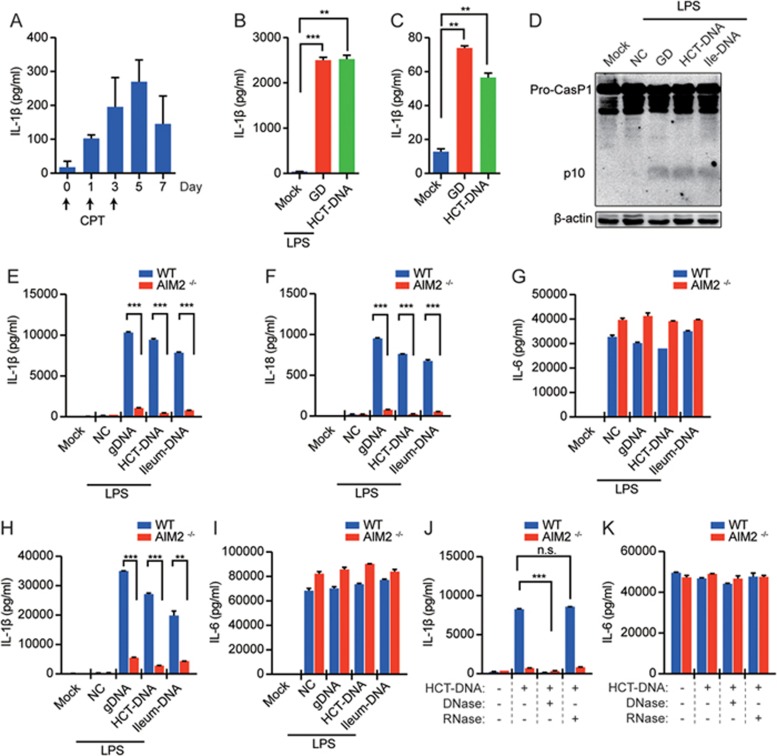
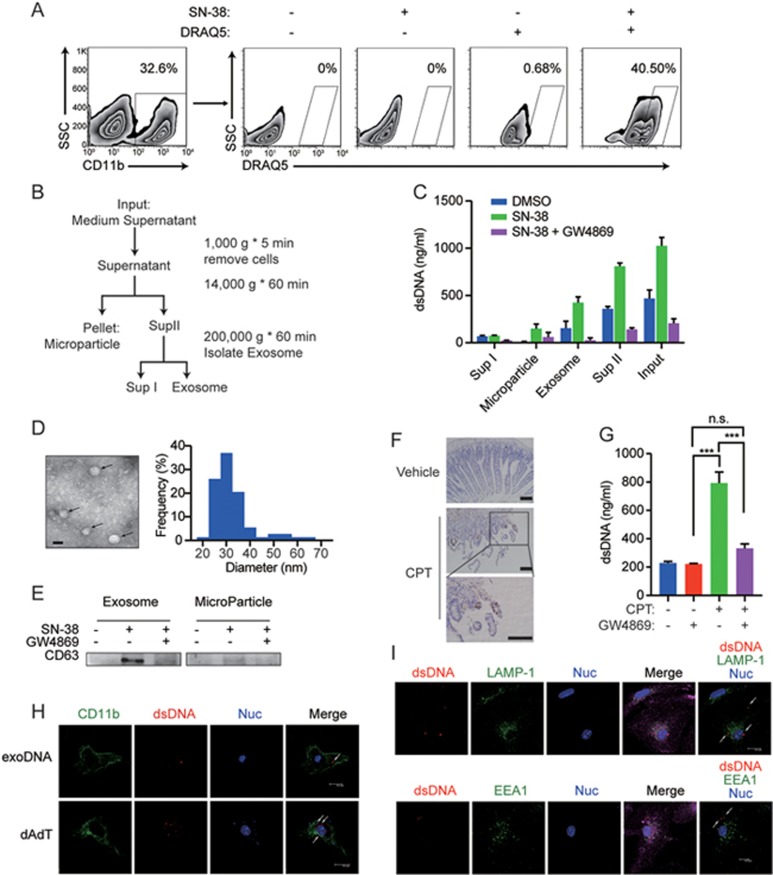
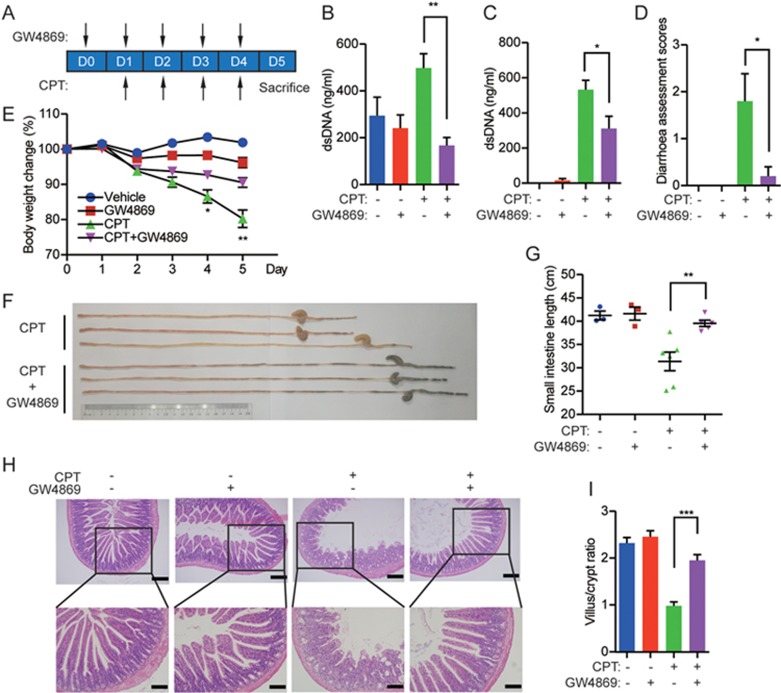
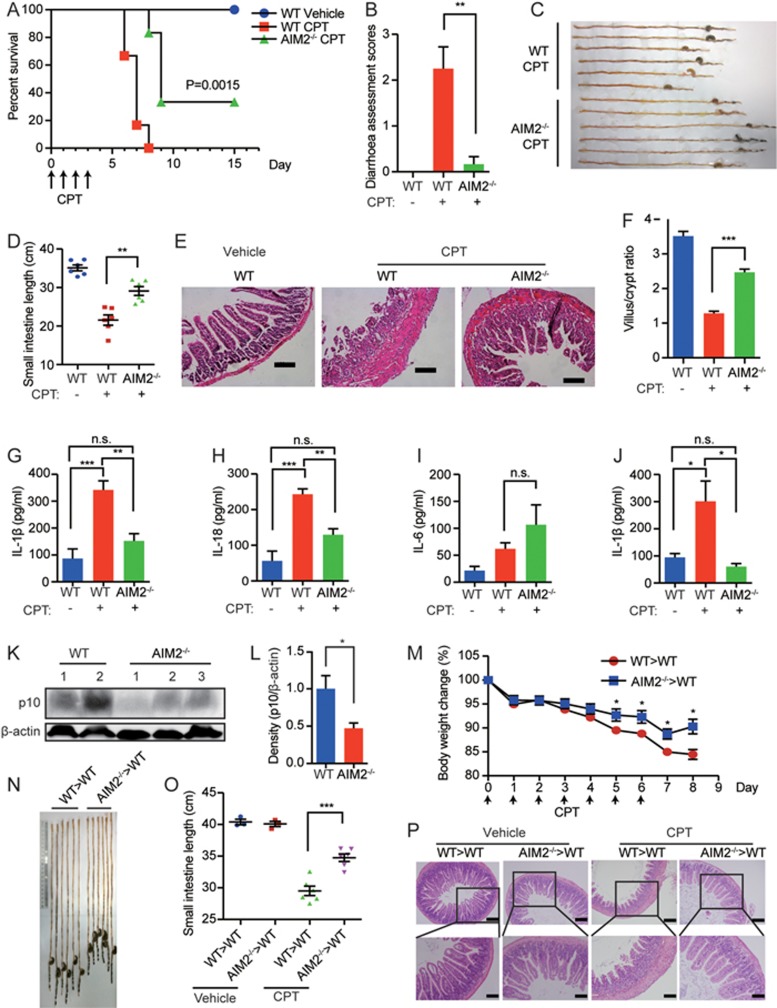
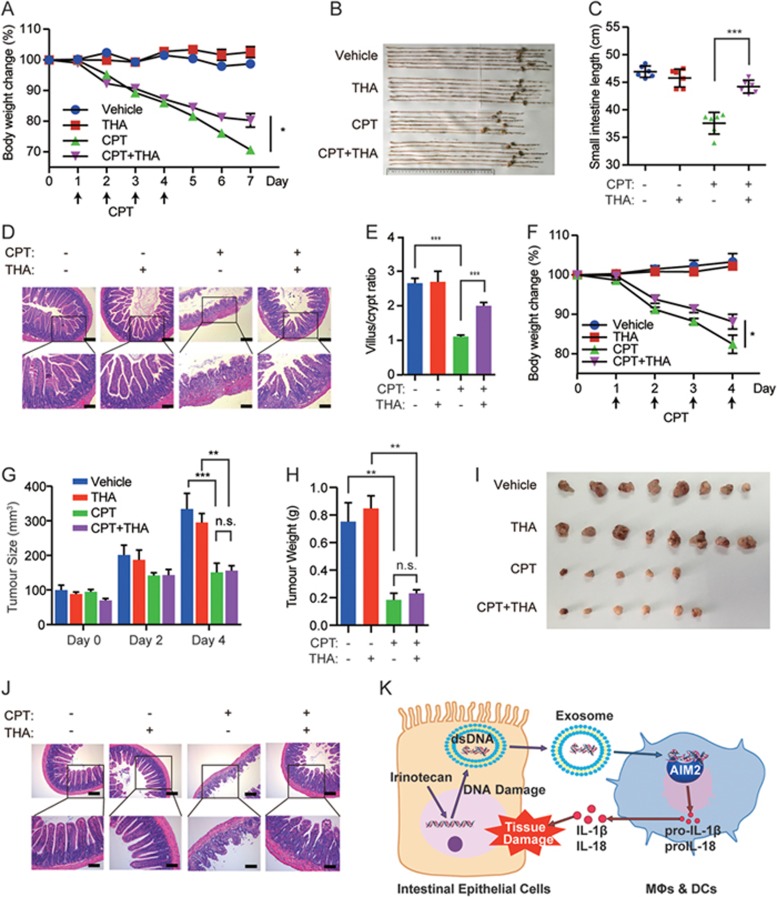
Chemotherapies are known often to induce severe gastrointestinal tract toxicity but the underlying mechanism remains unclear. This study considers the widely applied cytotoxic agent irinotecan (CPT-11) as a representative agent and demonstrates that treatment induces massive release of double-strand DNA from the intestine that accounts for the dose-limiting intestinal toxicity of the compound. Specifically, "self-DNA" released through exosome secretion enters the cytosol of innate immune cells and activates the AIM2 (absent in melanoma 2) inflammasome. This leads to mature IL-1β and IL-18 secretion and induces intestinal mucositis and late-onset diarrhoea. Interestingly, abrogation of AIM2 signalling, either in AIM2-deficient mice or by a pharmacological inhibitor such as thalidomide, significantly reduces the incidence of drug-induced diarrhoea without affecting the anticancer efficacy of CPT-11. These findings provide mechanistic insights into how chemotherapy triggers innate immune responses causing intestinal toxicity, and reveal new chemotherapy regimens that maintain anti-tumour effects but circumvent the associated adverse inflammatory response.


Figures

Figure 1
Figure 1
CPT-11 triggers dsDNA release in vivo and in vitro. (A-C) Concentration of dsDNA in patient plasma before or at 48 h post CPT-11 (CPT) treatment. Significance determined using paired or unpaired t-test. (A) Total patients; (B) patients with grade 2-3 diarrhoea; (C) patients with grade 0-2 diarrhoea versus those with grade 3 at 48 h after treatment. (D-G) Tumour-bearing or non-tumour-bearing C57BL/6 mice were treated (i.p.) with CPT-11 (75 mg/kg for tumour-bearing mice, 90 mg/kg for non-tumour-bearing mice) daily for 4 consecutive days and were sacrificed on day 5. (D) Length of small intestines; (E) length of colons; (F) representative images of H&E histopathology of ileum sections from non-tumour-bearing mice; (G) concentration of dsDNA in cell-depleted peritoneal lavage fluid. (H-J) Time-dependent release of dsDNA in cell-depleted Pf (H), flushed fluid of ileum (I), or flushed fluid of colon (J). Non-tumour-bearing C57BL/6 mice were sacrificed at indicated days following CPT-11 treatment. Arrows indicate CPT-11 administration (90 mg/kg, i.p.) on day 0-3. (K) Quantitative PCR analysis of host GAPDH and total bacterial (Eubacteria) DNA copies in DNA species isolated from Pf-DNA and ileum fluid (Ile-DNA). C57BL/6 mice were administrated with CPT-11 (90 mg/kg, i.p.) daily for 4 consecutive days and were sacrificed on day 5. Splenic GD (genomic DNA from mouse splenocytes) and faecal DNA (DNA from mouse faeces) were used as controls. (L-M) DNA concentrations in the culture medium of HCT-116 cells treated with 500 nM SN-38 at the indicated times (L) or with the indicated concentrations at 72 h (M). (N-O) Quantitative PCR analysis of ATPase8 and GAPDH DNA copies in the DNA released from HCT-116 cells (N) or in GD from HCT-116 cells (O). HCT-116 cells were treated with SN-38 (500 nM) for 72 h before harvest for DNA extraction. GD from HCT-116 cells; HCT-DNA, DNA released from HCT-116 cells. Each symbol represents one patient (A, B, and C) or one mouse (D, E). The data (D-O) are representative of three independent experiments and depict means ± SEM. *P < 0.05, **P < 0.01, ***P < 0.001. GD, genomic DNA; NS, not significant; Pf, peritoneal fluid.
Figure 2
Figure 2
CPT-11-induced dsDNA release activates the AIM2 inflammasome. (A) Time-dependent production of IL-1β in the cell-depleted peritoneal fluid. C57BL/6 mice were sacrificed at indicated days following CPT-11 treatment. Arrows indicated CPT-11 administration (90 mg/kg, i.p.) from day 0 to 3. (B-C) Production of IL-1β in BMMs transfected with GD or isolated supernatant DNA from SN-38-treated HCT-116 (HCT-DNA) with (B) or without (C) LPS priming. HCT-116 cells were treated with SN-38 (500 nM) for 72 h before harvest of supernatant. (D) Immunoblot analysis of caspase 1 in LPS-primed BMMs transfected with 1.0 μg/ml of indicated DNA. Ile-DNA, DNA isolated from the ileum of CPT-11-treated mice. C57BL/6 mice were administrated with CPT-11 (90 mg/kg, i.p.) daily for 4 consecutive days and were sacrificed on day 5 for the harvest of ileum. β-actin served as a loading control. (E-I) Production of IL-1β, IL-18, or IL-6 by BMMs (E-G) or BMDCs (H-I) from wild-type and AIM2−/− mice. BMMs and BMDCs were treated as in D. (J-K) Production of IL-1β (J) and IL-6 (K) by LPS-primed BMDCs transfected with 1.0 μg/ml of HCT-DNA pre-treated with DNase or RNase. The data are representative of three independent experiments and depict means ± SEM; *P < 0.05, **P < 0.01, ***P < 0.001. GD, genomic DNA; NS, not significant; Pro-Casp1, procaspase 1; p10, active form of caspase 1.
Figure 3
Figure 3
Released dsDNA can be transferred into macrophages via exosomes. (A) dsDNA entry into BMMs. HCT-116 cells pre-treated with SN38 (500 nM, 72 h) were stained with DRAQ5 (10 μM) and then co-cultured with BMMs for 24 h more. DRAQ5 staining in BMMs was analysed using flow cytometry. (B-E) SN-38-stimulated exosome release in HCT-116 cells. Cells were treated with indicated agents (SN-38, 500 nM; GW4869, 20 μM) for 72 h before harvesting the culture medium. (B) Flow chart of culture medium dissection; (C) concentrations of dsDNA in each fraction; (D) representative transmission electron microscope image (left panel) and size distribution (right panel) based on transmission electron microscope image analysis of exosome fractions. Scale bar, 25 nm; (E) immunoblot analysis of CD63 in exosome fractions. The microparticle fraction was used as a control. (F) Immunohistochemistry staining of CD63 in ileum isolated from C57BL/6 mice treated with CPT-11 (90 mg/kg, i.p.) for 4 consecutive days. Scale bar, 100 μm. (G) Concentrations of dsDNA in culture medium of HCT-116 cells. (H, I) Localisation of exosome dsDNA in BMMs. Mice BMMs were treated with isolated exosomes from SN-38 treated HCT-116 cells for 2-3 h, and DRAQ5-labelled poly(dA:dT) was transfected into BMMs with Lipofectamine 2000. dsDNA and subcellular organelles were stained using fluorescence confocal microscopy. (H) DRAQ5-labelled dsDNA (red), CD11b (green), and nuclei (DAPI, blue). (I) DRAQ5-labelled dsDNA (red), lysosomes (LAMP-1, upper, green), early endosomes (EEA1, lower, green), nuclei (blue), and β-actin (purple). The data are representative of three independent experiments and depict the means ± SEM.
Figure 4
Figure 4
Blockage of exosome secretion reverses the CPT-11-induced intestinal toxicity. C57BL/6 mice were treated with CPT-11 (50 mg/kg, i.p.) daily for 4 consecutive days or combined with GW4869 (2.5 mg/kg, i.p.) from 1 day before CPT-11 administration until sacrifice. (A) Flow chart of drug administrations; (B) concentrations of dsDNA in cell-depleted fluid of a 3-cm length of ileum; (C) concentrations of dsDNA in cell-depleted peritoneal lavage fluid; (D) diarrhoea assessment scores; (E) body weight change; (F) images of small intestines; (G) length of small intestines; (H) representative images of H&E staining of ileum sections; (I) villus/crypt ratio in H&E-stained ileum sections. Scale bar, 200 μm (upper) or 100 μm (lower).
Figure 5
Figure 5
AIM2-deficient mice exhibit attenuated intestinal mucositis and diarrhoea upon CPT treatment. (A-L) WT and AIM2−/− C57BL/6 mice were treated with CPT-11 (90 mg/kg, i.p) daily for 4 consecutive days and sacrificed on day 5 (B-J), 3 consecutive days and sacrificed on day 4 (K-L) or monitored daily for survival (A) (n = 6 per group). (A) Mice survival; (B) diarrhoea assessment scores; (C) images of small intestines; (D) length of small intestines; (E) representative images of H&E staining of ileum sections. Scale bar, 100 μm; (F) villus length versus crypt depth ratio in H&E-stained ileum sections; (G-I) production of IL-1β, IL-18, and IL-6 in the peritoneal lavage fluid. One millilitre of PBS was injected into the peritoneal cavity and collected for cytokines analysis; (J) IL-1β production in explant fluid from 2-cm-long ileum pieces; (K) immunoblot analysis of caspase 1 p10 in ileum lysates treated with CPT-11 (90 mg/kg, i.p.) for 3 consecutive days; (L) densitometric quantification of the band intensity of p10 versus β-actin in (K). (M-P) AIM2−/− chimera mice were constructed by transplanting bone marrow cells from WT (WT>WT) or AIM2-deficient donor mice (AIM2−/−>WT) into lethally irradiated C57BL/6 mice. Mice were then challenged with CPT-11 (50 mg/kg, i.p.) for 7 consecutive days and sacrificed on day 9. (M) Body weight changes; (N) images of small intestines; (O) length of small intestines; (P) representative images of H&E staining of ileum sections on day 9. Scale bar, 200 μm (upper) or 100 μm (lower). Each symbol represents one mouse (D, O). The data are representative of three independent experiments and depict the means ± SEM. *P < 0.05, **P < 0.01, ***P < 0.001. NS, not significant; WT, wild-type.
Figure 6
Figure 6
Inhibition of the inflammasome ameliorates CPT-11-induced intestinal toxicity. (A-E) C57BL/6 mice were administered with CPT-11 (90 mg/kg, i.p.) for 4 consecutive days or thalidomide (THA, 100 mg/kg, p.o.) daily from 1 day before CPT-11 administration until sacrifice. On day 7 after the first administration, the mice were sacrificed, and the intestines were isolated for further analysis (n = 6 per group). (A) Body weight changes; (B) images of small intestines; (C) length of small intestines; (D) representative images of H&E staining of ileum sections. Scale bar, 200 μm (upper) or 100 μm (lower); (E) analysis of the villus length versus crypt depth ratio in H&E-stained ileum sections from (D). (F-J) C57BL/6 mice were injected with MC38 tumour cells to generate the tumour-bearing model. Ten days post injection, tumour-bearing mice were administered with CPT-11 (75 mg/kg, i.p.) for 4 consecutive days and THA (100 mg/kg, p.o.) daily from 1 day before CPT-11 administration until sacrifice. On day 5 after the first administration, the mice were sacrificed, and the intestines were isolated for further analysis. (F) Body weight changes; (G) tumour size; (H) tumour weight on day 5; (I) tumour images on day 5; (J) representative images of H&E-stained ileum sections. Scale bar, 100 μm. (K) Model of dsDNA-mediated intestinal toxicity via activation of the inflammasome during CPT-11 administration. The data are representative of three independent experiments and depict the means ± SEM. *P < 0.05, **P < 0.01, ***P < 0.001. NS, not significant.

References

    1. Bracci L, Schiavoni G, Sistigu A, Belardelli F. Immune-based mechanisms of cytotoxic chemotherapy: implications for the design of novel and rationale-based combined treatments against cancer. Cell Death Differ 2014; 21:15–25. - PMC - PubMed
    1. Tesniere A, Schlemmer F, Boige V, et al. Immunogenic death of colon cancer cells treated with oxaliplatin. Oncogene 2010; 29:482–491. - PubMed
    1. Michaud M, Martins I, Sukkurwala AQ, et al. Autophagy-dependent anticancer immune responses induced by chemotherapeutic agents in mice. Science 2011; 334:1573–1577. - PubMed
    1. Apetoh L, Ghiringhelli F, Tesniere A, et al. Toll-like receptor 4-dependent contribution of the immune system to anticancer chemotherapy and radiotherapy. Nat Med 2007; 13:1050–1059. - PubMed
    1. Matzinger P. Tolerance, danger, and the extended family. Annu Rev Immunol 1994; 12:991–1045. - PubMed