. 2018 Jan;175(2):301-319.
doi: 10.1111/bph.13819. Epub 2017 Jun 18.

Glycogen phosphorylase inhibition improves beta cell function

Affiliations

Glycogen phosphorylase inhibition improves beta cell function

Lilla Nagy et al. Br J Pharmacol. 2018 Jan.

Abstract

Background and purpose: Glycogen phosphorylase (GP) is the key enzyme for glycogen degradation. GP inhibitors (GPi-s) are glucose lowering agents that cause the accumulation of glucose in the liver as glycogen. Glycogen metabolism has implications in beta cell function. Glycogen degradation can maintain cellular glucose levels, which feeds into catabolism to maintain insulin secretion, and elevated glycogen degradation levels contribute to glucotoxicity. The purpose of this study was to assess whether influencing glycogen metabolism in beta cells by GPi-s affects the function of these cells.

Experimental approach: The effects of structurally different GPi-s were investigated on MIN6 insulinoma cells and in a mouse model of diabetes.

Key results: GPi treatment increased glycogen content and, consequently, the surface area of glycogen in MIN6 cells. Furthermore, GPi treatment induced insulin receptor β (InsRβ), Akt and p70S6K phosphorylation, as well as pancreatic and duodenal homeobox 1(PDX1) and insulin expression. In line with these findings, GPi-s enhanced non-stimulated and glucose-stimulated insulin secretion in MIN6 cells. The InsRβ was shown to co-localize with glycogen particles as confirmed by in silico screening, where components of InsR signalling were identified as glycogen-bound proteins. GPi-s also activated the pathway of insulin secretion, indicated by enhanced glycolysis, mitochondrial oxidation and calcium signalling. Finally, GPi-s increased the size of islets of Langerhans and improved glucose-induced insulin release in mice.

Conclusion and implications: These data suggest that GPi-s also target beta cells and can be repurposed as agents to preserve beta cell function or even ameliorate beta cell dysfunction in different forms of diabetes.

Linked articles: This article is part of a themed section on Inventing New Therapies Without Reinventing the Wheel: The Power of Drug Repurposing. To view the other articles in this section visit http://onlinelibrary.wiley.com/doi/10.1111/bph.v175.2/issuetoc.


Figures

Figure 1
Figure 1
Structures of GPi‐s. (A) KB228, 3 μM final concentration (Ki = 937 nM). (B) BEVA335, 1.5 μM final concentration (Ki = 411 nM). (C) CP‐316819, 0.5 μM final concentration (Ki = 209 nM). (D) Kinetics of inhibition of glycogen phosphorylase b by CP316819 was analysed at a constant concentration of glycogen (1 m·V−1%) and various concentrations of glucose‐1‐phosphate (4–40 mM). The slopes of double reciprocal plots against the effective inhibitor concentrations were replotted to give the secondary plots, which were analysed and showed the Ki for the inhibitor.
Figure 2
Figure 2
The effects of the GPi‐s on glycogen content and on the size of glycogen particles in beta cells. (A) In MIN6 cells, the cytosolic localization of glycogen granules was analysed in confocal microscopy experiments. After incorporation of fluorescent‐labelled derivative of D‐glucose (2NBDG, green) into glycogen, the nuclei were visualized by staining with DAPI (in blue). Red arrows point to representative glycogen particles. Bars represent 5 μm. Brightness and contrast were adjusted on that panel. (B) MIN6 cells were treated with GPi‐s at the concentrations indicated for 24 h, and then glycogen content was determined in phenol‐sulfuric colorimetric assays (n = 6, in duplicate). (C–D) Alternatively, glycogen was assessed by morphometric analysis of ultrasections of ferrocyanide‐reduced osmium‐stained MIN6 cells. (C) Quantification of glycogen content in cells (n = 5, 10 cells analysed per run) and (D) the circumference of all of the glycogen particles in cells (n = 5, 10 cells analysed per run) were determined on EM sections. (E) Representative EM sections are presented. Red arrows point to representative glycogen granules (bars = 2 μm).
Figure 3
Figure 3
GPi‐s induce InsR signalling in MIN6 cells. MIN6 cells were treated with GPi‐s for 1 day at the indicated concentrations. In these cells, (A) phosphorylation of InsRβ subunit on tyrosine 1345, Akt on Serine 473 and S6K on threonine 389 were assessed by Western blot analysis of phosphorylated and non‐phosphorylated forms of the respective proteins. One representative blot is presented. (B) Pdx1 promoter activity was determined by luciferase assay (n = 5, in duplicate) and mRNA levels (n = 5, in duplicate or triplicate) by RT‐qPCR. PDX1 protein levels were determined in the cytoplasmic and nuclear fractions of MIN6 cell lysates by Western blotting. One representative blot is presented here. (C) In GPi‐treated cells, insulin mRNA expression (n = 5, in duplicate or triplicate), the corresponding protein levels (n = 5) and (D) insulin release (n = 6) were determined. (E) GSIS were analysed by an insulin elisa Kit (n = 5).
Figure 4
Figure 4
Co‐localization of glycogen particles and the β subunit of InsR in MIN6 cells. (A) Localization of InsRβ (IRβ) and (B) its co‐localization with glycogen in MIN6 cells were assessed in confocal microscopy experiments (n = 8). Glycogen was charged with a fluorescent glucose analogue (2NBDG, green), and InsRβ was immunostained using an InsRβ‐specific antibody and Alexa Fluor 647 secondary antibody (red). Nuclei of the cells were stained using DAPI (blue). Bars represent 5 μm, and on the inlay of panel A, the bar represents 3.5 μm. InsRβ staining was completely lost when the primary antibody was omitted during immunostaining. On the inlay of panel A, brightness and contrast were adjusted.
Figure 5
Figure 5
Inhibition of PI3K by wortmannin (WM) abolished the effects of GPi‐s in MIN6 cells. MIN6 cells were treated with GPi‐s as before, and a subset of MIN6 cells was treated with wortmannin (1 μM, for the last hour of the GPi treatment). In these cells, mRNA (n = 5, in duplicate) and protein levels (n = 5, in duplicate) of (A) PDX1 and (B) insulin were determined. For determination of insulin, total protein was extracted and insulin was quantified by a Mouse Insulin elisa Kit. Finally, (C) non‐stimulated, spontaneous (n = 5) and (D) glucose‐induced (n = 5) insulin secretion were assessed.
Figure 6
Figure 6
The GPi‐s KB228 and CP‐316819 induce the ‘classical’ insulin secretion pathway in MIN6 cells. MIN6 cells were treated with GPi‐s for 1 and 2 days. In these cells, (A) ECAR and (B) cellular OCR (n = 7, in quadruplicate or octuplicate) were determined by a Seahorse extracellular flux analyser. (C) Calcium influx was induced by 20 mM glucose and was determined by Fura‐2 AM staining (n = 5, 6–8 area of interest). Furthermore, GSIS (D) (n = 5) was determined by a Mouse Insulin elisa Kit. Insulin baseline was measured at 1 mM glucose concentration, while glucose stimulation was performed with 20 mM glucose similarly to the measurement of Ca2+‐oscillation.
Figure 7
Figure 7
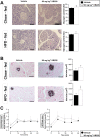
In vivo effects of KB228 treatment. Chow‐ and HFD‐fed C57/Bl6J male mice underwent repeated vehicle or KB228 treatment (weekly, 90 mg·kg−1 i.p) for at least three consecutive weeks. After they had been killed, (A) glycogen content was evaluated on PAS‐stained slides. Representative images are presented (scale bar = 50 μm). PAS positivity was evaluated by measuring the intensity of staining with Image J software. (B) The size of the islets of Langerhans was determined on insulin‐immunostained histological sections (scale bars = 50 μm). Representative images are shown. Islet size was determined in μm2 by using Image J software. We used Student's t‐test (unpaired, two‐tailed) for statistical analysis. (C) Glucose‐induced increases in serum insulin were determined using an insulin‐specific elisa kit.

Similar articles

Cited by

References

    1. Abdul‐Ghani MA (2013). Type 2 diabetes and the evolving paradigm in glucose regulation. The American journal of managed care 19: S43–50. - PubMed
    1. Agius L (2007). New hepatic targets for glycaemic control in diabetes. Best Pract Res Clin Endocrinol Metab 21: 587–605. - PubMed
    1. Agius L (2015). Role of glycogen phosphorylase in liver glycogen metabolism. Mol Aspects Med 46: 34–45. - PubMed
    1. Alexander SPH, Peters JA, Kelly E, Marrion N, Benson HE, Faccenda E et al. (2015a). The concise guide to PHARMACOLOGY 2015/16: Ligand‐gated ion channels. Br J Pharmacol 172: 5870–5903. - PMC - PubMed
    1. Alexander SP, Fabbro D, Kelly E, Marrion N, Peters JA, Benson HE et al. (2015b). The concise guide to PHARMACOLOGY 2015/16: Catalytic receptors. Br J Pharmacol 172: 5979–6023. - PMC - PubMed

Publication types