

Non-invasive assessment of murine PD-L1 levels in syngeneic tumor models by nuclear imaging with nanobody tracers
- PMID: 28410210
- PMCID: PMC5522039
- DOI: 10.18632/oncotarget.16708
Non-invasive assessment of murine PD-L1 levels in syngeneic tumor models by nuclear imaging with nanobody tracers
Abstract
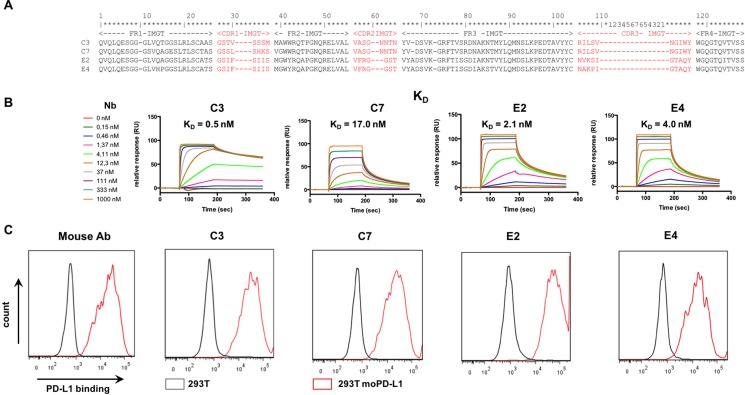
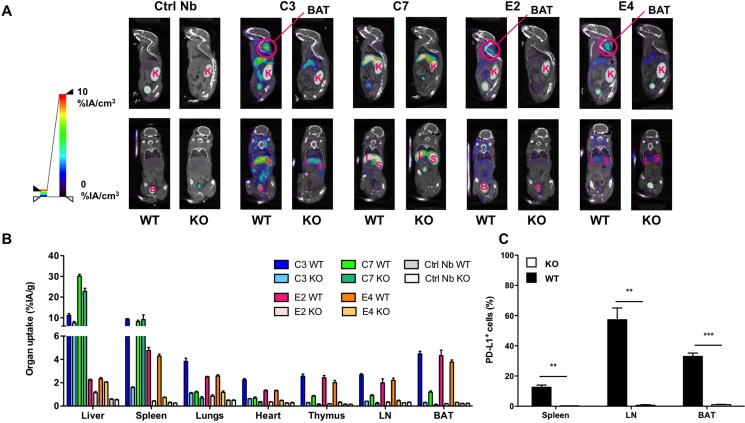
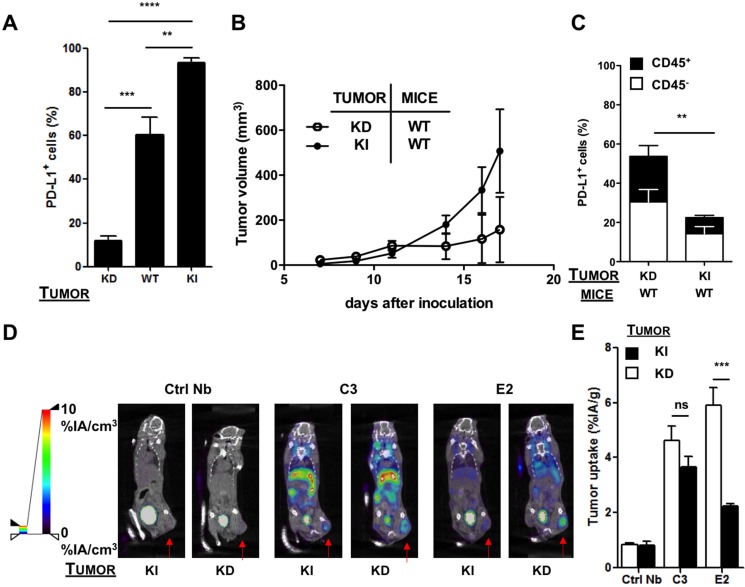
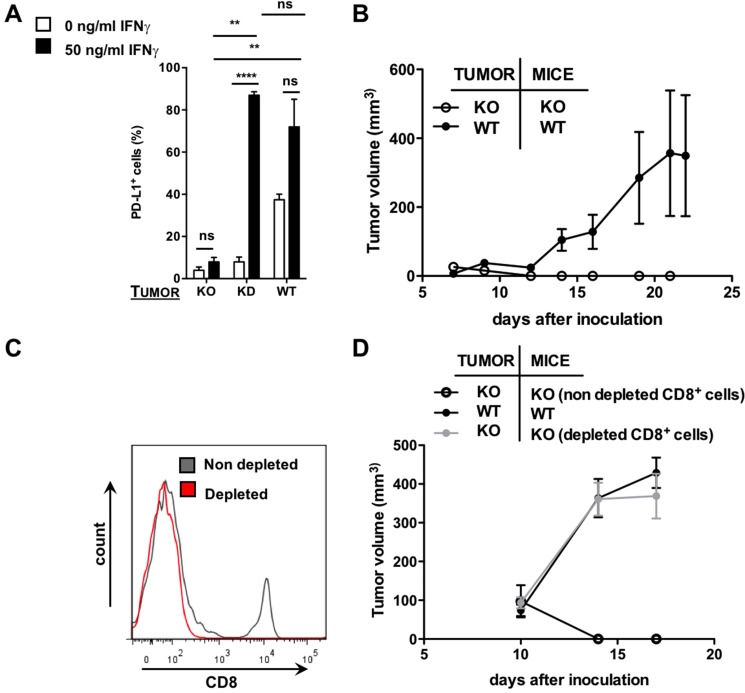
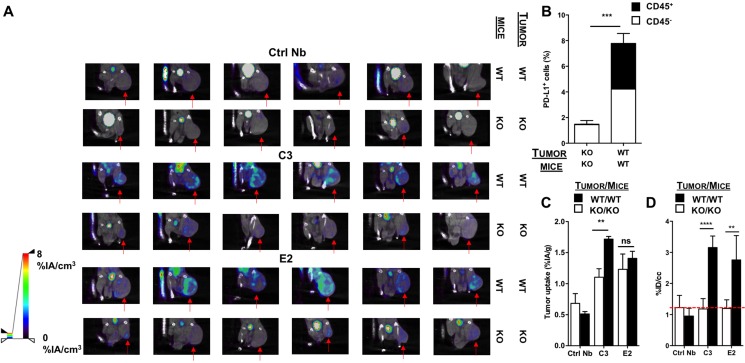
Blockade of the inhibitory PD-1/PD-L1 immune checkpoint axis is a promising cancer treatment. Nonetheless, a significant number of patients and malignancies do not respond to this therapy. To develop a screen for response to PD-1/PD-L1 inhibition, it is critical to develop a non-invasive tool to accurately assess dynamic immune checkpoint expression. Here we evaluated non-invasive SPECT/CT imaging of PD-L1 expression, in murine tumor models with varying PD-L1 expression, using high affinity PD-L1-specific nanobodies (Nbs). We generated and characterized 37 Nbs recognizing mouse PD-L1. Among those, four Nbs C3, C7, E2 and E4 were selected and evaluated for preclinical imaging of PD-L1 in syngeneic mice. We performed SPECT/CT imaging in wild type versus PD-L1 knock-out mice, using Technetium-99m (99mTc) labeled Nbs. Nb C3 and E2 showed specific antigen binding and beneficial biodistribution. Through the use of CRISPR/Cas9 PD-L1 knock-out TC-1 lung epithelial cell lines, we demonstrate that SPECT/CT imaging using Nb C3 and E2 identifies PD-L1 expressing tumors, but not PD-L1 non-expressing tumors, thereby confirming the diagnostic potential of the selected Nbs. In conclusion, these data show that Nbs C3 and E2 can be used to non-invasively image PD-L1 levels in the tumor, with the strength of the signal correlating with PD-L1 levels. These findings warrant further research into the use of Nbs as a tool to image inhibitory signals in the tumor environment.
Keywords: SPECT/CT imaging; biomarker; immune checkpoints; nanobodies; programmed death-1/programmed death-Ligand 1.
Conflict of interest statement
The authors disclose that there are no conflicts of interest.
Figures
Similar articles
-
Nanobody-mediated SPECT/CT imaging reveals the spatiotemporal expression of programmed death-ligand 1 in response to a CD8+ T cell and iNKT cell activating mRNA vaccine.Theranostics. 2023 Oct 9;13(15):5483-5500. doi: 10.7150/thno.85106. eCollection 2023. Theranostics. 2023. PMID: 37908728 Free PMC article.
-
PD-L1 microSPECT/CT Imaging for Longitudinal Monitoring of PD-L1 Expression in Syngeneic and Humanized Mouse Models for Cancer.Cancer Immunol Res. 2019 Jan;7(1):150-161. doi: 10.1158/2326-6066.CIR-18-0280. Epub 2018 Nov 20. Cancer Immunol Res. 2019. PMID: 30459153
-
Noninvasive Evaluation of Tumoral PD-L1 Using a Novel 99mTc-Labeled Nanobody Tracer with Rapid Renal Clearance.Mol Pharm. 2024 Apr 1;21(4):1977-1986. doi: 10.1021/acs.molpharmaceut.3c01219. Epub 2024 Feb 23. Mol Pharm. 2024. PMID: 38395797
-
Noninvasive Imaging of Immune Checkpoint Ligand PD-L1 in Tumors and Metastases for Guiding Immunotherapy.Mol Imaging. 2017 Jan-Dec;16:1536012117718459. doi: 10.1177/1536012117718459. Mol Imaging. 2017. PMID: 28707500 Free PMC article. Review.
-
Is There a Role for Programmed Death Ligand-1 Testing and Immunotherapy in Colorectal Cancer With Microsatellite Instability? Part II-The Challenge of Programmed Death Ligand-1 Testing and Its Role in Microsatellite Instability-High Colorectal Cancer.Arch Pathol Lab Med. 2018 Jan;142(1):26-34. doi: 10.5858/arpa.2017-0041-RA. Epub 2017 Nov 9. Arch Pathol Lab Med. 2018. PMID: 29120224 Review.
Cited by
-
Design, Synthesis, and Biological Evaluation of Small-Molecule-Based Radioligands with Improved Pharmacokinetic Properties for Imaging of Programmed Death Ligand 1.J Med Chem. 2023 Dec 14;66(23):15894-15915. doi: 10.1021/acs.jmedchem.3c01355. Epub 2023 Dec 1. J Med Chem. 2023. PMID: 38038981 Free PMC article.
-
Noninvasive imaging of the PD-1:PD-L1 immune checkpoint: Embracing nuclear medicine for the benefit of personalized immunotherapy.Theranostics. 2018 Jun 7;8(13):3559-3570. doi: 10.7150/thno.24762. eCollection 2018. Theranostics. 2018. PMID: 30026866 Free PMC article. Review.
-
Targeted Nanobody-Based Molecular Tracers for Nuclear Imaging and Image-Guided Surgery.Antibodies (Basel). 2019 Jan 11;8(1):12. doi: 10.3390/antib8010012. Antibodies (Basel). 2019. PMID: 31544818 Free PMC article. Review.
-
Single Domain Antibody-Mediated Blockade of Programmed Death-Ligand 1 on Dendritic Cells Enhances CD8 T-cell Activation and Cytokine Production.Vaccines (Basel). 2019 Aug 7;7(3):85. doi: 10.3390/vaccines7030085. Vaccines (Basel). 2019. PMID: 31394834 Free PMC article.
-
Integrating Artificial Intelligence and PET Imaging for Drug Discovery: A Paradigm Shift in Immunotherapy.Pharmaceuticals (Basel). 2024 Feb 6;17(2):210. doi: 10.3390/ph17020210. Pharmaceuticals (Basel). 2024. PMID: 38399425 Free PMC article. Review.
References
-
- Coulie PG, Van den Eynde BJ, van der Bruggen P, Boon T. Tumour antigens recognized by T lymphocytes: at the core of cancer immunotherapy. Nat Rev Cancer. 2014;14:135–46. - PubMed
-
- Pen JJ, Aerts JL, Liechtenstein T, Escors D, Breckpot K. Manipulating Immune Regulatory Pathways to Enhance T Cell Stimulation. Immune Response Activation. 2014 doi: 10.5772/57539. - DOI
-
- Brahmer JR, Drake CG, Wollner I, Powderly JD, Picus J, Sharfman WH, Stankevich E, Pons A, Salay TM, McMiller TL, Gilson MM, Wang C, Selby M, et al. Phase I study of single-agent anti-programmed death-1 (MDX-1106) in refractory solid tumors: safety, clinical activity, pharmacodynamics, and immunologic correlates. J Clin Oncol. 2010;28:3167–75. - PMC - PubMed
MeSH terms
Substances
LinkOut - more resources
Full Text Sources
Other Literature Sources
Research Materials
Miscellaneous
