. 2017 Apr 14;13(4):e1006740.
doi: 10.1371/journal.pgen.1006740. eCollection 2017 Apr.

Loss of Arf4 causes severe degeneration of the exocrine pancreas but not cystic kidney disease or retinal degeneration

Affiliations

Loss of Arf4 causes severe degeneration of the exocrine pancreas but not cystic kidney disease or retinal degeneration

Jillian N Pearring et al. PLoS Genet. .

Abstract

Arf4 is proposed to be a critical regulator of membrane protein trafficking in early secretory pathway. More recently, Arf4 was also implicated in regulating ciliary trafficking, however, this has not been comprehensively tested in vivo. To directly address Arf4's role in ciliary transport, we deleted Arf4 specifically in either rod photoreceptor cells, kidney, or globally during the early postnatal period. Arf4 deletion in photoreceptors did not cause protein mislocalization or retinal degeneration, as expected if Arf4 played a role in protein transport to the ciliary outer segment. Likewise, Arf4 deletion in kidney did not cause cystic disease, as expected if Arf4 were involved in general ciliary trafficking. In contrast, global Arf4 deletion in the early postnatal period resulted in growth restriction, severe pancreatic degeneration and early death. These findings are consistent with Arf4 playing a critical role in endomembrane trafficking, particularly in the pancreas, but not in ciliary function.


Conflict of interest statement

The authors have declared that no competing interests exist.

Figures
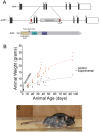
Fig 1
Fig 1. Generation of the floxed Arf4 allele to characterize tamoxifen-induced deletion of Arf4 postnatally.
A. The mouse Arf4 gene consists of six exons. The Arf4flox mouse has LoxP sites flanking exons 2 and 3. Upon Cre recombinase expression, a frame shift is introduced after residue 22 causing early truncation of this 180 amino acid protein. The position of the early truncation site in relationship to the N-terminal functional regions of ARF4 is illustrated on the cartoon at the bottom of this panel. B. Tamoxifen was administered to Arf4flox/CagCreER mice by intraperitoneal injection on P2. Animals were genotyped at P10 where only 2/3 as many experimental mice were identified as expected (P = 0.0002 by Chi-square analysis). Orange and black dots represent weights of control and experimental mice at harvest. Curves are logarithmic best fits and are significantly different (P = 0.0003 by F test). C. At P91, Arf4 experimental mice are smaller in size and have grey coat color compared to littermate controls. Both experimental and control mice were black until 6–7 weeks of age when the experimental mice turned grey. Experimental mice were noticeably smaller and died at random times.
Fig 2
Fig 2. Subcellular localization of Arf4 in mouse embryonic fibroblasts.
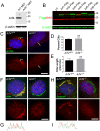
A. Affinity purified rabbit polyclonal raised against mouse Arf4 detected native Arf4 at ~17kD in wild type MEFs, but not in the Arf4-/- MEFs. B. Affinity purified rabbit polyclonal raised against mouse Arf4 (red) detected overexpressed Flag-tagged Arf4 but did not react with the other five Flag-tagged mouse Arfs expressed in mIMCD3 cells. Anti-Flag (green) was used to detect the overexpressed Arf-Flags. The anti-Arf4 antibody also detected native Arf4 at ~17kD in the mIMCD3 cells. UT, untransfected mIMCD3. C. Immunofluorescence of wild type or Arf4-/- MEFs stained with anti-Arf4 antibody (red), cilia marker (anti-Arl13b antibody, green) and nuclei (DAPI, blue). Bottom image of each pair is the Arf4 (red) channel alone. The Golgi-localized Arf4 staining observed in wild type cells is absent in the mutants. Cilia are present in both genotypes and there is no detectable Arf4 in the cilia. Scale bar = 10 μm. D. Graph showing the percent of cells that contained cilia in wild-type and Arf4-/- cells. N is >100 cells from three MEF lines for each genotype. E. Graph showing length of cilia in wild-type and Arf4-/- MEFs. Cilia length was measured on 34 cells from three MEF lines per genotype. F. Immunofluorescence of wild type or Arf4-/- MEFs stained with an anti-Arf4 antibody (red), a cis-medial Golgi compartment marker Helix pomatia agglutinin (HPA, green) and nuclei (DAPI, blue). Bottom image of each pair is the Arf4 (red) channel alone. Scale bar = 10 μm. G. Intensity profile of the Arf4 (red) and HPA (green) channels along the line in the top left panel of F. Note the extensive coordination between the peaks in the two channels along most of the line. H. Immunofluorescence of wild type or Arf4-/- MEFs stained with anti-Arf4 antibody (red), a trans-Golgi compartment marker (anti-Golgin97 antibody, green) and nuclei (DAPI, blue). Bottom image of each pair is the Arf4 (red) channel alone. Scale bar = 10 μm. I. Intensity profile of the Arf4 (red) and Golgin97 (green) channels along the line in H (top left panel). Note the lack of coincidence between the two channels.
Fig 3
Fig 3. Deletion of Arf4 from the retina does not disrupt rhodopsin localization or photoreceptor morphology.
A. Representative Western blots show serial dilutions of control (Arf4+/flox/CagCreER) and experimental (Arf4flox/flox/CagCreER) eyecup lysates for Arf4 and Hsp90 proteins. Mice were analyzed at P48. B. The fluorescent signal produced by the Arf4 band was normalized to Hsp90 and plotted against total protein loaded. The slope of the curves was used to calculate the amount of each protein in control and experimental eyecups. C. Quantification of Arf4 levels in tamoxifen-treated Arf4flox/CagCreER eyecups. Level remaining is relative to Hsp90. **p = 0.001. N = 5 for each genotype, from eyecups collects between P30-P50. D. Immunofluorescence of Arf4flox/CagCreER experimental and control retinal cross-sections using anti-Arf4 antibody (green). Specific retinal layers are shown by staining with an extracellular lectin, wheat-germ agglutinin (red, middle panel). Retinal biosynthetic membranes were stained with the Golgi marker anti-GM130 antibody (magenta, bottom panel). The position of Golgi in photoreceptors is marked by arrowhead. In all panels, nuclei stained with Hoechst (blue). Eyes were collected at P34. Scale bar = 20 μm. E. Arf4 immunostaining in Arf4flox/CagCreER experimental and control retinal cross-sections. Image of the photoreceptor IS where the biosynthetic membranes are localized. Eyes were collected at P34. Scale bar = 10 μm. F. Rhodopsin immunostaining in Arf4flox/CagCreER experimental and control retinal cross-sections. Eyes were collected at P34. Scale bar = 10 μm. G. Comparative analysis of photoreceptor morphology in Arf4flox/CagCreER experimental and control retinal cross-sections. Eyes were collected at P41. Scale bar = 20 μm. OS = outer segment, IS = inner segment, ONL = outer nuclear layer, OPL = outer plexiform layer, INL = inner nuclear layer, IPL = inner plexiform layer, GC = ganglion cell layer.
Fig 4
Fig 4. Specific deletion of Arf4 from rod photoreceptors does not affect rhodopsin localization to the ciliary outer segment compartment or photoreceptor morphology.
A. The distribution of Arf4 in 20 μm tangential sections through the entire retina of Arf4+/flox/iCre75 control and Arf4flox/flox/iCre75 experimental mice. A representative cross-section of a retina is shown above the Western blot panes. Peripherin was used as a marker for the outer segment layer, while phosducin marks the photoreceptor layer. A cartoon of a photoreceptor is used to depict each section. Mice were analyzed at 4 months of age in this and in all other panels. B-D. Immunofluorescence of Arf4flox/iCre75 experimental and control retinal cross-sections using anti-Arf4 antibody (green, B), the Golgi marker anti-GM130 antibody (red, C) and anti-rhodopsin antibody (green, D). In all panels, nuclei stained with Hoechst (blue). Scale bar = 10 μm. E. Comparative analysis of photoreceptor morphology in Arf4flox/iCre75 experimental and control retinal cross-sections. Eyes were collected at P60. Scale bar = 20 μm. OS = outer segment, IS = inner segment, ONL = outer nuclear layer.
Fig 5
Fig 5. Arf4 is not a cystic kidney disease gene.
A. H&E stained sections of Arf4flox/CagCreER kidneys. Note lack of cystic kidney disease, while mild dilation of the renal pelvis or hydronephrosis (arrows) was observed in 7 of 7 experimental animals examined. Kidneys were collected at P48. Each kidney is a composite of 8 images. Scale bar = 1 mm. B. Kidney sections of Arf4flox/CagCreER control and experimental animals stained with a proximal tubule marker (LTA, green), collecting duct marker (aquaporin-2, red) and the renal corpuscle marker (T1α, blue). Kidneys were collected at P91. Scale bar = 50 μm. Green is mostly autofluorescence. C. Kidney sections of Arf4flox/CagCreER control and experimental mice stained for cilia (Arl13b, red), centrosome (gamma tubulin, green) and proximal tubule (LTA, blue) markers. Asterisks mark red blood cells. Scale bar = 10 μm. D. Percent cilia in proximal tubules of Arf4flox/CagCreER animals. Percent cilia was determined by examining Z-stacks of proximal tubules stained with centrosome and cilia markers and presented as percent of centrosomes (or centrosome pairs in G2 cells) that are ciliated. N = >100 centrosomes from three animals of each genotype. ns, not significant. E. Quantification of Arf4 levels in tamoxifen-treated Arf4flox/CagCreER kidneys. The contralateral kidney from control and experimental animals used for histological studies was analyzed for Western blotting. Level remaining is relative to Hsp90. **p = 0.011. N = 4 for each genotype. F. Quantification of total kidney weight to body weight. Data was pooled from the animals shown in Fig 1B. ***p<0.0001 with respect to controls. G. Image of Pkd2flox/CagCreER control and experimental kidneys at P14. Grid lines are 1.35 cm apart. H. Kidney to body weight comparisons of Pkd2flox/CagCreER control and experimental animals at P14. N = 9 experimental and 28 controls. ***p<0.0001 with respect to controls. I. H&E image of Pkd2flox/CagCreER control and experimental kidneys at P14. Scale bar is 1 mm. J. Image of Ift20flox/CagCreER control and experimental kidneys at P21. Grid lines are 1.35 cm apart. K. Kidney to body weight comparisons of Ift20flox/CagCreER control and experimental animals. N = 4 for both genotypes. ***p<0.0001 with respect to controls. L. H&E image of Ift20flox/CagCreER control and experimental kidneys at P21. Scale bar is 1 mm.
Fig 6
Fig 6. Specific deletion of Arf4 from collecting ducts with HoxB7-Cre does not cause cystic kidney disease gene.
A-B. Kidney sections of Arf4flox/HoxB7-Cre control and experimental animals stained for collecting duct marker (aquaporin-2, red) and DNA (DAPI, blue in A, green in B). Kidneys in A were collected at P21 and in B were collected at P175. M = medulla, C = cortex. Scale bar in A = 500 μm, in B = 100 μm. C. Kidney sections of Arf4flox/HoxB7-Cre control and experimental mice stained for cilia (Arl13b, red), centrosome (gamma tubulin, green) and collecting duct (aquaporin-2, blue) markers. * marks red blood cells. Scale bar = 10 μm. Each image is a maximum projection of 16 confocal images taken at 0.5 μm intervals. D. Quantification of total kidney weight to body weight. Arf4flox/HoxB7-Cre animals are separated by age group. N = 5–7 animals for each genotype and age. ns, not significant with respect to controls at same age. E. Percent cilia in collecting ducts of Arf4flox/HoxB7-Cre animals. Percent cilia was determined by examining Z-stacks of proximal tubules stained with centrosome and cilia markers and presented as percent of centrosome (or centrosome pairs in G2 cells) that are ciliated. N = >100 centrosomes from three animals of each genotype. Difference is not significant. F. Quantification of Arf4 levels in Arf4flox/HoxB7-Cre kidneys. The kidney papilla, which is about 50% collecting duct cells, was dissected from the rest of the kidney and analyzed by Western blotting. Level remaining is relative to Hsp90. *p = 0.01. N = 4 for each genotype. G. The mTmG Cre reporter was crossed into the Arf4flox, HoxB7-Cre line. With this reporter, Cre activity switches expression of RFP (blue) to GFP (green). HoxB7-Cre is active in collecting ducts, which were marked by aquaporin-2 (red). Note the absence of GFP-positive collecting duct cells from Cre negative animals whereas most collecting duct cells are GFP positive in experimental animals expressing HoxB7-Cre. Large arrow marks GFP-positive cells while the arrow head marks a cell that was not converted from RFP to GFP. Scale bar = 50 μm. Each image is a maximum projection of 11 confocal images taken at 1 μm intervals. H. Quantification of Cre-active collecting ducts cells. ***p<0.0001, n = 3 animals of each genotype >400 cells counted per animal.
Fig 7
Fig 7. Postnatal deletion of Arf4 causes exocrine pancreas degeneration.
A. Pancreas (P) dissected from a P91 control and experimental Arf4flox/CagCreER siblings. Note the smaller pancreas in the experimental compared to the control and the lack of the mesenteric fat pad (F) that normally associates with the pancreas. St = stomach, SI = small intestine. Grid lines are 1.35 cm apart. B. Quantification of Arf4 levels in Arf4flox/CagCreER pancreas at two developmental time points, P10 and P28. Arf4 remaining was estimated to be 27% of normal at P10 and 45% at P28. Level remaining is relative to Hsp90. N = 4 for each genotype. C. H&E stained sections of control and experimental Arf4flox/CagCreER pancreas. Note the endocrine pancreas (Islet) is normally embedded in the exocrine pancreas but in the experimental animal the islets are separated from the exocrine cells and surrounded by fat and connective tissue. Scale bar = 50 μm. D. Sections of control and experimental pancreas Arf4flox/CagCreER stained for beta cells (insulin, green), alpha cells (glucagon, red) and DNA (DAPI, blue). As with the H&E images, note that the islets have lost their tight association with the exocrine pancreas. Scale bar = 100 μm. E. Trichrome blue stained sections of control and experimental Arf4flox/CagCreER pancreas. Note in control and experimental pancreas, trichrome blue-positive stain is observed near the islet-associated blood vessels (arrow) but in the experimental pancreas positive stain is distributed through the exocrine pancreas (arrowhead) indicating extensive fibrosis. Scale bar = 100 μm. F. Sections of control and experimental pancreas Arf4flox/CagCreER stained for peanut agglutinin (PNA, green), lipid droplets (perilipin-A, red) and DNA (DAPI, blue). Note the clusters of perilipin-A-positive adipocytes (arrows) in the experimental animals and the lack of these cells in the control. PNA labels zymogen granules in acinar cells and the intercalated ducts connecting the acinar cells. Arrowheads mark examples where the zymogen granules and the duct are visible. Note the loss of PNA label in the experimental pancreas as compared to the control. Scale bar = 50 μm. Image is a maximum projection of a 10 image z-stack taken at 0.5 μm intervals.
Fig 8
Fig 8. Electron microscopy of the pancreas.
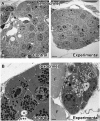
A. Transmission electron micrographs of islets from control and experimental Arf4flox/CagCreER pancreas. Insulin-producing beta cells (β) are marked by insulin containing granules with clear halos. Glucagon-producing alpha cells (α) are marked by similar-sized granules lacking the clear halos. No differences were detected in either the beta or alpha cells between the two genotypes. Scale bar = 5 μm. B. Transmission electron micrographs of control and experimental Arf4flox/CagCreER exocrine cells. Note the large electron dense zymogen granules (arrows) in the control image. Most experimental exocrine cells showed evidence of degeneration including vacuolization of the zymogen granules (arrows). F marks fat cells, * marks the lumen of acini. Scale bar = 2 μm.

Similar articles

Cited by

References

    1. Powles-Glover N. Cilia and ciliopathies: classic examples linking phenotype and genotype-an overview. Reprod Toxicol. 2014;48:98–105. 10.1016/j.reprotox.2014.05.005 - DOI - PubMed
    1. Hsiao YC, Tuz K, Ferland RJ. Trafficking in and to the primary cilium. Cilia. 2012;1(1):4 10.1186/2046-2530-1-4 - DOI - PMC - PubMed
    1. Bales KL, Gross AK. Aberrant protein trafficking in retinal degenerations: The initial phase of retinal remodeling. Exp Eye Res. 2015;150:71–80. 10.1016/j.exer.2015.11.007 - DOI - PMC - PubMed
    1. Bhogaraju S, Cajanek L, Fort C, Blisnick T, Weber K, Taschner M, et al. Molecular basis of tubulin transport within the cilium by IFT74 and IFT81. Science. 2013;341(6149):1009–12. 10.1126/science.1240985 - DOI - PMC - PubMed
    1. Mourao A, Christensen ST, Lorentzen E. The intraflagellar transport machinery in ciliary signaling. Curr Opin Struct Biol. 2016;41:98–108. 10.1016/j.sbi.2016.06.009 - DOI - PubMed

Publication types

MeSH terms

Substances