

Comparison of different cell type correction methods for genome-scale epigenetics studies
- PMID: 28410574
- PMCID: PMC5391562
- DOI: 10.1186/s12859-017-1611-2
Comparison of different cell type correction methods for genome-scale epigenetics studies
Abstract
Background: Whole blood is frequently utilized in genome-wide association studies of DNA methylation patterns in relation to environmental exposures or clinical outcomes. These associations can be confounded by cellular heterogeneity. Algorithms have been developed to measure or adjust for this heterogeneity, and some have been compared in the literature. However, with new methods available, it is unknown whether the findings will be consistent, if not which method(s) perform better.
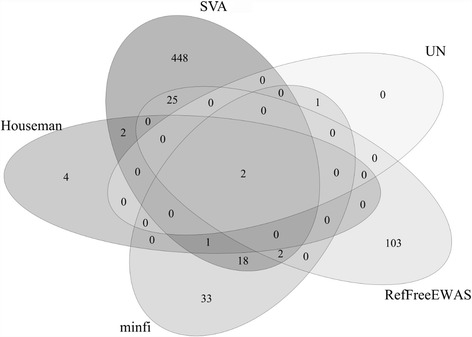
Results: Methods: We compared eight cell-type correction methods including the method in the minfi R package, the method by Houseman et al., the Removing unwanted variation (RUV) approach, the methods in FaST-LMM-EWASher, ReFACTor, RefFreeEWAS, and RefFreeCellMix R programs, along with one approach utilizing surrogate variables (SVAs). We first evaluated the association of DNA methylation at each CpG across the whole genome with prenatal arsenic exposure levels and with cancer status, adjusted for estimated cell-type information obtained from different methods. We then compared CpGs showing statistical significance from different approaches. For the methods implemented in minfi and proposed by Houseman et al., we utilized homogeneous data with composition of some blood cells available and compared them with the estimated cell compositions. Finally, for methods not explicitly estimating cell compositions, we evaluated their performance using simulated DNA methylation data with a set of latent variables representing "cell types".
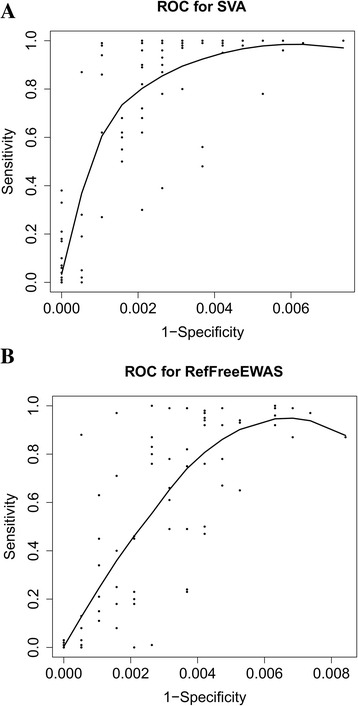
Results: Results from the SVA-based method overall showed the highest agreement with all other methods except for FaST-LMM-EWASher. Using homogeneous data, minfi provided better estimations on cell types compared to the originally proposed method by Houseman et al. Further simulation studies on methods free of reference data revealed that SVA provided good sensitivities and specificities, RefFreeCellMix in general produced high sensitivities but specificities tended to be low when confounding is present, and FaST-LMM-EWASher gave the lowest sensitivity but highest specificity.
Conclusions: Results from real data and simulations indicated that SVA is recommended when the focus is on the identification of informative CpGs. When appropriate reference data are available, the method implemented in the minfi package is recommended. However, if no such reference data are available or if the focus is not on estimating cell proportions, the SVA method is suggested.
Keywords: Cell-type composition; CpG sites; Genome-scale DNA methylation; Surrogate variables.
Figures
Similar articles
-
A comparative analysis of cell-type adjustment methods for epigenome-wide association studies based on simulated and real data sets.Brief Bioinform. 2019 Nov 27;20(6):2055-2065. doi: 10.1093/bib/bby068. Brief Bioinform. 2019. PMID: 30099476 Free PMC article. Review.
-
An Efficient Approach to Screening Epigenome-Wide Data.Biomed Res Int. 2016;2016:2615348. doi: 10.1155/2016/2615348. Epub 2016 Mar 13. Biomed Res Int. 2016. PMID: 27034928 Free PMC article.
-
Epigenome-Wide Assessment of DNA Methylation in the Placenta and Arsenic Exposure in the New Hampshire Birth Cohort Study (USA).Environ Health Perspect. 2016 Aug;124(8):1253-60. doi: 10.1289/ehp.1510437. Epub 2016 Jan 15. Environ Health Perspect. 2016. PMID: 26771251 Free PMC article.
-
Correcting for Sample Heterogeneity in Methylome-Wide Association Studies.Methods Mol Biol. 2017;1589:107-114. doi: 10.1007/7651_2015_266. Methods Mol Biol. 2017. PMID: 26246354
-
Tools and Strategies for Analysis of Genome-Wide and Gene-Specific DNA Methylation Patterns.Methods Mol Biol. 2017;1537:249-277. doi: 10.1007/978-1-4939-6685-1_15. Methods Mol Biol. 2017. PMID: 27924599 Review.
Cited by
-
Consistency and Variability of DNA Methylation in Women During Puberty, Young Adulthood, and Pregnancy.Genet Epigenet. 2017 Jul 28;9:1179237X17721540. doi: 10.1177/1179237X17721540. eCollection 2017. Genet Epigenet. 2017. PMID: 28811741 Free PMC article.
-
Cutaneous and acral melanoma cross-OMICs reveals prognostic cancer drivers associated with pathobiology and ultraviolet exposure.Nat Commun. 2022 Jul 15;13(1):4115. doi: 10.1038/s41467-022-31488-w. Nat Commun. 2022. PMID: 35840550 Free PMC article.
-
Best practices in DNA methylation: lessons from inflammatory bowel disease, psoriasis and ankylosing spondylitis.Arthritis Res Ther. 2019 Jun 3;21(1):133. doi: 10.1186/s13075-019-1922-y. Arthritis Res Ther. 2019. PMID: 31159831 Free PMC article. Review.
-
Epigenetic Changes Associated with Early Life Experiences: Saliva, A Biospecimen for DNA Methylation Signatures.Curr Genomics. 2018 Dec;19(8):676-698. doi: 10.2174/1389202919666180307150508. Curr Genomics. 2018. PMID: 30532647 Free PMC article.
-
Genome-Wide DNA Methylation Patterns in Persistent Attention-Deficit/Hyperactivity Disorder and in Association With Impulsive and Callous Traits.Front Genet. 2020 Jan 31;11:16. doi: 10.3389/fgene.2020.00016. eCollection 2020. Front Genet. 2020. PMID: 32082368 Free PMC article.
References
Publication types
MeSH terms
Substances
Grants and funding
LinkOut - more resources
Full Text Sources
Other Literature Sources
