. 2017 Apr 11;8(4):1086-1100.
doi: 10.1016/j.stemcr.2017.03.012.

iPSCORE: A Resource of 222 iPSC Lines Enabling Functional Characterization of Genetic Variation across a Variety of Cell Types

Affiliations

iPSCORE: A Resource of 222 iPSC Lines Enabling Functional Characterization of Genetic Variation across a Variety of Cell Types

Athanasia D Panopoulos et al. Stem Cell Reports. .

Abstract

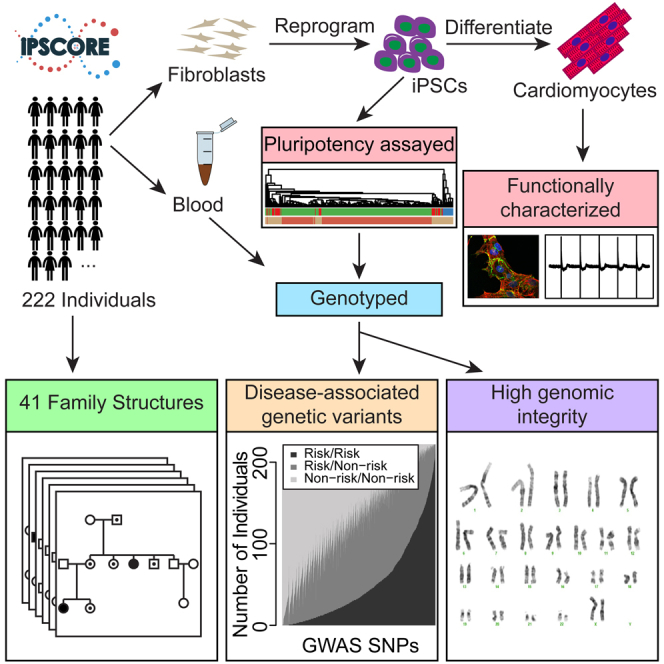
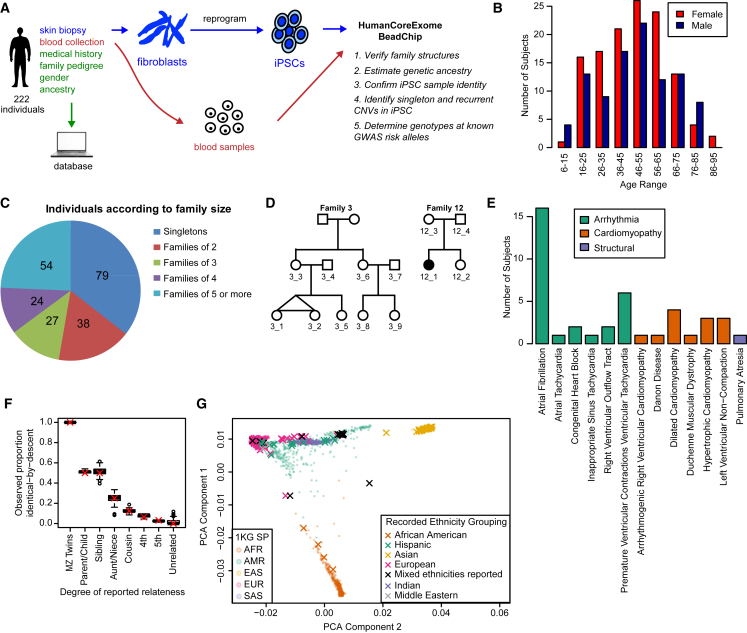
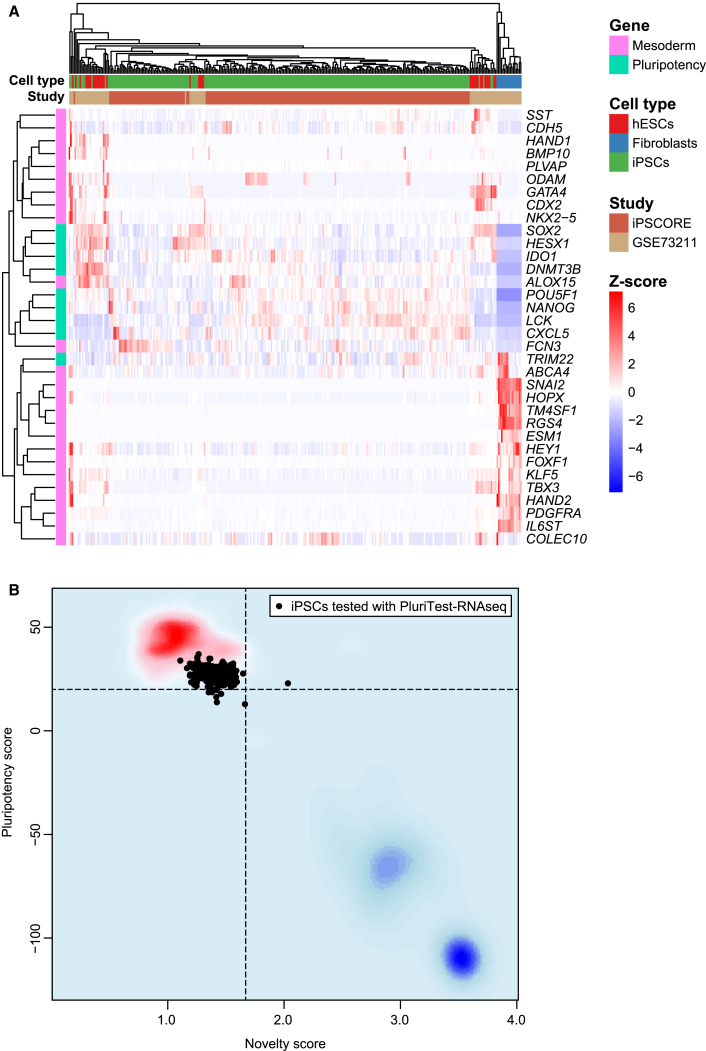
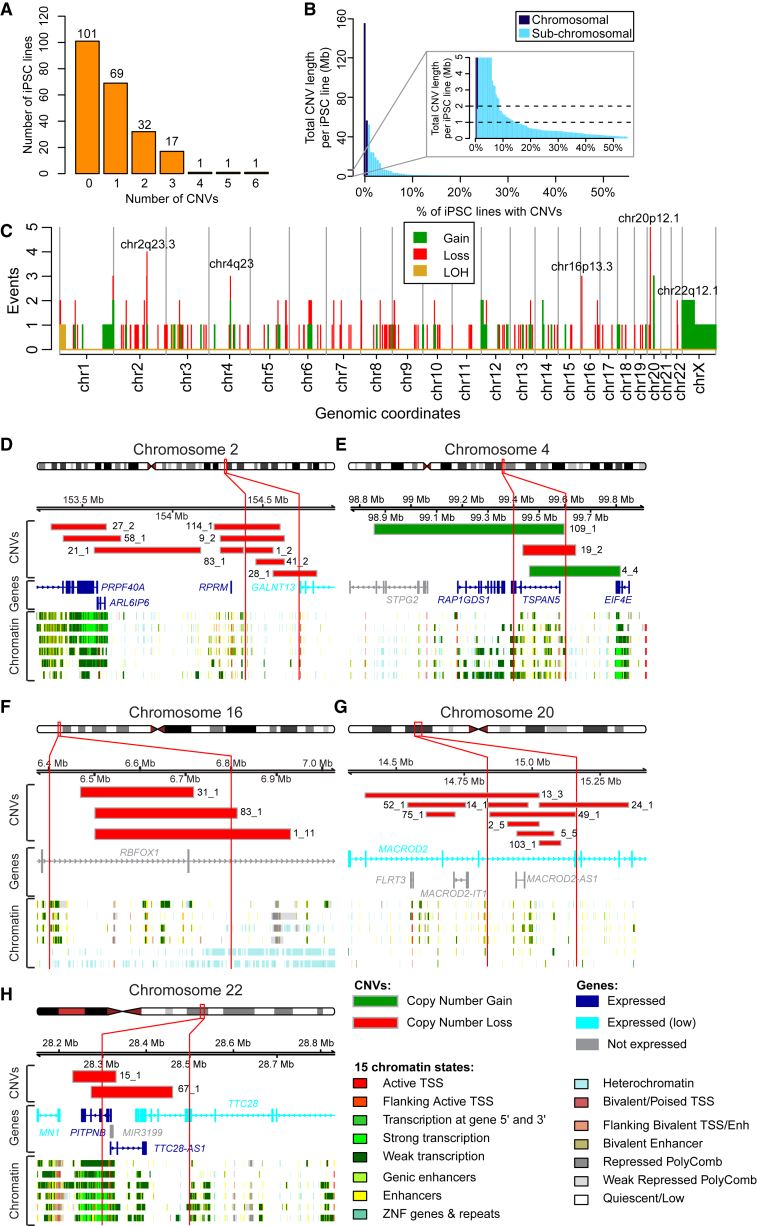
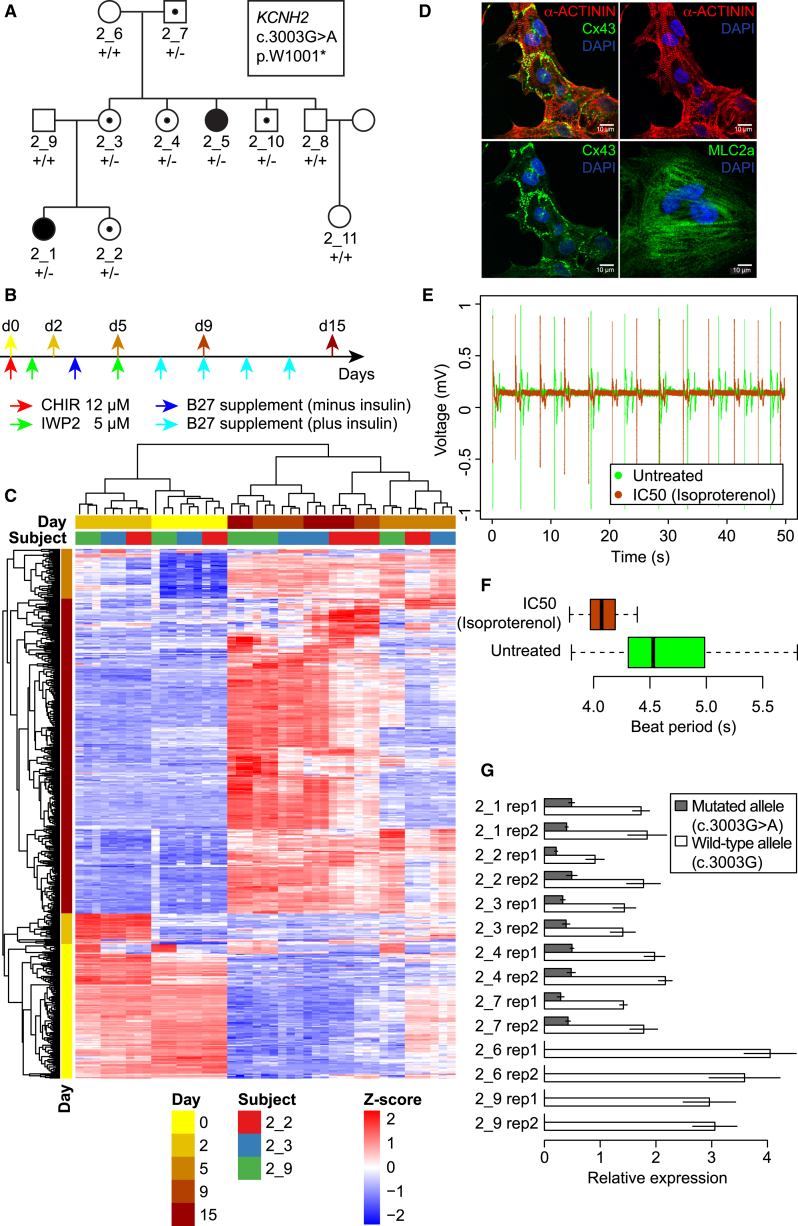
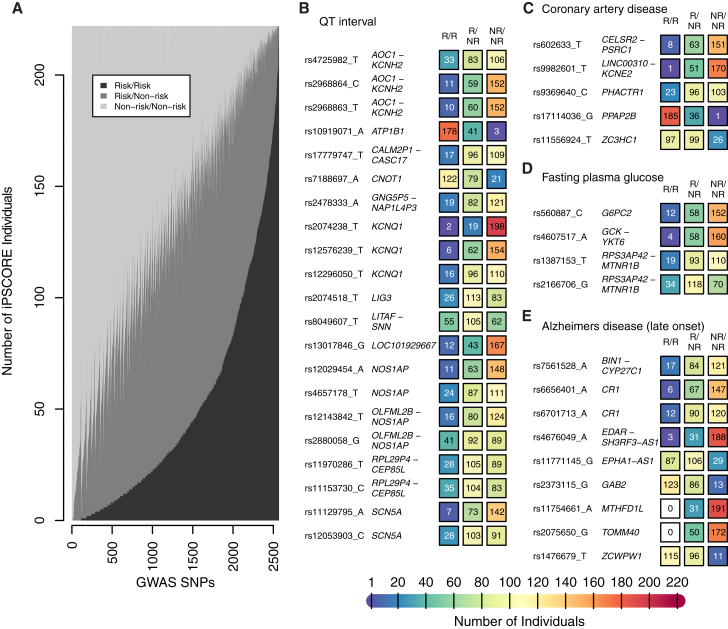
Large-scale collections of induced pluripotent stem cells (iPSCs) could serve as powerful model systems for examining how genetic variation affects biology and disease. Here we describe the iPSCORE resource: a collection of systematically derived and characterized iPSC lines from 222 ethnically diverse individuals that allows for both familial and association-based genetic studies. iPSCORE lines are pluripotent with high genomic integrity (no or low numbers of somatic copy-number variants) as determined using high-throughput RNA-sequencing and genotyping arrays, respectively. Using iPSCs from a family of individuals, we show that iPSC-derived cardiomyocytes demonstrate gene expression patterns that cluster by genetic background, and can be used to examine variants associated with physiological and disease phenotypes. The iPSCORE collection contains representative individuals for risk and non-risk alleles for 95% of SNPs associated with human phenotypes through genome-wide association studies. Our study demonstrates the utility of iPSCORE for examining how genetic variants influence molecular and physiological traits in iPSCs and derived cell lines.

Keywords: GWAS; KCNH2; LQT2; NHLBI Next Gen; cardiac disease; iPSC; iPSC-derived cardiomyocytes; iPSCORE; molecular traits; physiological traits.


Figures

None
Graphical abstract
Figure 1
Figure 1
Description of the iPSCORE Cohort (A) Pipeline for the systematic generation and characterization of 222 iPSC lines. Individuals filled out a questionnaire detailing their medical history, family relationships to other subjects in the cohort, gender, and ancestry. Fibroblasts from skin biopsy were reprogrammed to integration-free iPSC using Sendai virus and frozen at passage 12. Genomic DNA isolated from the iPSC and the subject-matched blood samples were hybridized to the HumanCoreExome array. The resulting data were then used to confirm reported family structure, reported ancestry, and iPSC sample identity (match with blood sample), and to perform CNV analysis (iPSC characterization) and determine status of known disease risk alleles. (B) Age distributions of males and females. (C) Pie chart showing how many individuals are singletons or in a family size of 2, 3, 4, and 5 or more. (D) Pedigrees of two representative families; numbered individuals indicate presence in the study. Family 3 is a two-generation family with identical twins (nine subjects), and Family 12 has a member diagnosed with ventricular tachycardia and congenital heart block (four subjects). (E) Number of individuals with cardiac disease, grouped by disease type. Some individuals are affected by multiple types of arrhythmia. (F) Boxplot showing the observed proportion of the genome identical by descent (pIBD) as a function of the reported family relationship. The box hinges indicate the 25th and 75th quantiles and the whiskers extend to 1.5 times the interquartile range. A red “X” indicates the expected mean pIBD given the number of generations that separate the individuals. (G) An x-y plot showing the first versus second components of a principal component analysis using genotype data from a subset of SNPs present on the array mapped onto a principal component analysis from the 1,000 Genomes Project (1KG) super populations (SP) (small faded circles). Individuals from the iPSCORE cohort are mapped onto these components with their recorded ethnicity grouping shown by a colored X.
Figure 2
Figure 2
Analysis of iPSC Transcriptome Data to Assess Pluripotency (A) Heatmap and hierarchical clustering showing normalized expression levels (Z scores derived from VST expression levels) of nine pluripotency (green) (Burridge et al., 2012, Dubois et al., 2011, Vidarsson et al., 2010) and 25 mesoderm marker genes (pink) (Tsankov et al., 2015) in 213 iPSCORE iPSC lines and 73 cell lines (21 iPSC, 35 hESC, and 17 fibroblast) obtained from GEO: GSE73211 (Choi et al., 2015). Samples are color coded to show whether they are derived from iPSCORE (dark brown) or from GEO: GSE73211 (light brown), and on the basis of tissue type (red for hESC, green for iPSC, and blue for fibroblast). The heatmap shows that iPSCs and hESCs have higher overall expression of pluripotency genes than fibroblasts, which have low expression of pluripotency genes, but higher expression of most mesoderm markers than iPSC lines and hESC lines. (B) PluriTest-RNAseq-based analysis of 213 iPSCORE lines (green) with RNA-seq data. The red and blue background encodes an empirical density map indicating the location of pluripotent (red) and non-pluripotent (blue) cells in the reference dataset. The x axis represents novelty score, which indicates how much the test iPSC deviates from a normal pluripotent line, with higher values being associated with more somatic characteristics and therefore lower pluripotency. The y axis represents the pluripotency score, a logistic regression model that enables a probability-based choice between pluripotent and non-pluripotent classes (Muller et al., 2011).
Figure 3
Figure 3
Characteristics of the Copy-Number Variants in the 222 iPSC Cell Lines (A) Histogram showing the number of iPSC cell lines with (N) detected CNV aberrations (x axis); for example, 101 of the iPSC lines have zero aberrations detected. (B) Histogram showing the cumulative size of CNVs (in megabase pairs) per iPSC cell line as a percentage of the cohort (Total = 222). (C) Histogram showing the number of alterations in each genomic locus. The five intervals harboring a significant cluster of CNVs are indicated. Gray lines separate chromosomes. (D–H) Genomic intervals harboring significantly clustered CNVs. The relative chromosomal position of each CNV cluster is shown. Red vertical lines delineate the regions significantly enriched, but additional nearby CNVs are also shown. In each panel, expressed and non-expressed genes are color coded. RNA-seq data of the 213 iPSC lines were used to determine gene expression levels: genes were defined as not expressed (gray) if fewer than 10 iPSC had an expression level of transcripts per million (TPM) >2; genes with a mean TPM <4 were considered as having low expression (light blue); while genes with a mean TPM >= 4 were considered as expressed (dark blue). The rows underneath the genes show 15 chromatin states in one ESC line (ESC.4STAR; top row) and five iPSC lines derived from Roadmap ChromHMM (http://egg2.wustl.edu/roadmap/ [Ernst and Kellis, 2012, Roadmap Epigenomics et al., 2015]). (D) Nine samples (sample ID indicated) harbor deletions (red rectangles) at chr2q23.3, of which five fall in the significantly enriched region. (E) Two samples harbor gains and one harbors a loss at chr4q23. (F) Three samples harbor deletions at chr16p13.3. (G) Nine samples harbor deletions at chr20p12.1, of which seven fall in the associated region. (H) Two samples harbor deletions at chr 22q12.1.
Figure 4
Figure 4
Differentiation of iPSC Lines into Cardiomyocytes and Functional Characterization (A) Pedigree of the iPSCORE family 2 showing segregation of KCNH2 mutation (p.W1001) underlying dominant long-QT syndrome with incomplete penetrance. Individuals with filled in circles display long-QT syndrome, while individuals with black dots are carriers of the mutation. (B) Protocol used for cardiomyocyte differentiation (Lian et al., 2013). Arrows at the bottom indicate the reagents that were sequentially added to cell culture. Arrows at the top indicate the time points at which cells were collected for whole transcriptome analysis, corresponding to the differentiation stages of pluripotency (day 0 [d0]), mesodermal progenitors (d2), cardiovascular progenitors (d5), committed cardiovascular cells (d9), and cardiomyocytes (d15) (Paige et al., 2012). (C) Heatmap and hierarchical clustering of expression of the 500 genes with highest variance in expression levels among the 45 time-course samples. Samples (columns) are color coded based on the time point at which they were collected (days 0, 2, 5, 9, and 15) and on the subject from whom they were derived (2_2, 2_3, and 2_9). Genes (rows) are color coded by the four groups (hierarchical clustering), according to the differentiation stage where they were first expressed or most highly expressed (Table S4). Gene expression values are reported Z scores of variance stabilized transformed read counts. (D–F) Analysis of iPSC-derived cardiomyocytes from individual 2_3. (D) Confocal images of iPSC-CMs from sample 2_3 immunostained with sarcomeric α-actinin (ACTN1) (red), Cx43 (green), or MLC2-a (green) at day 34 post differentiation. Cx43 puncta are observed on hiPSC-CM cell membranes especially at cardiomyocyte cell-cell junctions. DAPI was used to counterstain nuclei. MEA analysis: (E) field potential measured from one electrode of one well before and after treatment of iPSC-CMs from sample 2_3 with isoproterenol (IC50 0.01 μM), and (F) boxplot of beat period calculated from the same data. (G) Real-time qPCR specifically quantifying the transcripts of KCNH2 with the two genotypes (mutated or wild-type), relative to GAPDH expression (ΔCt) in the iPSC-CMs from seven family members. Expression values are normalized relative to the average of ΔCt. Error bars represent SDs.
Figure 5
Figure 5
Distributions of GWAS SNP Genotypes in the iPSCORE Resource (A) Stacked barplot showing the number of individuals in the iPSCORE resource that have particular genotypes at 2,571 SNPs that have been previously associated with one or more phenotypes through GWAS. (B–E) Counts of individuals that carry the risk/risk (R/R), risk/non-risk (R/NR), and non-risk/non-risk (NR/NR) genotypes for SNPs implicated in the indicated disease. The color of the box indicates the number of individuals on a color scale shown at the bottom. (B) QT interval; (C) coronary artery disease; (D) fasting plasma glucose levels; and (E) Alzheimer's disease (late onset). See also Table S5.

References

    1. Abyzov A., Mariani J., Palejev D., Zhang Y., Haney M.S., Tomasini L., Ferrandino A.F., Rosenberg Belmaker L.A., Szekely A., Wilson M. Somatic copy number mosaicism in human skin revealed by induced pluripotent stem cells. Nature. 2012;492:438–442. - PMC - PubMed
    1. Avior Y., Sagi I., Benvenisty N. Pluripotent stem cells in disease modelling and drug discovery. Nat. Rev. Mol. Cell Biol. 2016;17:170–182. - PubMed
    1. Burridge P.W., Keller G., Gold J.D., Wu J.C. Production of de novo cardiomyocytes: human pluripotent stem cell differentiation and direct reprogramming. Cell Stem Cell. 2012;10:16–28. - PMC - PubMed
    1. Burridge P.W., Matsa E., Shukla P., Lin Z.C., Churko J.M., Ebert A.D., Lan F., Diecke S., Huber B., Mordwinkin N.M. Chemically defined generation of human cardiomyocytes. Nat. Methods. 2014;11:855–860. - PMC - PubMed
    1. Burrows C.K., Banovich N.E., Pavlovic B.J., Patterson K., Gallego Romero I., Pritchard J.K., Gilad Y. Genetic variation, not cell type of origin, underlies the majority of identifiable regulatory differences in iPSCs. PLoS Genet. 2016;12:e1005793. - PMC - PubMed

MeSH terms