

Batf3-dependent CD8α+ Dendritic Cells Aggravates Atherosclerosis via Th1 Cell Induction and Enhanced CCL5 Expression in Plaque Macrophages
- PMID: 28411140
- PMCID: PMC5405198
- DOI: 10.1016/j.ebiom.2017.04.008
Batf3-dependent CD8α+ Dendritic Cells Aggravates Atherosclerosis via Th1 Cell Induction and Enhanced CCL5 Expression in Plaque Macrophages
Abstract
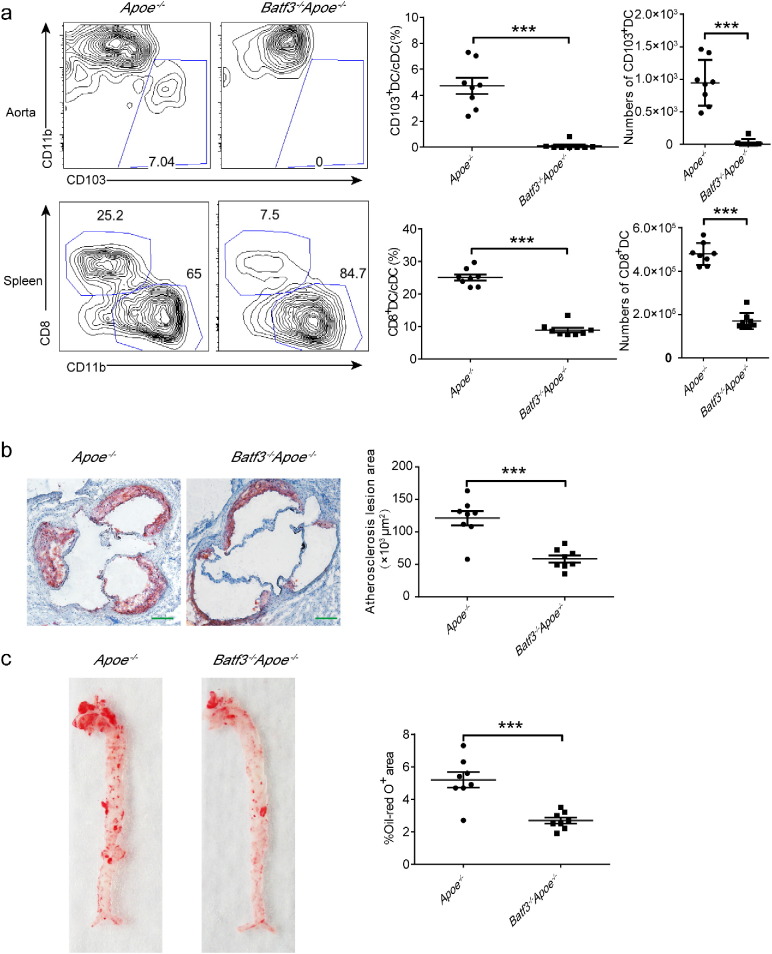
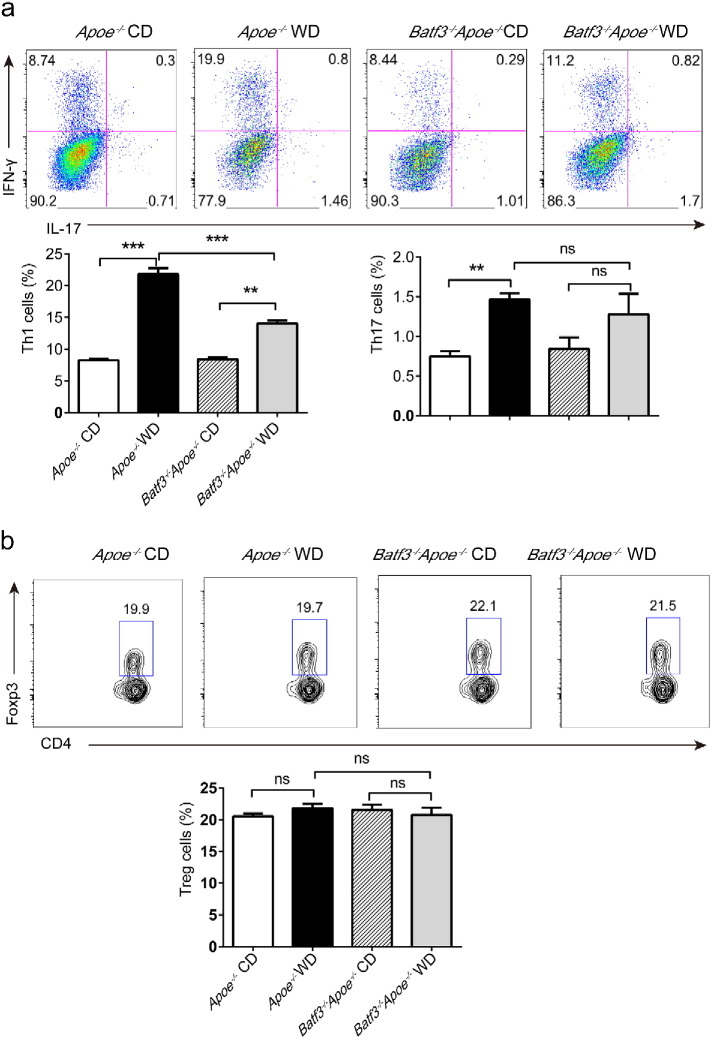
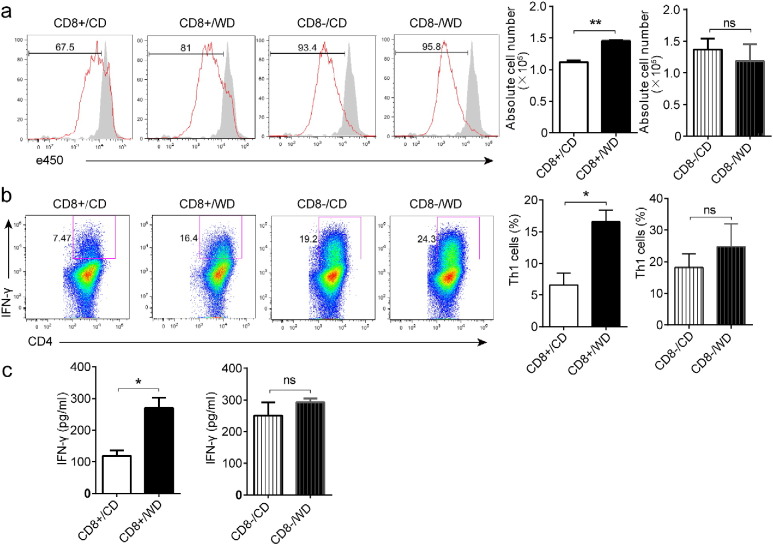
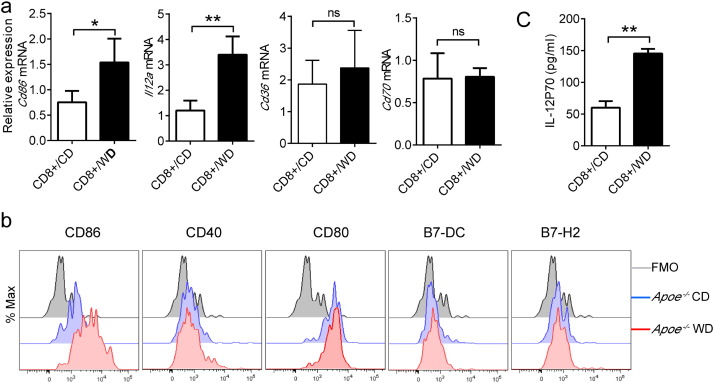
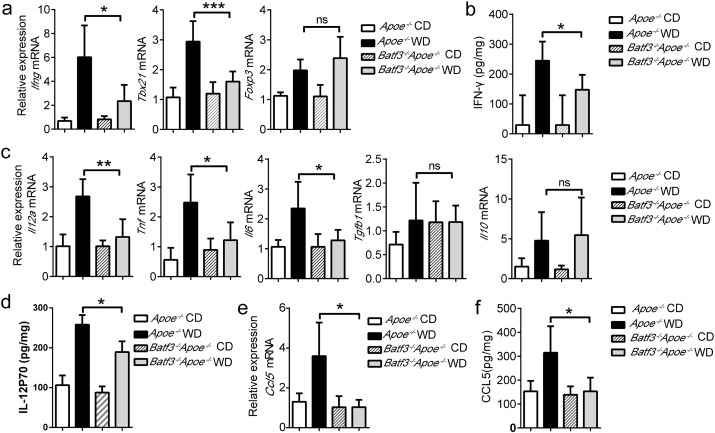
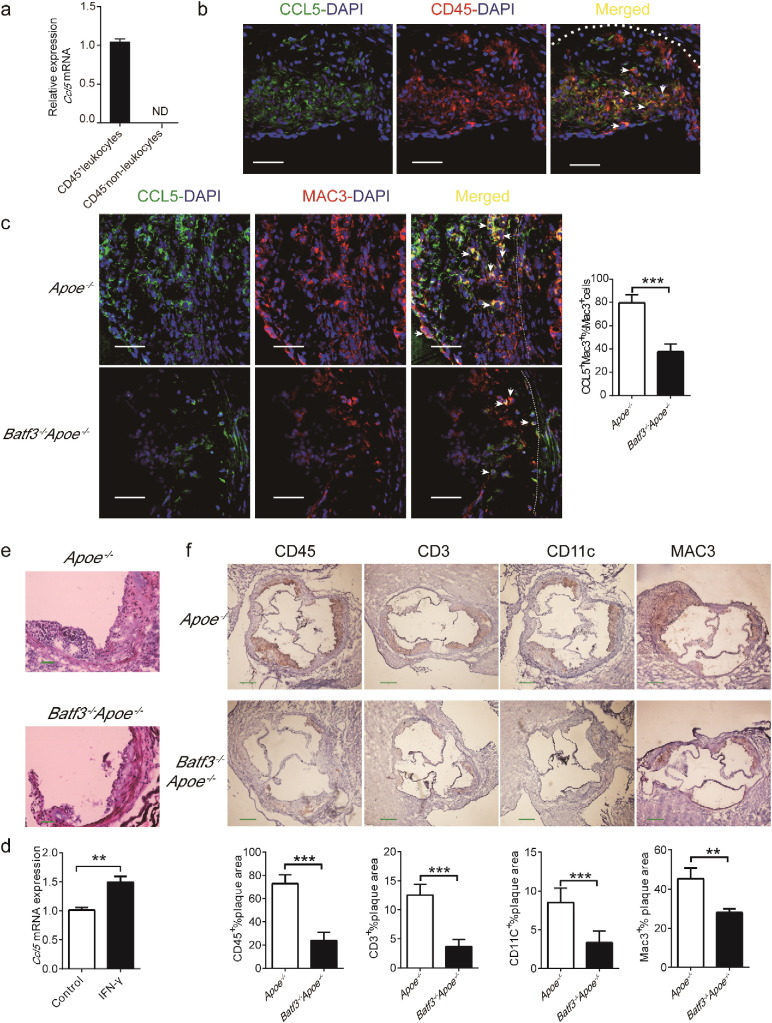
Dendritic cells (DCs) play an important role in controlling T cell-mediated adaptive immunity in atherogenesis. However, the role of the basic leucine zipper transcription factor, ATF-like 3 (Batf3)-dependent CD8α+ DC subset in atherogenesis remains unclear. Here we show that Batf3-/-Apoe-/- mice, lacking CD8α+ DCs, exhibited a significant reduction in atherogenesis and T help 1 (Th1) cells compared with Apoe-/- controls. Then, we found that CD8α+ DCs preferentially induce Th1 cells via secreting interleukin-12 (IL-12), and that the expression of interferon-gamma (IFN-γ)or chemokine (C-C motif) ligand 5 (CCL5) in aorta were significantly decreased in Batf3-/-Apoe-/- mice. We further demonstrated that macrophages were the major CCL5-expressing cells in the plaque, which was significantly reduced in Batf3-/-Apoe-/- mice. Furthermore, we found CCL5 expression in macrophages was promoted by IFN-γ. Finally, we showed that Batf3-/-Apoe-/- mice displayed decreased infiltration of leukocytes in the plaque. Thus, CD8α+ DCs aggravated atherosclerosis, likely by inducing Th1 cell response, which promoted CCL5 expression in macrophages and increased infiltration of leukocytes and lesion inflammation.
Keywords: Atherosclerosis; Batf3; CCL5; CD8α(+) DCs; Th1 cells.
Copyright © 2017 The Authors. Published by Elsevier B.V. All rights reserved.
Figures
Similar articles
-
Batf3-dependent CD103+ dendritic cells are major producers of IL-12 that drive local Th1 immunity against Leishmania major infection in mice.Eur J Immunol. 2015 Jan;45(1):119-29. doi: 10.1002/eji.201444651. Epub 2014 Nov 28. Eur J Immunol. 2015. PMID: 25312824 Free PMC article.
-
Peripheral CD103+ dendritic cells form a unified subset developmentally related to CD8alpha+ conventional dendritic cells.J Exp Med. 2010 Apr 12;207(4):823-36. doi: 10.1084/jem.20091627. Epub 2010 Mar 29. J Exp Med. 2010. PMID: 20351058 Free PMC article.
-
CD8α+ DCs can be induced in the absence of transcription factors Id2, Nfil3, and Batf3.Blood. 2013 Feb 28;121(9):1574-83. doi: 10.1182/blood-2012-07-445650. Epub 2013 Jan 7. Blood. 2013. PMID: 23297132
-
Concise review: The heterogenous roles of BATF3 in cancer oncogenesis and dendritic cells and T cells differentiation and function considering the importance of BATF3-dependent dendritic cells.Immunogenetics. 2024 Apr;76(2):75-91. doi: 10.1007/s00251-024-01335-x. Epub 2024 Feb 15. Immunogenetics. 2024. PMID: 38358555 Review.
-
The bloodline of CD8α(+) dendritic cells.Mol Cells. 2012 Sep;34(3):219-29. doi: 10.1007/s10059-012-0058-6. Epub 2012 Jul 4. Mol Cells. 2012. PMID: 22767247 Free PMC article. Review.
Cited by
-
Role of chemokine systems in cancer and inflammatory diseases.MedComm (2020). 2022 Jun 8;3(2):e147. doi: 10.1002/mco2.147. eCollection 2022 Jun. MedComm (2020). 2022. PMID: 35702353 Free PMC article. Review.
-
Crosstalk between dendritic cells and T lymphocytes during atherogenesis: Focus on antigen presentation and break of tolerance.Front Cardiovasc Med. 2022 Jul 28;9:934314. doi: 10.3389/fcvm.2022.934314. eCollection 2022. Front Cardiovasc Med. 2022. PMID: 35966516 Free PMC article. Review.
-
MicroRNA expression profile of chicken cecum in different stages during Histomonas meleagridis infection.BMC Vet Res. 2022 Jun 11;18(1):222. doi: 10.1186/s12917-022-03316-2. BMC Vet Res. 2022. PMID: 35690747 Free PMC article.
-
CD8 + T-cell deficiency protects mice from abdominal aortic aneurysm formation in response to calcium chloride 2.J Hypertens. 2024 Nov 1;42(11):1966-1975. doi: 10.1097/HJH.0000000000003823. Epub 2024 Aug 13. J Hypertens. 2024. PMID: 39146540 Free PMC article.
-
FUS regulates the alternative splicing of cell proliferation genes related to atherosclerosis.Exp Biol Med (Maywood). 2023 Sep;248(17):1459-1468. doi: 10.1177/15353702231187642. Epub 2023 Sep 9. Exp Biol Med (Maywood). 2023. PMID: 37688506 Free PMC article.
References
-
- Ashok D., Schuster S., Ronet C., Rosa M., Mack V., Lavanchy C., Marraco S.F., Fasel N., Murphy K.M., Tacchini-Cottier F. Cross-presenting dendritic cells are required for control of Leishmania major infection. Eur. J. Immunol. 2014;44:1422–1432. - PubMed
-
- Braunersreuther V., Steffens S., Arnaud C., Pelli G., Burger F., Proudfoot A., Mach F. A novel RANTES antagonist prevents progression of established atherosclerotic lesions in mice. Arterioscler. Thromb. Vasc. Biol. 2008;28:1090–1096. - PubMed
-
- Busche A., Jirmo A.C., Welten S.P., Zischke J., Noack J., Constabel H., Gatzke A.K., Keyser K.A., Arens R., Behrens G.M. Priming of CD8 + T cells against cytomegalovirus-encoded antigens is dominated by cross-presentation. J. Immunol. 2013;190:2767–2777. - PubMed
MeSH terms
Substances
LinkOut - more resources
Full Text Sources
Other Literature Sources
Medical
Molecular Biology Databases
Miscellaneous
