Meta-Analysis
. 2017 Sep:67:18-29.
doi: 10.1016/j.humpath.2017.03.011. Epub 2017 Apr 12.

MicroRNA expression profiling of Xp11 renal cell carcinoma

Affiliations
Meta-Analysis

MicroRNA expression profiling of Xp11 renal cell carcinoma

Luigi Marchionni et al. Hum Pathol. 2017 Sep.

Abstract

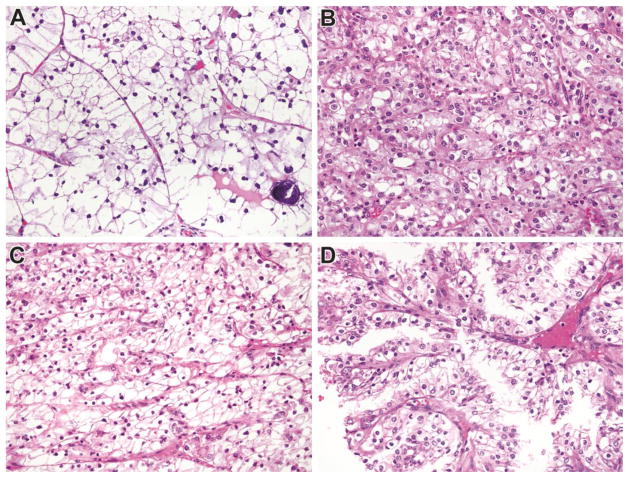
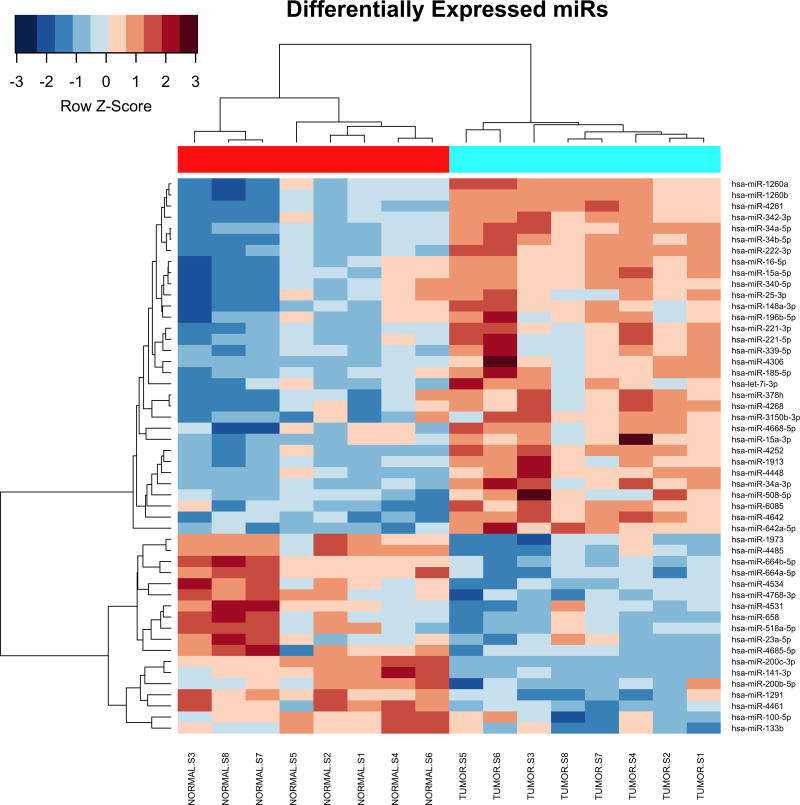
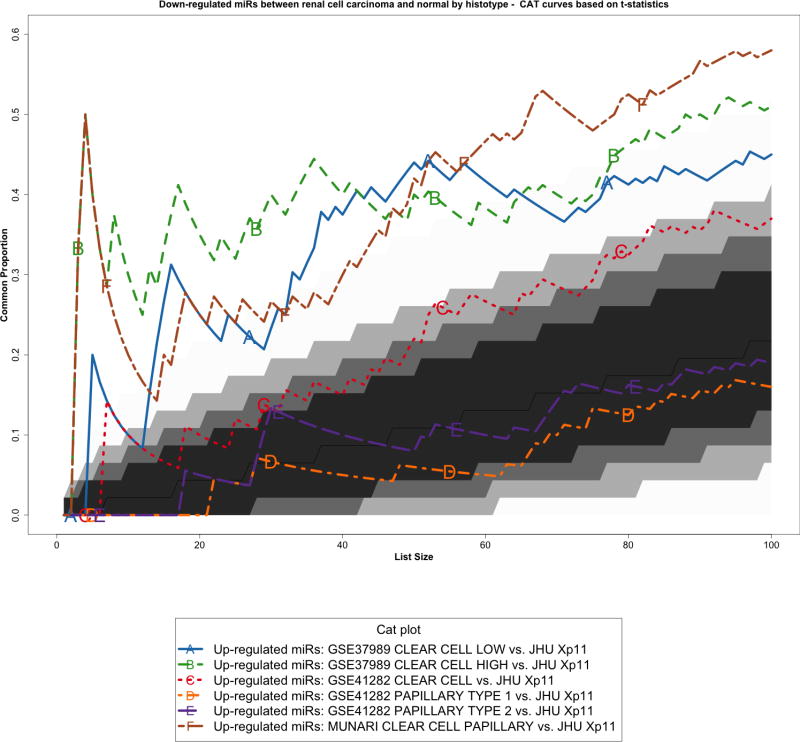
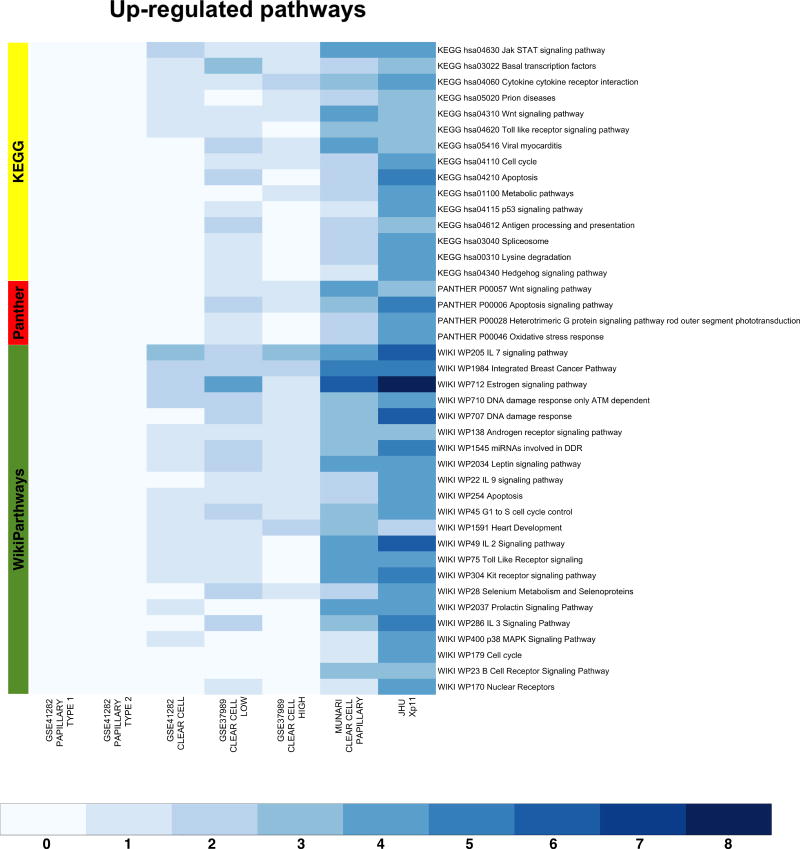
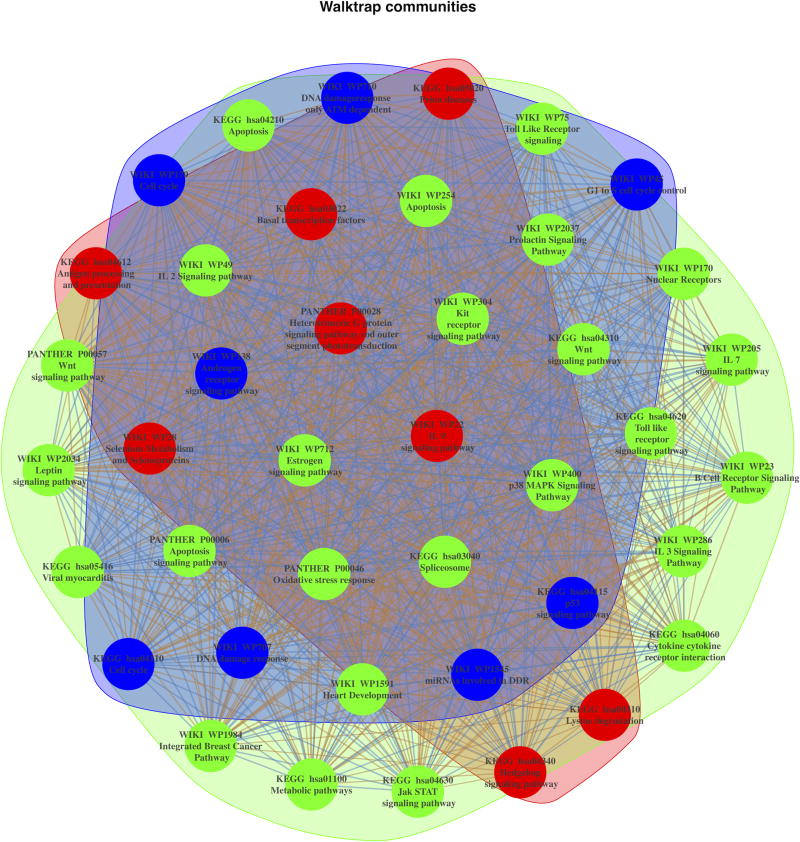
Renal cell carcinomas (RCCs) with Xp11 translocation (Xp11 RCC) constitute a distinctive molecular subtype characterized by chromosomal translocations involving the Xp11.2 locus, resulting in gene fusions between the TFE3 transcription factor with a second gene (usually ASPSCR1, PRCC, NONO, or SFPQ). RCCs with Xp11 translocations comprise up to 1% to 4% of adult cases, frequently displaying papillary architecture with epithelioid clear cells. To better understand the biology of this molecularly distinct tumor subtype, we analyze the microRNA (miRNA) expression profiles of Xp11 RCC compared with normal renal parenchyma using microarray and quantitative reverse-transcription polymerase chain reaction. We further compare Xp11 RCC with other RCC histologic subtypes using publically available data sets, identifying common and distinctive miRNA signatures along with the associated signaling pathways and biological processes. Overall, Xp11 RCC more closely resembles clear cell rather than papillary RCC. Furthermore, among the most differentially expressed miRNAs specific for Xp11 RCC, we identify miR-148a-3p, miR-221-3p, miR-185-5p, miR-196b-5p, and miR-642a-5p to be up-regulated, whereas miR-133b and miR-658 were down-regulated. Finally, Xp11 RCC is most strongly associated with miRNA expression profiles modulating DNA damage responses, cell cycle progression and apoptosis, and the Hedgehog signaling pathway. In summary, we describe here for the first time the miRNA expression profiles of a molecularly distinct type of renal cancer associated with Xp11.2 translocations involving the TFE3 gene. Our results might help understanding the molecular underpinning of Xp11 RCC, assisting in developing targeted treatments for this disease.

Keywords: Analysis of Functional Annotation; Renal cell carcinoma; TFE3 gene fusion; Xp11 translocation; gene regulation; microRNA expression profiling.


Conflict of interest statement

Conflict of interest disclosure: The authors do not have conflict of interests to declare

Figures

Figure 1
Figure 1
Morphology of Genetically Confirmed Xp11 translocation RCC in this study. Panel A: This tumor has clear cell features and psammoma bodies; Panel B: This tumor closely resembled clear cell RCC; Panel C: This primary tumor resembled clear cell RCC; and Panel D: Recurrence of the primary tumor shown in C demonstrates papillary architecture. All images are taken at 400X magnification, and all are Hematoxylin and Eosin stained.
Figure 2
Figure 2
MicroRNA expression profile Xp11 RCC. Heat-map showing the top 50 mature miRNAs most significantly differentially expressed between matched Xp11 RCC tumors and normal samples (highlighted in cyan and red respectively in the figure). Hierarchical clustering was obtained using the Pearson’s distance and the average clustering method.
Figure 3
Figure 3
Correspondence at the top (CAT) curves for all up-regulated microRNAs in common between our Xp11 dataset and three previously published datasets encompassing distinct RCC subtypes (Munari et al, GSE37989, and GSE41282). Genes were ranked based on the moderated t-statistics obtained from our linear model analysis. Each CAT curve represents the proportion of differentially expressed microRNA in common between two expression profiles comparing tumor and normal samples. All microRNA expression profiles obtained from the different RCC groups analyzed using public domain data were compared to the one obtained using Xp11 RCC samples (reference profile). CAT curves in the white area above the gray shading indicate significant agreement, while the curves below indicate significant disagreement between expression profiles. The grey shading represents the 99.9% probability intervals of agreement by chance, therefore CAT curves in the white represent agreement beyond what it would be expected by chance alone. Overall we observed good agreement between Xp11 and clear cell papillary RCC, and between Xp11 and clear cell RCC.
Figure 4
Figure 4
Heat-maps visualizing up-regulated functional gene sets (FGS) as determined by Analysis of Functional Annotation (AFA) performed on microRNAs expression profiles associated with Xp11 and other types of RCC. Each row represents a distinct FGS, while each column represents a distinct coefficient from our linear model analysis. The FGS that were most significantly up-regulated across any comparison performed are shown in the figure (FDR ≤ 0.00025%, or less). Color scales correspond to the absolute adjusted p-values obtained from our analysis after base 10 logarithmic transformations (i.e., the number on the color scale increases with decreasing FDR). Up-regulated FGS were selected from different collections to capture signaling pathways and biological themes modulated by microRNA expression in RCC. The databases used are highlighted on the left: PantherPath in red, KEGG in green, and WikiPathways in yellow. Complete tables with results from enrichment test are reported in Table 2 and Supplementary Table S2 (also available at http://luigimarchionni.org/Xp11RCC.html).
Figure 5
Figure 5
Social network analysis of FGS up-regulated in Xp11 and other RCC subtypes. The figure depicts the weighted undirected network based on the up-regulated microRNA in common among the enriched FGS from Figure 4. In the network vertexes represent specific FGS, while the edges (and their weights) are based on the number of up-regulated microRNA in common among the FGS. Three distinct FGS “communities” (i.e., subgraphs of FGS sharing common subset of microRNAs) were identified using the community search method based on random walks implemented by Pons et al [23] and are shown in the figure with distinct colors.

Comment in

Similar articles

Cited by

References

    1. Argani P. MiT family translocation renal cell carcinoma. Semin Diagn Pathol. 2015;32:103–13. doi: 10.1053/j.semdp.2015.02.003. - DOI - PubMed
    1. Argani P, Zhong M, Reuter VE, Fallon JT, Epstein JI, Netto GJ, et al. TFE3-Fusion Variant Analysis Defines Specific Clinicopathologic Associations Among Xp11 Translocation Cancers. Am J Surg Pathol. 2016;40:723–37. doi: 10.1097/PAS.0000000000000631. - DOI - PMC - PubMed
    1. Argani P, Antonescu CR, Couturier J, Fournet J-C, Sciot R, Debiec-Rychter M, et al. PRCC-TFE3 renal carcinomas: morphologic, immunohistochemical, ultrastructural, and molecular analysis of an entity associated with the t(X;1)(p11. 2;q21) Am J Surg Pathol. 2002;26:1553–66. - PubMed
    1. Green WM, Yonescu R, Morsberger L, Morris K, Netto GJ, Epstein JI, et al. Utilization of a TFE3 break-apart FISH assay in a renal tumor consultation service. Am J Surg Pathol. 2013;37:1150–63. doi: 10.1097/PAS.0b013e31828a69ae. - DOI - PubMed
    1. Sukov WR, Hodge JC, Lohse CM, Leibovich BC, Thompson RH, Pearce KE, et al. TFE3 rearrangements in adult renal cell carcinoma: clinical and pathologic features with outcome in a large series of consecutively treated patients. Am J Surg Pathol. 2012;36:663–70. doi: 10.1097/PAS.0b013e31824dd972. - DOI - PubMed

Publication types

MeSH terms