. 2018 Jan 1:368:199-213.
doi: 10.1016/j.neuroscience.2017.04.004. Epub 2017 Apr 12.

Optogenetic stimulation of cortex to map evoked whisker movements in awake head-restrained mice

Affiliations

Optogenetic stimulation of cortex to map evoked whisker movements in awake head-restrained mice

Matthieu Auffret et al. Neuroscience. .

Abstract

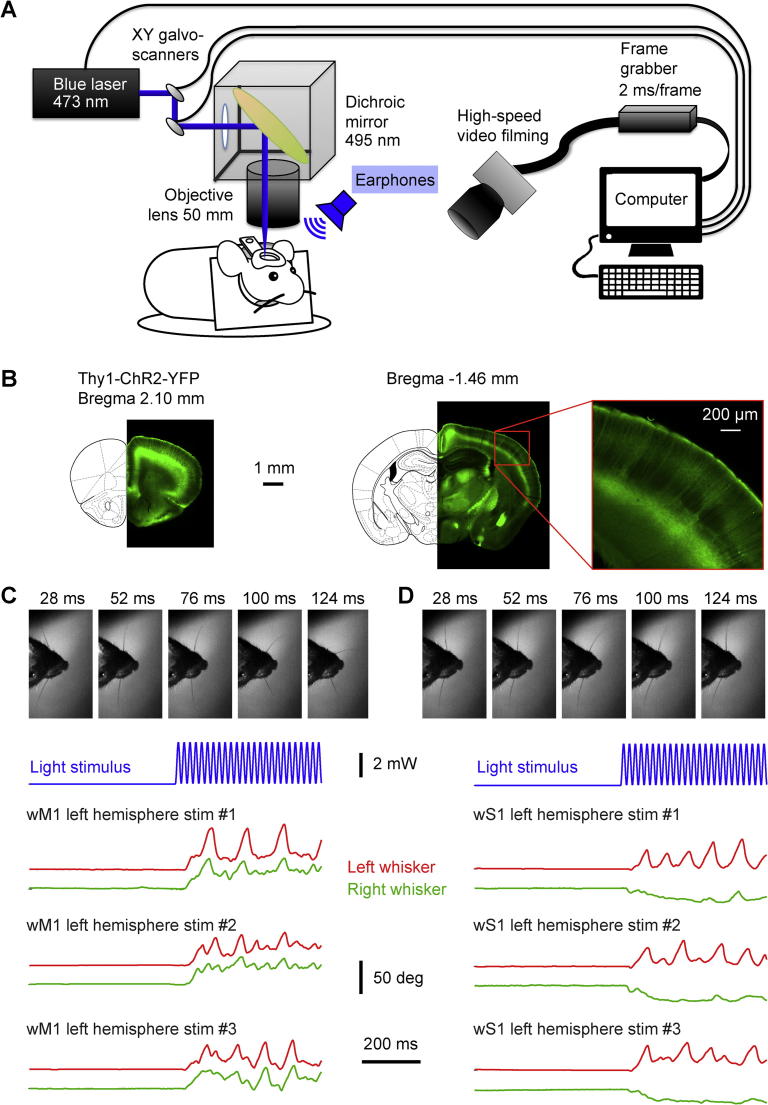
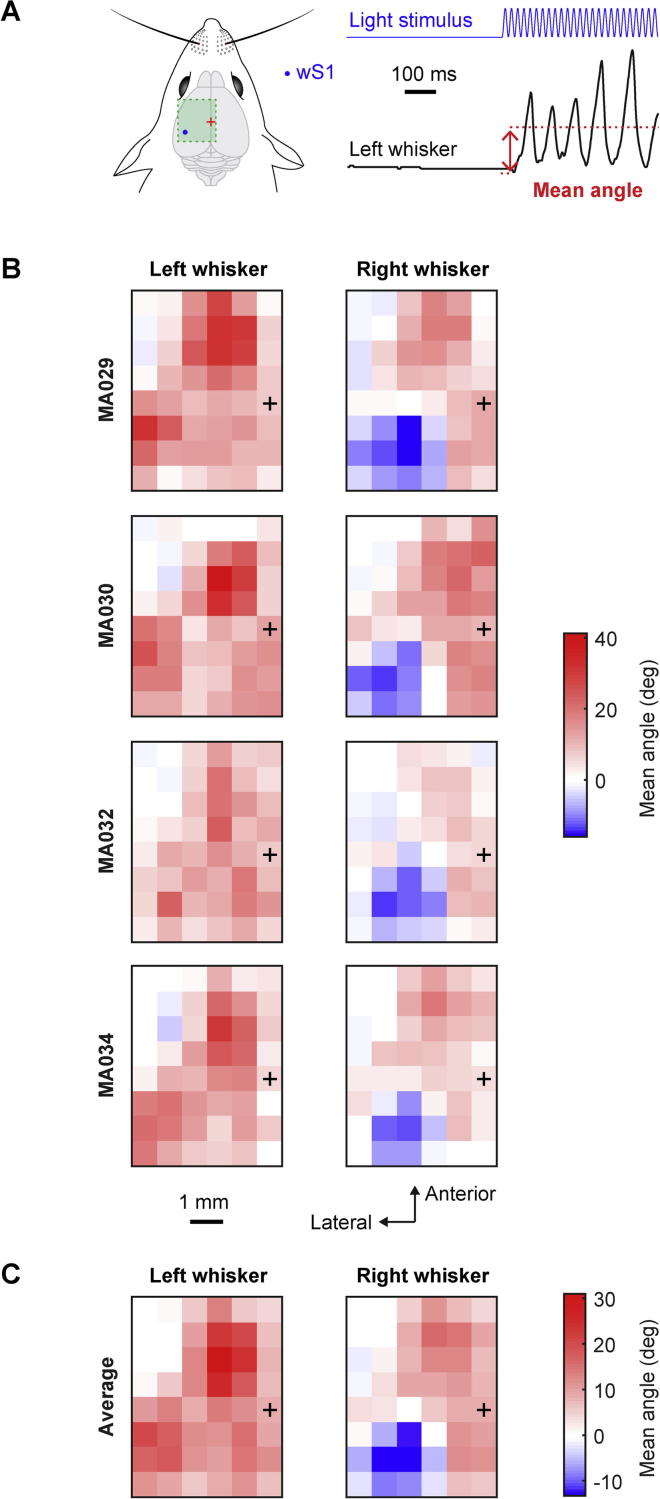
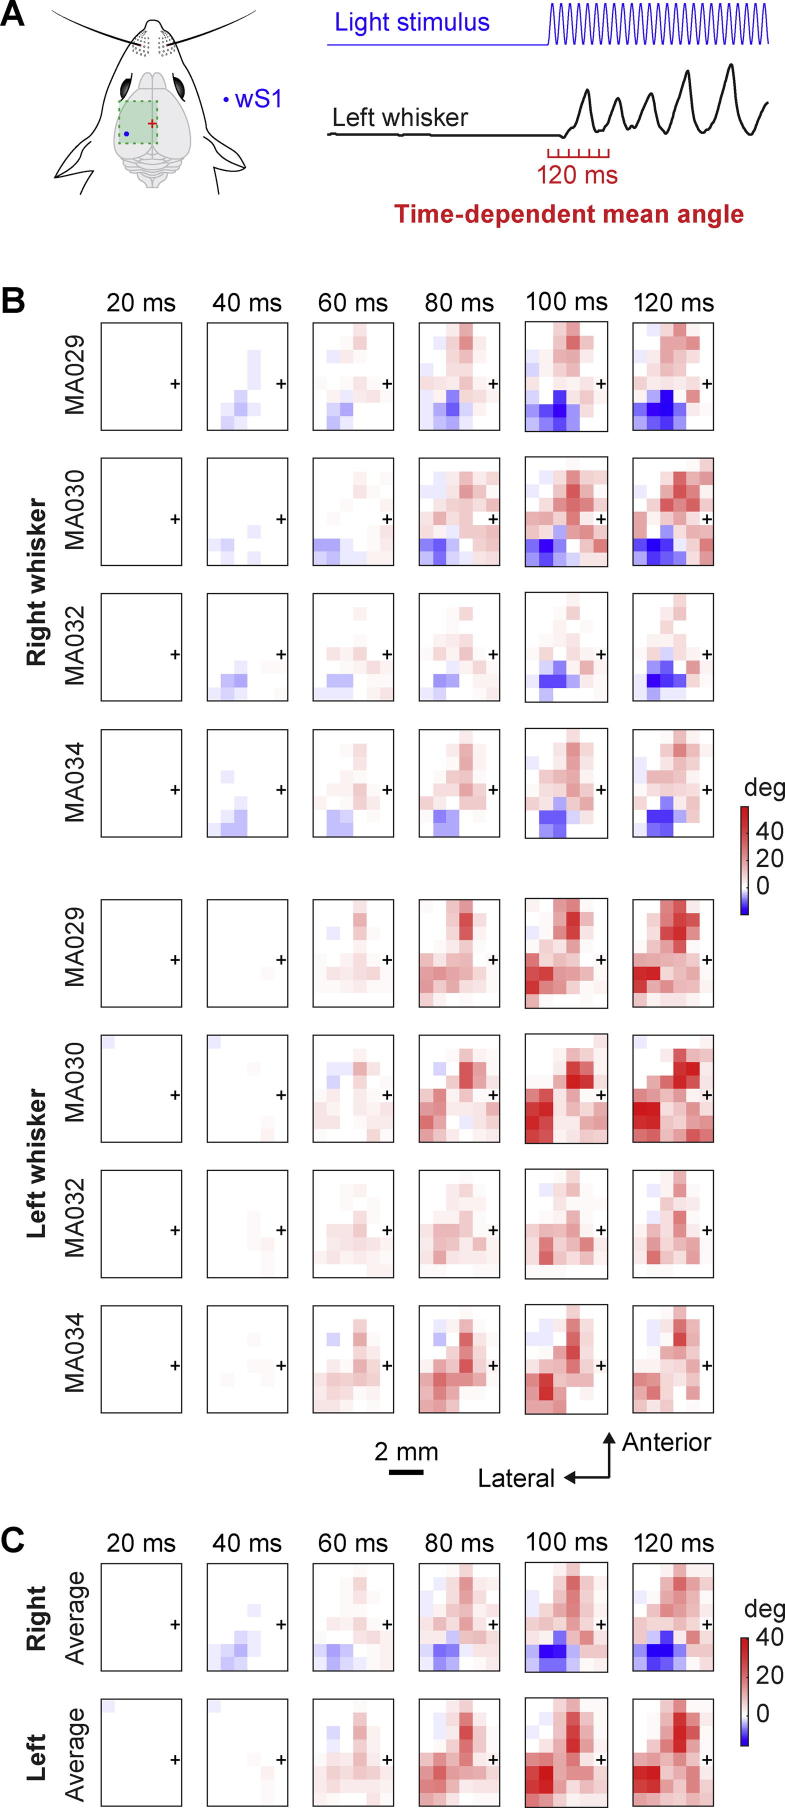
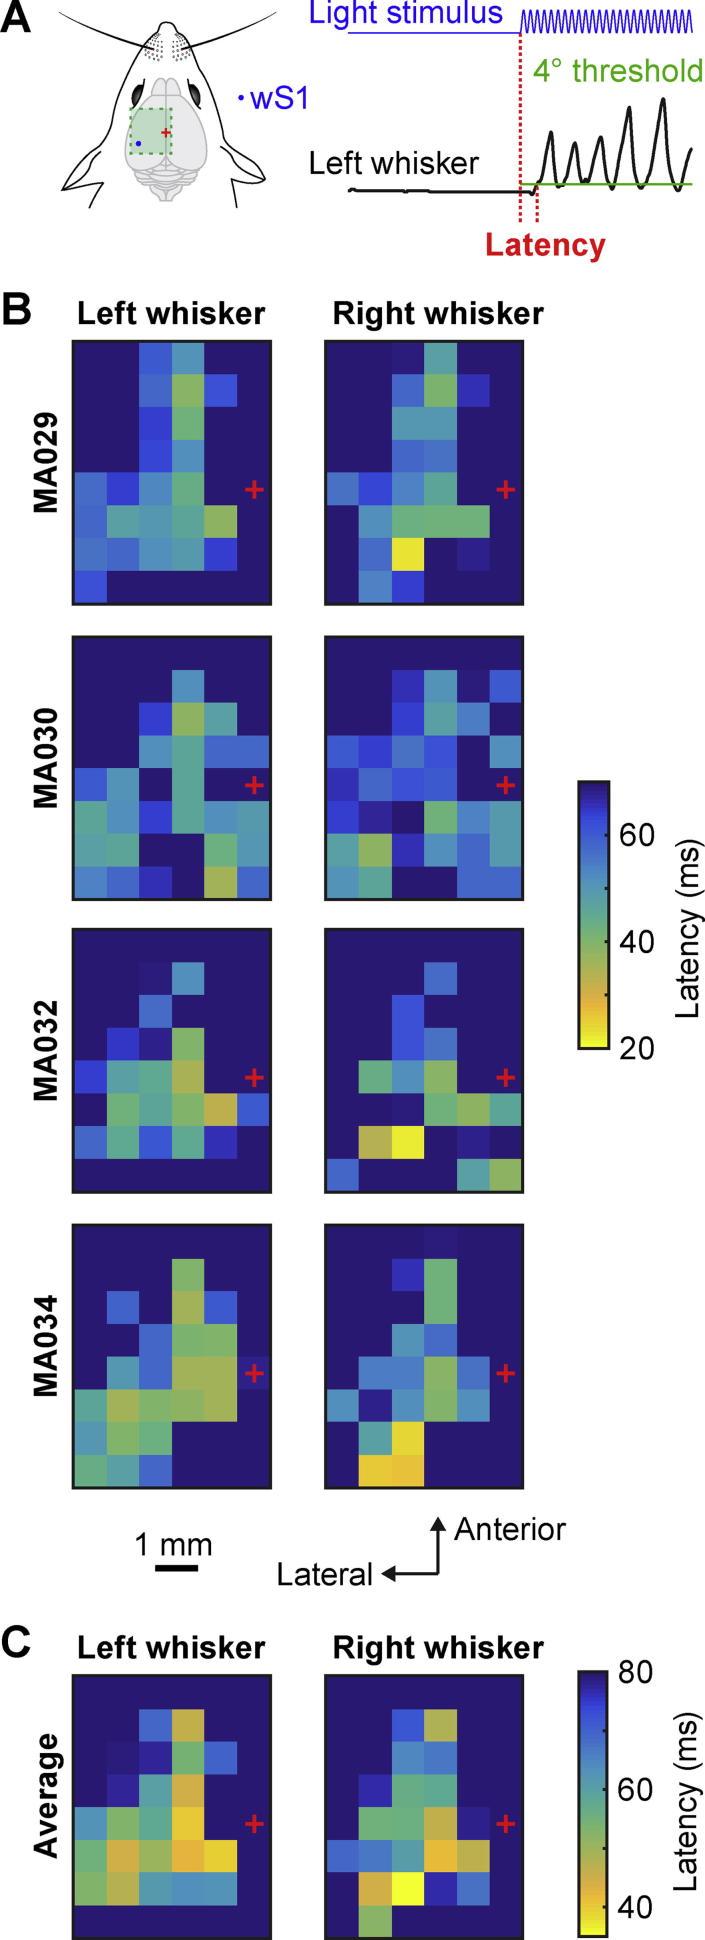
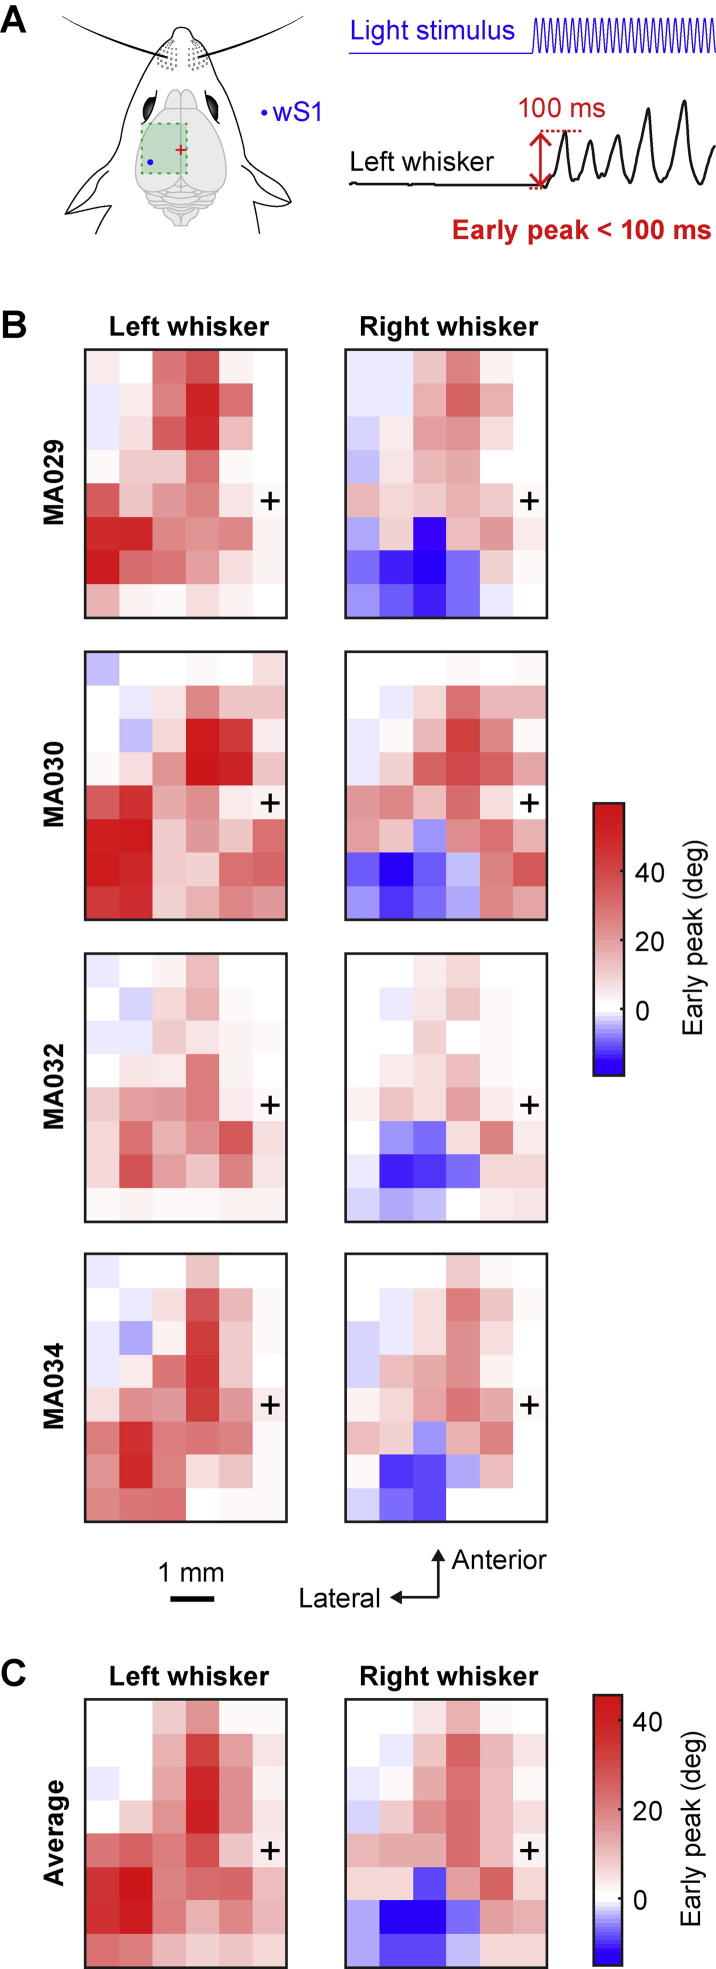
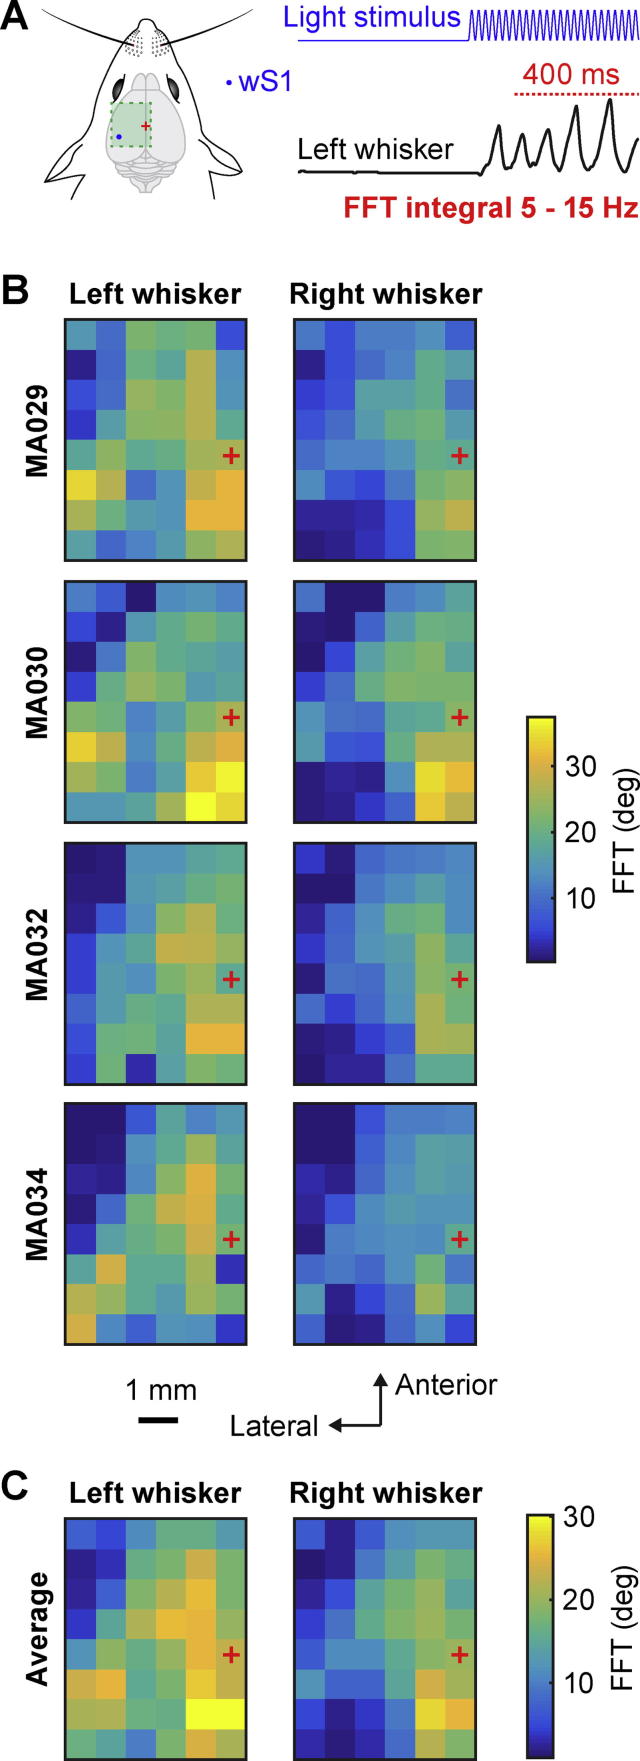
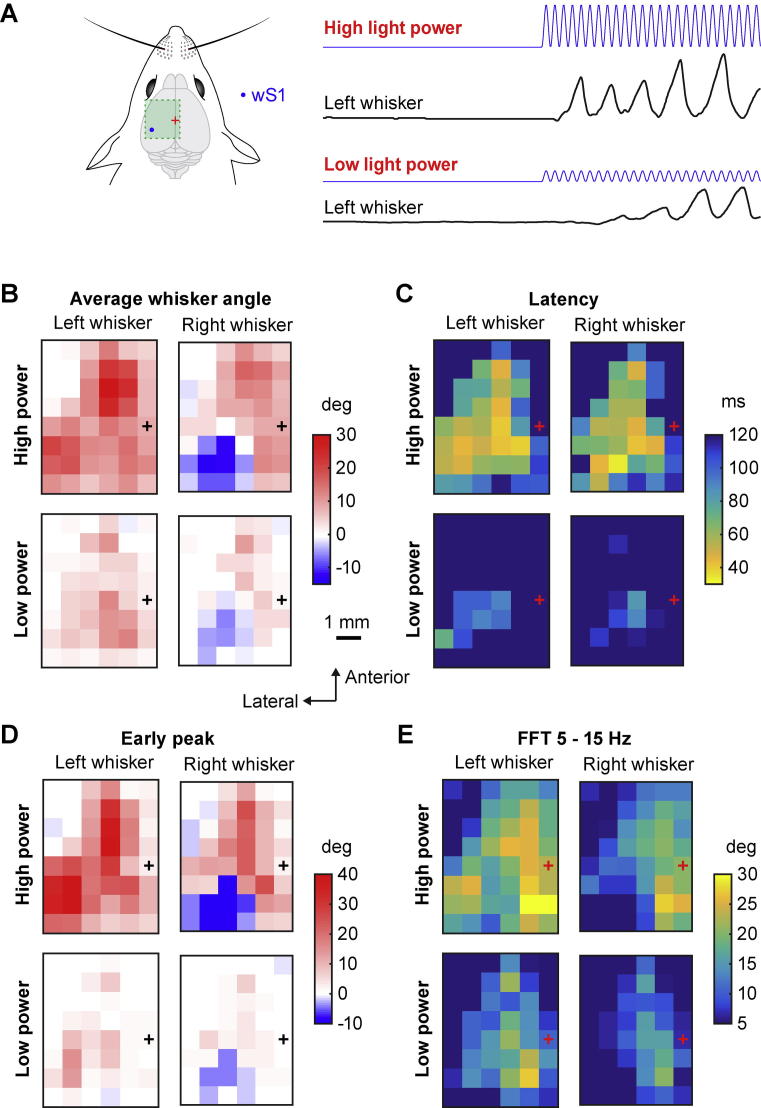
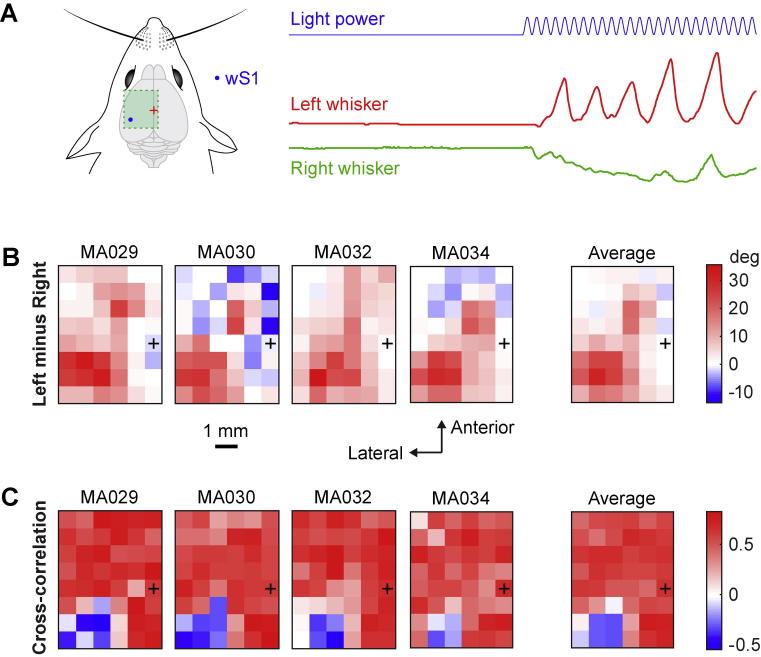
Whisker movements are used by rodents to touch objects in order to extract spatial and textural tactile information about their immediate surroundings. To understand the mechanisms of such active sensorimotor processing it is important to investigate whisker motor control. The activity of neurons in the neocortex affects whisker movements, but many aspects of the organization of cortical whisker motor control remain unknown. Here, we filmed whisker movements evoked by sequential optogenetic stimulation of different locations across the left dorsal sensorimotor cortex of awake head-restrained mice. Whisker movements were evoked by optogenetic stimulation of many regions in the dorsal sensorimotor cortex. Optogenetic stimulation of whisker sensory barrel cortex evoked retraction of the contralateral whisker after a short latency, and a delayed rhythmic protraction of the ipsilateral whisker. Optogenetic stimulation of frontal cortex evoked rhythmic bilateral whisker protraction with a longer latency compared to stimulation of sensory cortex. Compared to frontal cortex stimulation, larger amplitude bilateral rhythmic whisking in a less protracted position was evoked at a similar latency by stimulating a cortical region posterior to Bregma and close to the midline. These data suggest that whisker motor control might be broadly distributed across the dorsal mouse sensorimotor cortex. Future experiments must investigate the complex neuronal circuits connecting specific cell-types in various cortical regions with the whisker motor neurons located in the facial nucleus.

Keywords: barrel cortex; cortical motor map; motor cortex; optogenetics; sensory cortex; whisker motor control.


Figures

Fig. 1
Fig. 1
Experimental setup for optogenetic whisker motor mapping. (A) The left hemisphere of Thy1-ChR2-YFP mice was stimulated by 473 nm blue laser light with a 50-Hz sine wave modulation. The beam was directed by two scanning galvanometer mirrors onto a dichroic mirror that reflected the blue light to the surface of the skull through a 50-mm focal length camera lens to focus the beam on specific locations of the mouse cortex. A high-speed video camera filmed the C2 whiskers of both left and right sides at 500 Hz. Blue ambient light indirectly illuminated the background and masked the laser light. White noise was played to cover noise from galvanometer mirrors and any ambient noise. Laser stimulation, galvanometer mirrors and high-speed video filming were controlled by a computer. (B) YFP fluorescence in fixed coronal slices of a Thy1-ChR2-YFP mouse imaged at 4× magnification at two different anterior–posterior locations, ∼2.10 mm frontal to Bregma (close to wM2, left image) and ∼1.48 mm posterior to Bregma (center image) where we observed the barrel cortex structure of wS1. Schematic drawings were adapted from Paxinos and Franklin (2001). A zoomed-in version of the barrel cortex was acquired with a 10× magnification lens (right image). Layer 5 pyramidal neurons and their dendritic arborizations extending to superficial layers were observed. (C and D) Example of raw movie images of the mouse MA034 at five different times (28, 52, 76, 100 and 124 ms after stimulus onset), during wM1 (left) and wS1 (right) stimulation trial #1 of left hemisphere. The temporal pattern of the laser light stimulus delivered to the mouse cortex at wM1 and wS1 localization is shown in blue. Below are three example trials of left and right whisker angles tracked from the high-speed movies for both wM1 (left) and wS1 (right) stimulation. wM1 stimulation drove protraction of both whiskers, whereas wS1 stimulation drove protraction of the ipsilateral whisker and retraction of the contralateral whisker.
Fig. 2
Fig. 2
Mapping of the average change in whisker angle evoked by optogenetic stimulation. (A) Schematic drawing of wS1 stimulation (left) and an example of the left whisker angle (right) showing how the mean angle was computed: the difference in mean whisker angle during the 500 ms of optogenetic stimulation compared to the mean whisker angle during the two frames (4 ms) before the stimulus onset. (B) The mean change in angle for the left C2 whisker and right C2 whisker of each mouse represented on a 2D color-coded map corresponding to each stimulation coordinate on the left hemisphere. The amplitude of the mean change in angle corresponds to the median of all the trials where the mouse did not whisk before the stimulus (whisker angle standard deviation less than 1° for 200 ms before the stimulation). Positive values reflect a protraction of the whisker and negative values indicate retraction. Bregma position is represented by a black cross. (C) Average over the four mice of the mean angle positions for left and right C2 whiskers relative to the stimulation coordinates on the left hemisphere. There was a large protraction of both whiskers when wM1/wM2 was stimulated. Protraction of the ipsilateral whisker and a retraction of the contralateral whisker was evoked when wS1 was stimulated.
Fig. 3
Fig. 3
Mapping of the time-dependent change in whisker angle evoked by optogenetic stimulation. (A) Schematic drawing of wS1 stimulation (left) and an example of the left whisker angle (right) showing how the time-dependent whisker angle was computed: the mean change in whisker angle during six consecutive time bins (0–20, 20–40, 40–60, 60–80, 80–100, and 100–120 ms relative to stimulation onset) from the mean whisker position during the 4 ms before the stimulus onset. (B) Mean whisker angle during the six 20-ms time bins for the left C2 whisker and right C2 whisker of each mouse represented on a 2D color-coded map corresponding to each stimulation coordinate of the left hemisphere. The amplitude of the mean angles reported corresponds to the median of all the trials where the mouse did not whisk before the stimulus (whisker angle standard deviation less than 1° for 200 ms before the stimulation). Positive values reflect a protraction of the whisker and negative values indicate retraction. Bregma position is represented by a black cross. (C) Average over the four mice of the time-dependent mean angle positions for left and right C2 whiskers relative to the stimulation coordinates of the left hemisphere. The first movement evoked was in the 20–40-ms time-window, and was a retraction of the contralateral whisker when wS1 cortex was stimulated. In the 40–60-ms time-window, a protraction of both whiskers was evoked when wM1/wM2 and PtA were stimulated.
Fig. 4
Fig. 4
Latency maps of whisker movements evoked by optogenetic stimulation. (A) Schematic drawing of wS1 stimulation (left) and an example of the left whisker angle (right) showing how the latency was computed: time relative to stimulation onset when the whisker moved more than 4° compared to its initial position. (B) Latencies for the left C2 whisker and right C2 whisker of each mouse represented on a 2D color-coded map corresponding to each stimulation coordinate of the left hemisphere. Trials in which the mouse did not move its whisker by more than 4° were not included in the latency analysis. The value of latencies reported corresponds to the median of all the trials where the mouse did not whisk before the stimulus (whisker angle standard deviation below 1° for 200 ms before the stimulation). Bregma position is represented by a red cross. (C) Average over the four mice of the latencies for left and right C2 whiskers relative to the stimulation coordinates on the left hemisphere. The shortest latencies were for contralateral whisker retraction when wS1 was stimulated.
Fig. 5
Fig. 5
Maps of the early peak whisker movement evoked by optogenetic stimulation. (A) Schematic drawing of wS1 stimulation (left) and an example of the left whisker angle (right) showing how the early peak parameter was computed: the maximum (for protraction) or minimum (for retraction) change in whisker angle during the first 100 ms after the stimulus onset. (B) Early peak whisker movement for the left C2 whisker and right C2 whisker of each mouse represented on a 2D color-coded map corresponding to each stimulation coordinate on the left hemisphere. The value of the early peak movement reported corresponds to the median of all the trials where the mouse did not whisk before the stimulus (whisker angle standard deviation below 1° for 200 ms before the stimulation). Positive values reflect a protraction of the whisker and negative values indicate retraction. Bregma position is represented by a black cross. (C) Average over the four mice of the early peak change in whisker angle for left and right C2 whiskers relative to the stimulation coordinates on the left hemisphere. The largest early whisker protraction was evoked by stimulating wM1/wM2. Stimulating wS1 evoked a large early protraction of the ipsilateral whisker and a large early retraction of the contralateral whisker.
Fig. 6
Fig. 6
Maps of the amplitude of whisker movements in the 5–15-Hz frequency range evoked by optogenetic stimulation. (A) Schematic drawing of wS1 stimulation (left) and an example of the left whisker angle (right) showing how the fast Fourier transform (FFT) was computed: the integral from 5 Hz to 15 Hz of the FFT during the last 400 ms of the laser light stimulation. (B) FFT values for the left C2 whisker and right C2 whisker of each mouse represented on a 2D color-coded map corresponding to each stimulation coordinate on the left hemisphere. The value of FFT reported corresponds to the median of all the trials where the mouse did not whisk before the stimulus (whisker angle standard deviation less than 1° for 200 ms before the stimulation). Bregma position is represented by a red cross. (C) Average over the four mice of the FFT for left and right C2 whiskers relative to the stimulation coordinates on the left hemisphere. The largest 5–15-Hz whisker movements were evoked by stimulating the PtA region (posterior to Bregma close to the midline).
Fig. 7
Fig. 7
Motor maps evoked by different blue light intensities. (A) Schematic drawing of wS1 stimulation (left) and examples of the left whisker angle (right) for two wS1 stimulation trials with either high laser light power (mean power 1.75 mW) or low laser light power (mean power 0.36 mW). (B) Comparison of the averaged left and right whisker mean angle positions for the high and low power trials. The whiskers protracted/retracted less for low power stimulation compared to the high power, but the motor map pattern stayed relatively comparable. The high power map is the same as shown in Fig.2C. (C) Comparison of the averaged left and right whisker movement latencies for the high and low light power trials. The latencies of the whisker movements increased in low power stimulation compared to high power, but the smallest latencies observed were still located around wS1. The high power map is the same data as shown in Fig.4C. (D) Comparison of the averaged left and right early peak whisker movement amplitudes for the high and low light power trials during the first 100 ms after stimulus onset. The amplitudes of the early movements were reduced with low power but the largest protractions observed for both conditions were located in wM1/wM2 for the two whiskers and wS1 for the ipsilateral whisker, and the largest retraction was still observed around wS1 for the contralateral whisker. The high power map is the same as shown in Fig.5C. (E) Comparison of the averaged left and right whisker 5–15 Hz FFT for the high and low light power trials during the last 400 ms of the stimulation. The whisking amplitudes were reduced for low power stimulation compared to high power stimulation, but the largest 5–15-Hz FFT values for both conditions were localized in the PtA region posterior to Bregma close the midline. The high power map is the same as shown in Fig.6C.
Fig. 8
Fig. 8
Correlations and differences in the ipsilateral and contralateral whisker movements evoked by optogenetic stimulation. (A) Schematic drawing of wS1 stimulation (left) and an example of the corresponding left and right whisker angles (right). (B) Difference between the left whisker angle and right whisker angle (left minus right) reported on a 2D color-coded map for each mouse (left images) and averaged across the four mice (right image). The left whisker usually protracted more than the right whisker when the left hemisphere was stimulated. (C) Cross-correlations of the left and right whiskers positions during the stimulation were high in almost all cortical areas except for stimulation of wS1, where there was an anti-correlation of the two whiskers.
Fig. 9
Fig. 9
Whisker motor maps in the context of sensory maps. (A) Sensory map obtained with intrinsic optical imaging. Right C2, A1 and D1 whiskers, right forepaw, right hindpaw, tail, lip and tongue were deflected at a frequency of 10 Hz using a mechanical stimulator. A train of click sounds was used to deliver auditory stimuli. Light flashes pointed toward the right eye were used to deliver visual stimuli. The color-coded contours indicate the region of maximal evoked activity in each mouse. (B) Overlay of the sensory map obtained in panel A with the motor map of the right whisker mean angle positions (as shown in Fig.2C). There was a good overlap between the primary sensory whisker cortex (wS1) and the region where stimulation evoked a large retraction of the contralateral whisker.

Similar articles

Cited by

References

    1. Akemann W., Mutoh H., Perron A., Rossier J., Knöpfel T. Imaging brain electric signals with genetically targeted voltage-sensitive fluorescent proteins. Nat Methods. 2010;7:643–649. - PubMed
    1. Arenkiel B.R., Peca J., Davison I.G., Feliciano C., Deisseroth K., Augustine G.J., Ehlers M.D., Feng G. In vivo light-induced activation of neural circuitry in transgenic mice expressing channelrhodopsin-2. Neuron. 2007;54:205–218. - PMC - PubMed
    1. Ayling O.G., Harrison T.C., Boyd J.D., Goroshkov A., Murphy T.H. Automated light-based mapping of motor cortex by photoactivation of channelrhodopsin-2 transgenic mice. Nat Methods. 2009;6:219–224. - PubMed
    1. Bosman L.W., Houweling A.R., Owens C.B., Tanke N., Shevchouk O.T., Rahmati N., Teunissen W.H., Ju C., Gong W., Koekkoek S.K., De Zeeuw C.I. Anatomical pathways involved in generating and sensing rhythmic whisker movements. Front Integr Neurosci. 2011;5:53. - PMC - PubMed
    1. Boyden E.S., Zhang F., Bamberg E., Nagel G., Deisseroth K. Millisecond-timescale, genetically targeted optical control of neural activity. Nat Neurosci. 2005;8:1263–1268. - PubMed

LinkOut - more resources