. 2017 Apr 18;8(16):26129-26141.
doi: 10.18632/oncotarget.15387.

ZNF521 sustains the differentiation block in MLL-rearranged acute myeloid leukemia

Affiliations

ZNF521 sustains the differentiation block in MLL-rearranged acute myeloid leukemia

Giuseppe Germano et al. Oncotarget. .

Abstract

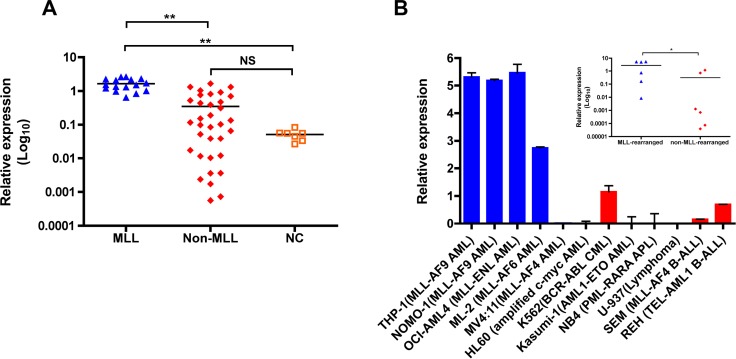
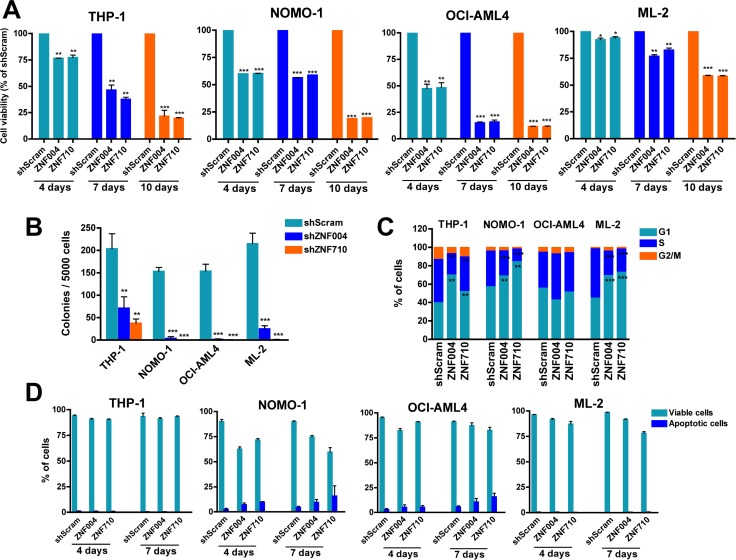
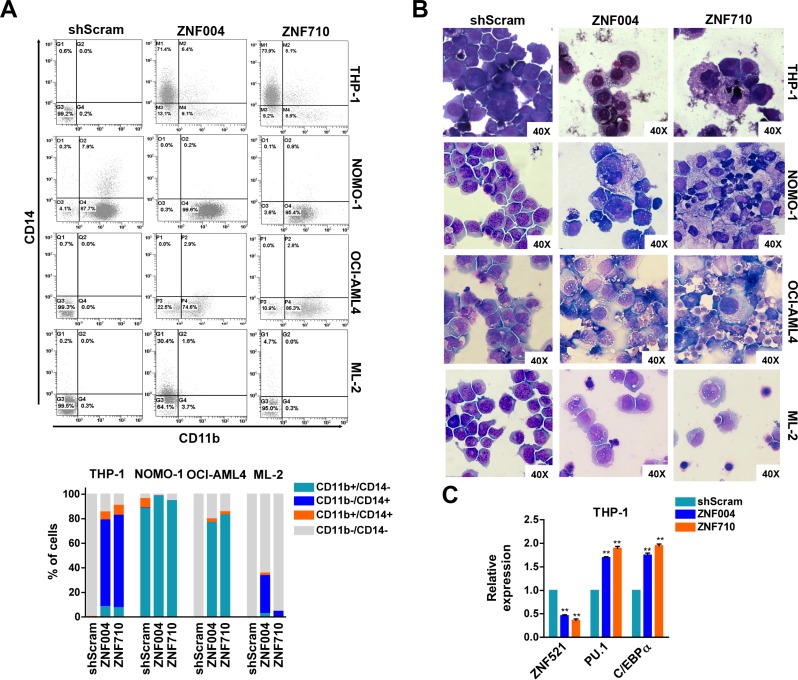
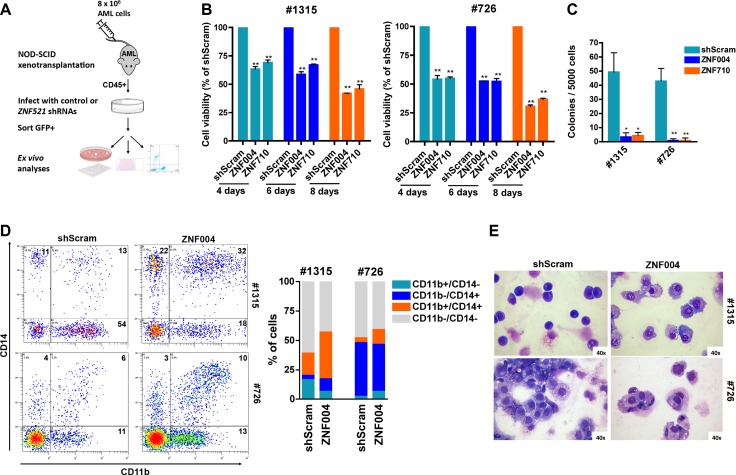
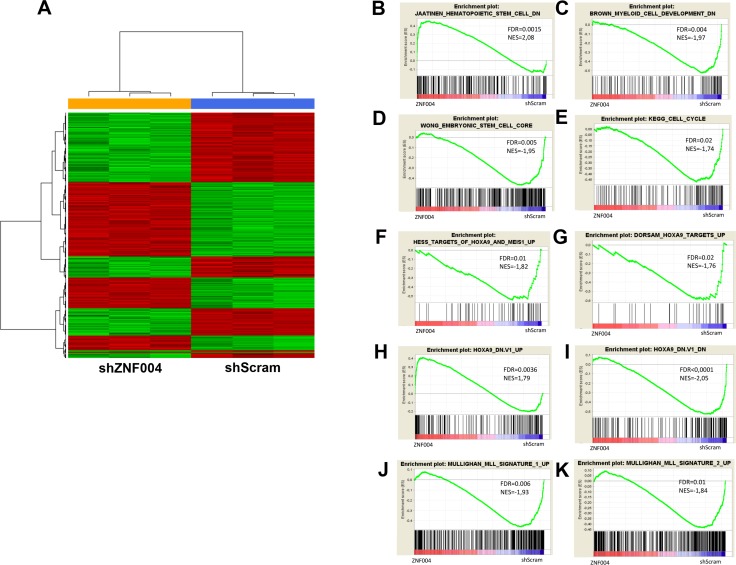
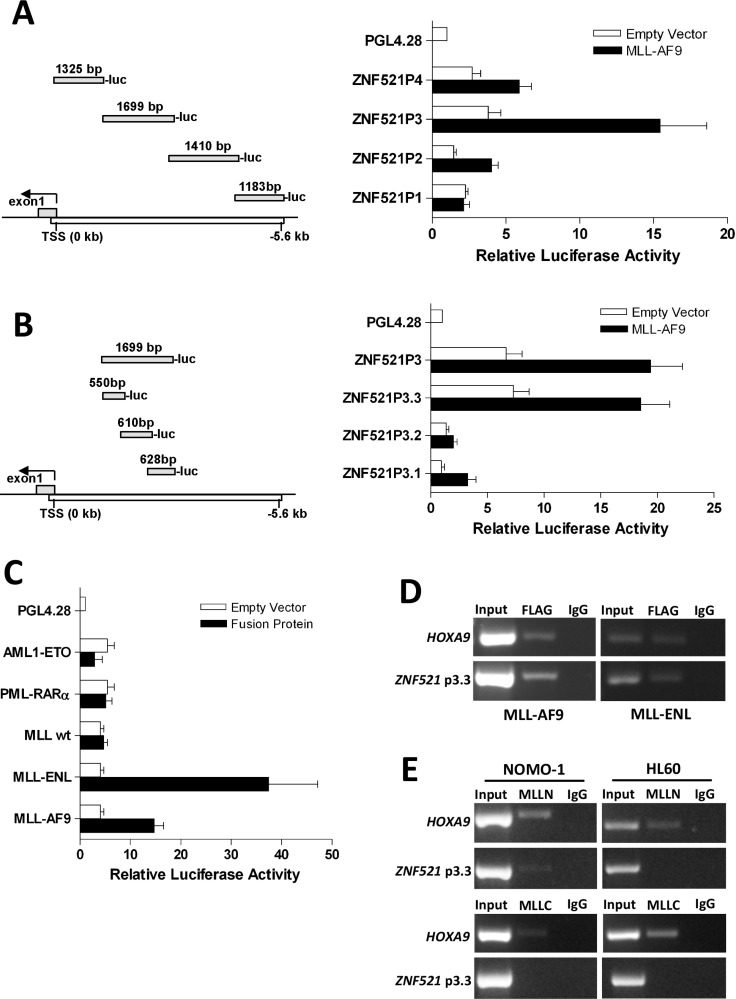
Zinc finger protein 521 (ZNF521) is a multiple zinc finger transcription factor and a strong candidate as regulator of hematopoietic stem cell homeostasis. Recently, independent gene expression profile studies have evidenced a positive correlation between ZNF521 mRNA overexpression and MLL-rearranged acute myeloid leukemia (AML), leaving open the question on the role of ZNF521 in this subtype of leukemia. In this study, we sought to analyze the effect of ZNF521 depletion on MLL-rearranged AML cell lines and MLL-AF9 xenograft primary cells. Knockdown of ZNF521 with short-hairpin RNA (shRNA) led to decreased leukemia proliferation, reduced colony formation and caused cell cycle arrest in MLL-rearranged AML cell lines. Importantly, we showed that loss of ZNF521 substantially caused differentiation of both MLL-rearranged cell lines and primary cells. Moreover, gene profile analysis in ZNF521-silenced THP-1 cells revealed a loss of MLL-AF9-directed leukemic signature and an increase of the differentiation program. Finally, we determined that both MLL-AF9 and MLL-ENL fusion proteins directly interacted with ZNF521 promoter activating its transcription. In conclusion, our findings identify ZNF521 as a critical effector of MLL fusion proteins in blocking myeloid differentiation and highlight ZNF521 as a potential therapeutic target for this subtype of leukemia.

Keywords: ZNF521; acute myeloid leukemia; myeloid differentiation; transcription.


Conflict of interest statement

CONFLICTS OF INTEREST

The authors declare no conflicts of interest.

Figures

Figure 1
Figure 1. ZNF521 is aberrantly overexpressed in MLL-rearranged AML
(A) qRT-PCR for the expression of ZNF521 in 16 MLL-rearranged AML (MLL), 34 non-MLL-rearranged AML (Non-MLL) and 7 normal control (NC). The results are normalized to GAPDH and analyzed by 2−ΔCt method. NS, not significant, **P < 0.001, kruskal-Wallis test. (B) qRT-PCR analysis of ZNF521 expression in a representative panel of 12 human leukemic cell lines normalized to GAPDH and analyzed by 2−ΔCt method. Data are represented as mean ± SD of three independent experiments. y axis is linear. Inset, dot plots of mean ZNF521 mRNA levels in MLL-rearranged and non-MLL-rearranged cell lines from data presented in (B). *P < 0.05, Mann–Whitney U-test.
Figure 2
Figure 2. ZNF521 depletion impairs cell proliferation, induces cell cycle arrest but not apoptosis in MLL-rearranged cell lines
(A) MTT cell viability assay in the MLL leukemic cells THP-1, NOMO-1, OCI-AML4 and ML2 transduced with ZNF521 shRNAs (ZNF004 or ZNF710) or non-targeting scramble control (shScram). GFP+ cells were sorted 4 days after transduction and placed in appropriate medium. Graphs show percentage of GFP+ cells measured at day 4, day 7 and day 10, normalized to the percentage of shScram cells. Data are represented as mean ± SD of at least three independent experiments. *P < 0.05, **P < 0.001, ***P < 0.0001, t-test. (B) Colony formation of GFP+ cells transduced with ZNF521 shRNAs or shScram. Error bars represent mean ± S.D. of three independent experiments. **P < 0.001, ***P < 0.0001, t-test. (C) Cell cycle distribution at day 7 of ZNF521 knockdown cells and control shScram of gated GFP+ cells. Data are represented as mean ± SD of three independent experiments. **P < 0.001, ***P < 0.0001, t-test. (D) Percentage of apoptotic cells (Annexin V+/DAPI- and Annexin V+/DAPI+) measured after 4 and 7 days post-transduction of gated GFP+ cell population. Data are represented as mean ± SD of three independent experiments.
Figure 3
Figure 3. ZNF521 depletion induces myelomonocytic differentiation in MLL-rearranged cell lines
(A) Representative flow cytometry dot plots of gated GFP+ cells analyzed for CD11b and CD14 expression after 7 days of transduction. The mean percentage of CD11b+/CD14−, CD11b−/CD14+, CD11b+/CD14+ and CD11b−/CD14− cells of three biological replicates are shown below. (B) Representative Wright-Giemsa staining of cytospin preparations at day 7 of THP-1, NOMO-1, OCI-AML4 and ML2 GFP+ cells transduced with ZNF521 shRNAs or shScram. Original magnification, × 40. (C) qRT-PCR on THP-1 GFP+ cells for the expression of ZNF521, PU.1 and C/EBPα at day 7 post transduction with ZNF521 shRNAs or shScram. The results are relative to shScram-transduced cells, normalized to GAPDH and analyzed by 2−ΔΔCt method. Data are represented as mean ± SD of three independent experiments. **P < 0.01, t-test.
Figure 4
Figure 4. ZNF521 depletion impairs cell growth and induces differentiation on primary MLL-AF9 AML patient-derived xenograft cells
(A) Flow chart of experimental procedure for analyzing the role of ZNF521 in ex vivo cells obtained from patient-derived xenografts. Leukemic cells from patient #726 or patient #1315 were isolated from primary AML mice and infected with lentivirus encoding an shRNA to ZNF521 or shScram. Four days after transduction cells were FACS-sorted for GFP expression and cultured. (B) MTT cell viability assay in ex vivo cells. Data are represented as mean ± SD of three independent experiments. **P < 0.001, t-test. (C) Clonogenic growth of transduced ex vivo GFP+ cells following 14 days in methylcellulose culture. Data are shown as the means ± SD for triplicate analyses. *P < 0.05, **P < 0.001, t-test. (D) Representative flow cytometry dot plots showing expression of CD11b and CD14 in human CD45+ cells in the GFP+ cells population. Numbers indicate percentage of the four populations. The mean percentage of CD11b+/CD14−, CD11b−/CD14+, CD11b+/CD14+ and CD11b−/CD14− populations of three biological replicates are shown in the right panel. (E) Representative Wright-Giemsa-stained cytospins of ex vivo GFP+ cells at day 4 post transduction with ZNF521 shRNA (ZNF004) or shScram. Original magnification, × 40.
Figure 5
Figure 5. Microarray results of ZNF521 depletion in THP-1 cells
(A) Hierarchical clustering analysis of differently gene expression profiles associated with transduced THP-1 cells with ZNF521 shRNA (ZNF004) or control shScram after 4 days of transduction. Each column represents a sample and each row represent a gene. Relative levels of gene expression are depicted with a color scale where red represents the highest level of expression and green represents the lowest level. (BE) GSEA plot showing gene expression signature of (B) negative enrichment of cell cycle signature, (C) negative enrichment of downregulated genes in myeloid cell development signature, (D) positive enrichment of downregulated genes in HSCs signature and (E) negative enrichment of embryonic stem cell core signature. (F, G) GSEA plot showing negative enrichment of MLL signature up-regulated genes in pediatric AML. (H–K) GSEA showing enrichment of upregulated genes in HOXA9 up-regulated (H) and down-regulated (I) signatures in HOXA9 knockdown cells, (J) positive enrichment of HOXA9 targets up-regulated and (K) negative enrichment of HOXA9 targets down-regulated in hematopoietic stem cells. The normalization enrichment score (NES) and the false discovery rate (FDR) values are indicated in each panel. Red and blue color bars indicated the positive and negative enrichment, respectively.
Figure 6
Figure 6. MLL-AF9 and MLL-ENL fusion oncoproteins bind to ZNF521 promoter
(A) An illustration of the 4 fragments representing 5058 bp of ZNF521 promoter and their positions are indicated in the left panel. The numbers above each part are referred to the length (bp) of the genomic fragment that was PCR amplified and then cloned upstream of the luciferase coding sequence (luc) of PGL42.8 plasmid. In the right panel, horizontal bars represent the luciferase activity generate by each construct following transient transfection in 293T cells with MLL-AF9 plasmid. (B) An illustration of the 3 fragments of ZNF521P3 and their respective positions are shown in the left panel. The numbers above each part are referred to the length (bp) of the genomic fragment cloned into PGL42.8 plasmid. In the right panel, horizontal bars represent the luciferase activity generate by each construct as described in A. (C) Luciferase activity of the ZNF521P3.3 fragment after transient transfection in 293T cells with AML1-ETO, PML-RARα, wild-type (WT) MLL, MLL-ENL or MLL-AF9 is shown. For each panel (A, B and C), luciferase activity is expressed relative to the empty vector of each expression plasmid (white bars) and normalizes to Firefly/Renilla luciferase activities considering the empty pGL42.8 vector as 1. Data are represented as mean ± SD of three independent experiments. (D) Both MLL-AF9 and MLL-ENL fusion oncogenes associates with the ZNF521P3.3 promoter region. ChIP assays were performed with the crossed-linked genomic DNA isolated from 293T cells transfected with either Flag-MLL-AF9 or Flag-MLL-ENL and using anti-Flag and anti-IgG antibodies. Normal IgG was used as a negative control. Input DNA from sonicated chromatin and immunoprecipitated DNA were subjected to PCR amplification with primers spanning the ZNF521P3.3 promoter region. PCR amplification with primers specific to the HOXA9 promoter region was used as positive control. Data from a representative of three replicate experiments are shown. (E) ChIP analysis of the ZNF521P3.3 promoter in NOMO-1 cells, which express MLL-AF9 and HL60 cells, which express WT MLL but not MLL-AF9, using antibodies directed to the N-terminus of MLL (MLLN; upper panel), C-terminus of MLL (MLLC; lower panel) or IgG. Immunoprecipitated chromatin samples were analyzed by PCR using primers corresponding to promoter ZNF521P3.3 region. Note that no PCR product for ZNF521 promoter was obtained when anti-MLLC, which recognizes only the WT MLL but not MLL-AF9, was used for immunoprecipitation.

Similar articles

Cited by

References

    1. Estey E, Dohner H. Acute myeloid leukaemia. Lancet. 2006;368:1894–1907. - PubMed
    1. McMahon KA, Hiew SY, Hadjur S, Veiga-Fernandes H, Menzel U, Price AJ, Kioussis D, Williams O, Brady HJ. Mll has a critical role in fetal and adult hematopoietic stem cell self-renewal. Cell Stem Cell. 2007;1:338–345. - PubMed
    1. Jude CD, Climer L, Xu D, Artinger E, Fisher JK, Ernst P. Unique and independent roles for MLL in adult hematopoietic stem cells and progenitors. Cell Stem Cell. 2007;1:324–337. - PMC - PubMed
    1. Meyer C, Hofmann J, Burmeister T, Groger D, Park TS, Emerenciano M, Pombo de Oliveira M, Renneville A, Villarese P, Macintyre E, Cave H, Clappier E, Mass-Malo K, et al. The MLL recombinome of acute leukemias in 2013. Leukemia. 2013;27:2165–2176. - PMC - PubMed
    1. Krivtsov AV, Armstrong SA. MLL translocations, histone modifications and leukaemia stem-cell development. Nat Rev Cancer. 2007;7:823–833. - PubMed

MeSH terms

Substances