

High-Throughput Analysis of Intact Human Proteins Using UVPD and HCD on an Orbitrap Mass Spectrometer
- PMID: 28412815
- PMCID: PMC5549616
- DOI: 10.1021/acs.jproteome.7b00043
High-Throughput Analysis of Intact Human Proteins Using UVPD and HCD on an Orbitrap Mass Spectrometer
Abstract
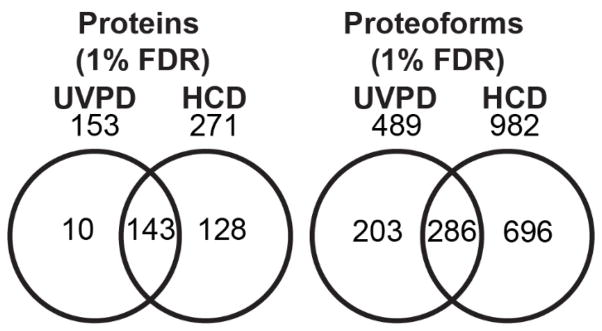
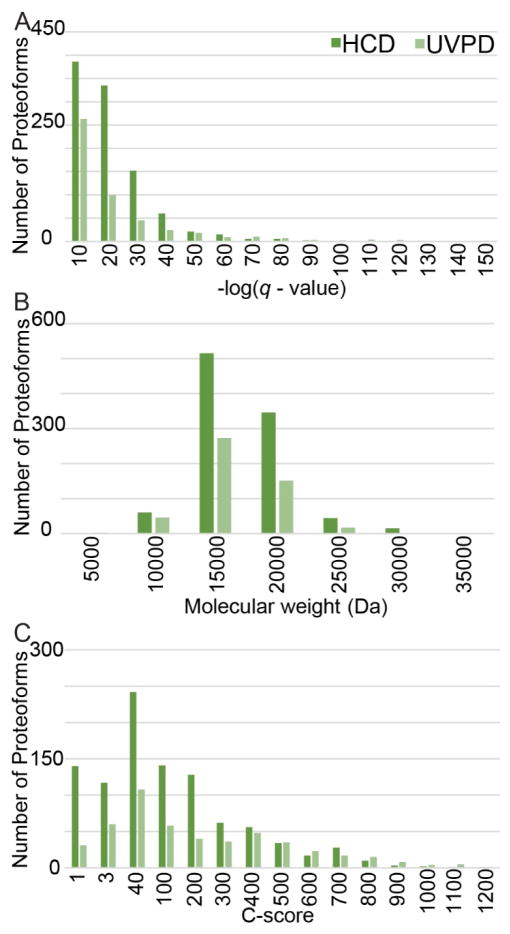
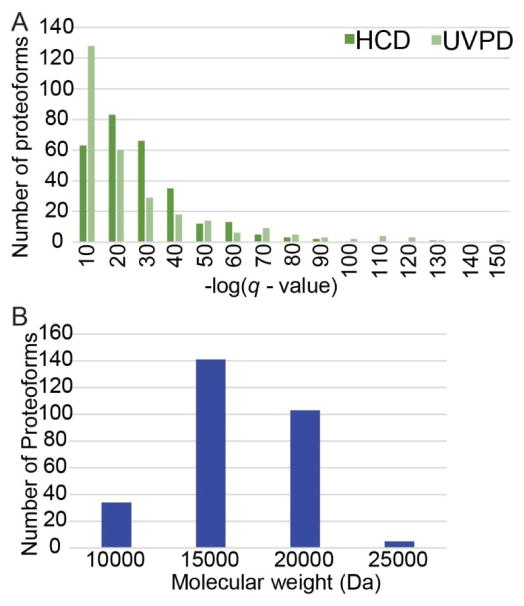
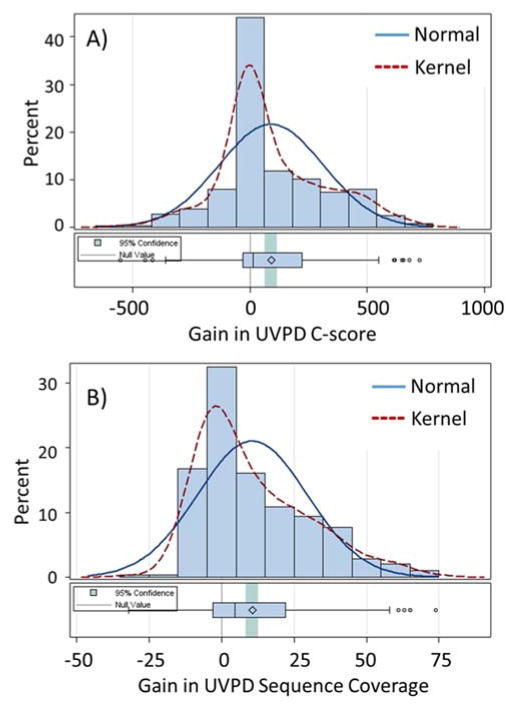
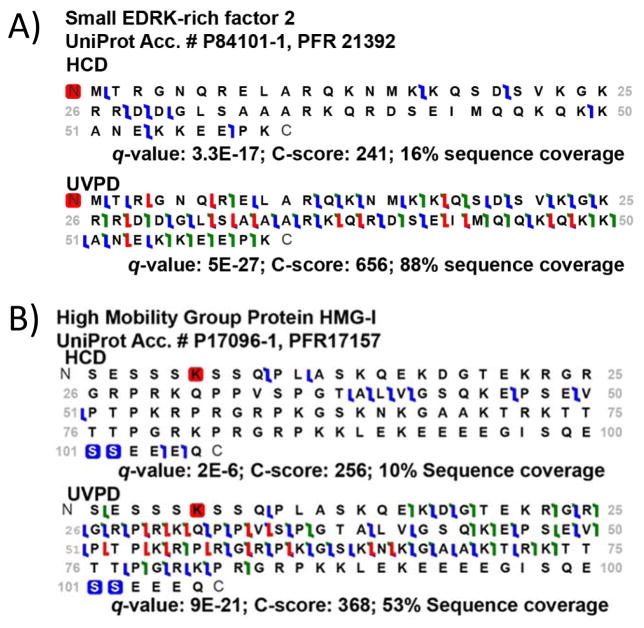
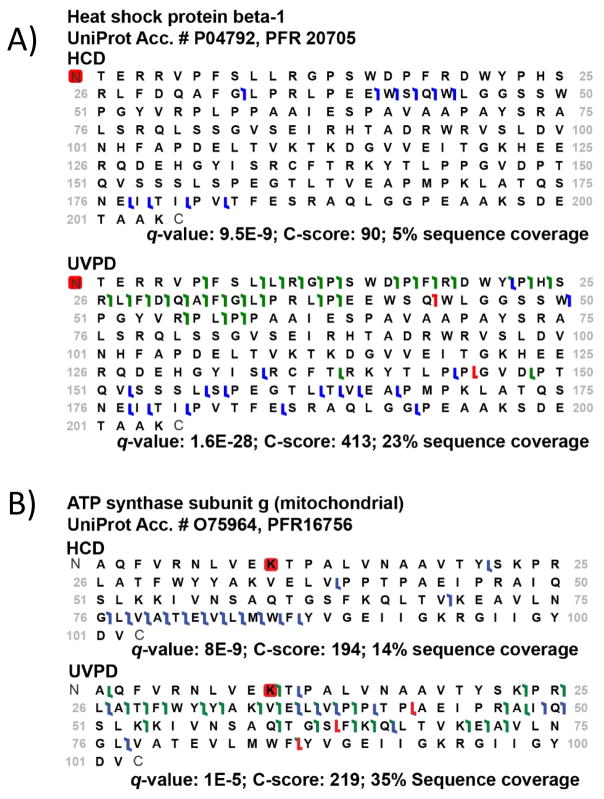
The analysis of intact proteins (top-down strategy) by mass spectrometry has great potential to elucidate proteoform variation, including patterns of post-translational modifications (PTMs), which may not be discernible by analysis of peptides alone (bottom-up approach). To maximize sequence coverage and localization of PTMs, various fragmentation modes have been developed to produce fragment ions from deep within intact proteins. Ultraviolet photodissociation (UVPD) has recently been shown to produce high sequence coverage and PTM retention on a variety of proteins, with increasing evidence of efficacy on a chromatographic time scale. However, utilization of UVPD for high-throughput top-down analysis to date has been limited by bioinformatics. Here we detected 153 proteins and 489 proteoforms using UVPD and 271 proteins and 982 proteoforms using higher energy collisional dissociation (HCD) in a comparative analysis of HeLa whole-cell lysate by qualitative top-down proteomics. Of the total detected proteoforms, 286 overlapped between the UVPD and HCD data sets, with 68% of proteoforms having C scores greater than 40 for UVPD and 63% for HCD. The average sequence coverage (28 ± 20% for UVPD versus 17 ± 8% for HCD, p < 0.0001) was found to be higher for UVPD than HCD and with a trend toward improvement in q value for the UVPD data set. This study demonstrates the complementarity of UVPD and HCD for more extensive protein profiling and proteoform characterization.
Keywords: HeLa; Orbitrap mass spectrometer; higher-energy collisional dissociation; protein; proteoform; proteomics; top-down; ultraviolet photodissociation.
Figures
Similar articles
-
The Value of Activated Ion Electron Transfer Dissociation for High-Throughput Top-Down Characterization of Intact Proteins.Anal Chem. 2018 Jul 17;90(14):8553-8560. doi: 10.1021/acs.analchem.8b01638. Epub 2018 Jul 5. Anal Chem. 2018. PMID: 29924586 Free PMC article.
-
Thorough Performance Evaluation of 213 nm Ultraviolet Photodissociation for Top-down Proteomics.Mol Cell Proteomics. 2020 Feb;19(2):405-420. doi: 10.1074/mcp.TIR119.001638. Epub 2019 Dec 30. Mol Cell Proteomics. 2020. PMID: 31888965 Free PMC article.
-
Top-Down Characterization of Heavily Modified Histones Using 193 nm Ultraviolet Photodissociation Mass Spectrometry.J Proteome Res. 2018 Mar 2;17(3):1138-1145. doi: 10.1021/acs.jproteome.7b00801. Epub 2018 Jan 31. J Proteome Res. 2018. PMID: 29343059
-
Top-Down Proteomics and the Challenges of True Proteoform Characterization.J Proteome Res. 2023 Dec 1;22(12):3663-3675. doi: 10.1021/acs.jproteome.3c00416. Epub 2023 Nov 8. J Proteome Res. 2023. PMID: 37937372 Free PMC article. Review.
-
Ultraviolet Photodissociation Mass Spectrometry for Analysis of Biological Molecules.Chem Rev. 2020 Apr 8;120(7):3328-3380. doi: 10.1021/acs.chemrev.9b00440. Epub 2019 Dec 18. Chem Rev. 2020. PMID: 31851501 Free PMC article. Review.
Cited by
-
Fourier-transform ion cyclotron resonance mass spectrometry for characterizing proteoforms.Mass Spectrom Rev. 2022 Mar;41(2):158-177. doi: 10.1002/mas.21653. Epub 2020 Sep 7. Mass Spectrom Rev. 2022. PMID: 32894796 Free PMC article. Review.
-
Multidimensional Top-Down Proteomics of Brain-Region-Specific Mouse Brain Proteoforms Responsive to Cocaine and Estradiol.J Proteome Res. 2019 Nov 1;18(11):3999-4012. doi: 10.1021/acs.jproteome.9b00481. Epub 2019 Oct 2. J Proteome Res. 2019. PMID: 31550894 Free PMC article.
-
Ion Activation Methods for Peptides and Proteins.Anal Chem. 2020 Jan 7;92(1):227-251. doi: 10.1021/acs.analchem.9b04859. Epub 2019 Nov 12. Anal Chem. 2020. PMID: 31665881 Free PMC article. Review. No abstract available.
-
The Value of Activated Ion Electron Transfer Dissociation for High-Throughput Top-Down Characterization of Intact Proteins.Anal Chem. 2018 Jul 17;90(14):8553-8560. doi: 10.1021/acs.analchem.8b01638. Epub 2018 Jul 5. Anal Chem. 2018. PMID: 29924586 Free PMC article.
-
Accurate Sequence Analysis of a Monoclonal Antibody by Top-Down and Middle-Down Orbitrap Mass Spectrometry Applying Multiple Ion Activation Techniques.Anal Chem. 2018 Jul 17;90(14):8421-8429. doi: 10.1021/acs.analchem.8b00984. Epub 2018 Jun 28. Anal Chem. 2018. PMID: 29894161 Free PMC article.
References
-
- Gillet LC, Leitner A, Aebersold R. Mass Spectrometry Applied to Bottom-Up Proteomics: Entering the High-Throughput Era for Hypothesis Testing. Annual Review of Analytical Chemistry. 2016;9(1):449–472. - PubMed
Publication types
MeSH terms
Substances
Grants and funding
LinkOut - more resources
Full Text Sources
Other Literature Sources
Miscellaneous
