. 2017 Apr 17;8(1):76.
doi: 10.1186/s13287-017-0518-1.

Engagement of cellular prion protein with the co-chaperone Hsp70/90 organizing protein regulates the proliferation of glioblastoma stem-like cells

Affiliations

Engagement of cellular prion protein with the co-chaperone Hsp70/90 organizing protein regulates the proliferation of glioblastoma stem-like cells

Rebeca Piatniczka Iglesia et al. Stem Cell Res Ther. .

Abstract

Background: Glioblastoma (GBM), a highly aggressive brain tumor, contains a subpopulation of glioblastoma stem-like cells (GSCs) that play roles in tumor maintenance, invasion, and therapeutic resistance. GSCs are therefore a promising target for GBM treatment. Our group identified the cellular prion protein (PrPC) and its partner, the co-chaperone Hsp70/90 organizing protein (HOP), as potential target candidates due to their role in GBM tumorigenesis and in neural stem cell maintenance.

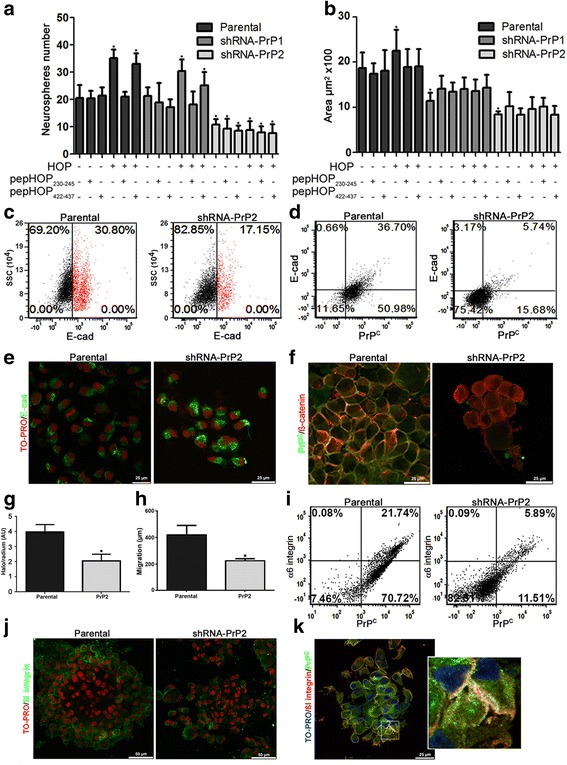
Methods: GSCs expressing different levels of PrPC were cultured as neurospheres with growth factors, and characterized with stem cells markers and adhesion molecules markers through immunofluorescence and flow cytometry. We than evaluated GSC self-renewal and proliferation by clonal density assays and BrdU incorporation, respectively, in front of recombinant HOP treatment, combined or not with a HOP peptide which mimics the PrPC binding site. Stable silencing of HOP was also performed in parental and/or PrPC-depleted cell populations, and proliferation in vitro and tumor growth in vivo were evaluated. Migration assays were performed on laminin-1 pre-coated glass.

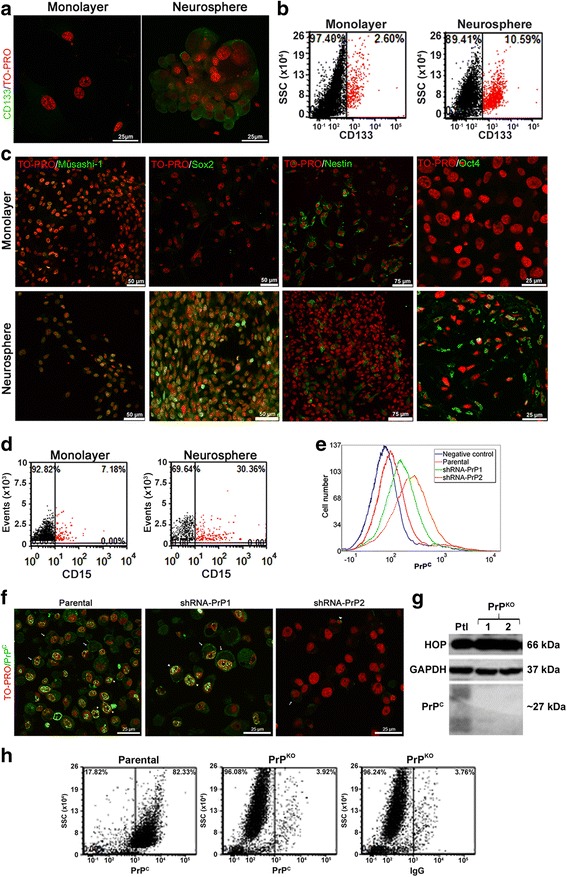
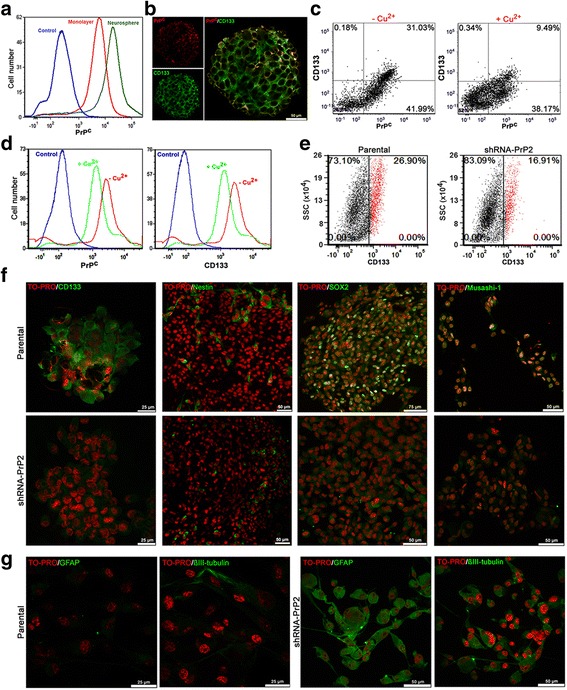
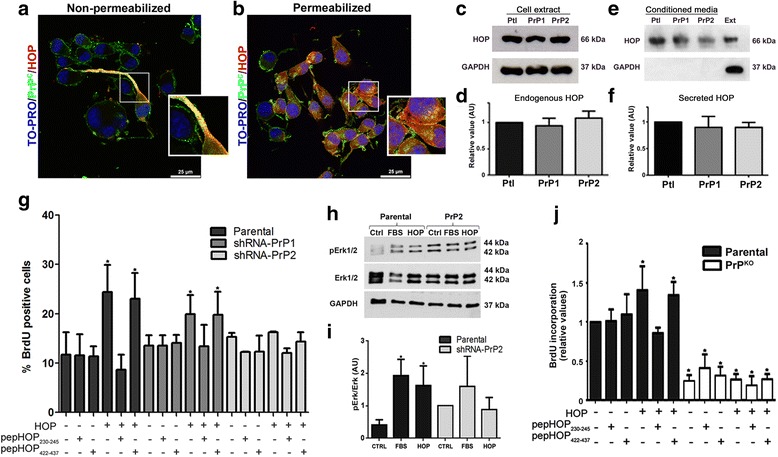
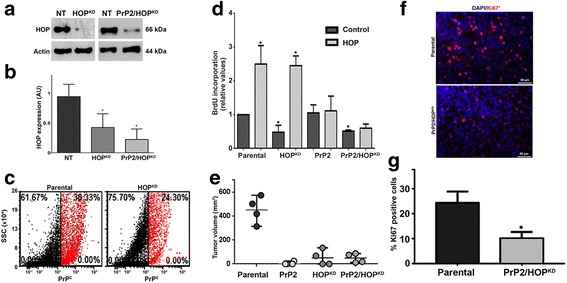
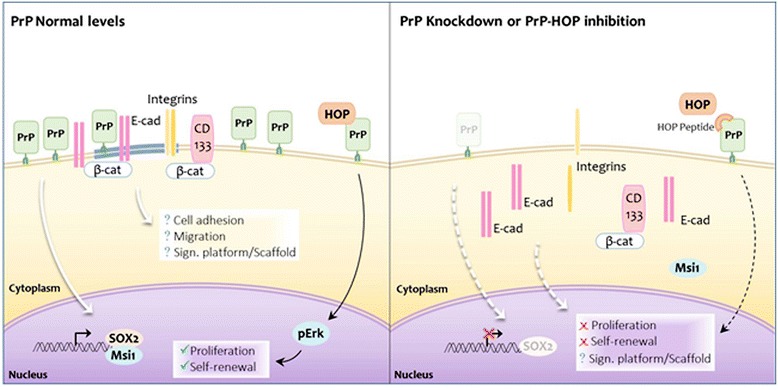
Results: We observed that, when GBM cells are cultured as neurospheres, they express specific stemness markers such as CD133, CD15, Oct4, and SOX2; PrPC is upregulated compared to monolayer culture and co-localizes with CD133. PrPC silencing downregulates the expression of molecules associated with cancer stem cells, upregulates markers of cell differentiation and affects GSC self-renewal, pointing to a pivotal role for PrPC in the maintenance of GSCs. Exogenous HOP treatment increases proliferation and self-renewal of GSCs in a PrPC-dependent manner while HOP knockdown disturbs the proliferation process. In vivo, PrPC and/or HOP knockdown potently inhibits the growth of subcutaneously implanted glioblastoma cells. In addition, disruption of the PrPC-HOP complex by a HOP peptide, which mimics the PrPC binding site, affects GSC self-renewal and proliferation indicating that the HOP-PrPC complex is required for GSC stemness. Furthermore, PrPC-depleted GSCs downregulate cell adhesion-related proteins and impair cell migration indicating a putative role for PrPC in the cell surface stability of cell adhesion molecules and GBM cell invasiveness, respectively.

Conclusions: In conclusion, our results show that the modulation of HOP-PrPC engagement or the decrease of PrPC and HOP expression may represent a potential therapeutic intervention in GBM, regulating glioblastoma stem-like cell self-renewal, proliferation, and migration.

Keywords: Cellular prion protein; Glioblastoma; Hsp70/90 organizing protein; Proliferation; Stem cells.


Figures

Fig. 1
Fig. 1
Characterization of glioblastoma U87 and U251 neurospheres. a Immunofluorescence for CD133 (green) in U87 cultured as monolayer plus serum (left) or neurospheres (right). Nuclei staining (TO-PRO) shown in red. b Dot plot for CD133 expression in monolayer cultured with serum (left) and neurospheres (right). CD133+ cells shown in red and CD133 cells in black . c Immunostaining for the stem cells markers Oct4, Musashi-1, Sox2, and Nestin (green) in monolayer (upper) and neurospheres (lower), with nuclei staining (TO-PRO) shown in red. d Dot plot graph for CD15 expression in monolayer cultured with serum (left) and as neurospheres (right). CD15+ shown in red and CD15 in black. e Cellular prion protein (PrP C) expression assessed by flow cytometry in parental (orange), shRNA-PrP1 (green), or shRNA-PrP2 (red) populations. Negative control shown in blue (only secondary antibody staining). f Immunofluorescence for PrPC (green), in parental (left), shRNA-PrP1 (middle), or shRNA-PrP2 (right) populations. Arrow indicates staining on the cell surface and arrowhead in the perinuclear region. Nuclei staining (TO-PRO) shown in red. g Immunoblot for Hsp70/90 organizing protein (HOP) (top) and PrPC (bottom) expression in U251 knockout (PrP KO) clones (1 and 2) compared to the parental (Ptl) population. GAPDH was used as the loading control. Note that the smear for PrPC immunostaining is due to the different glycosylated isoforms. h Flow cytometry for PrPC expression in the U251 populations parental (left) and U251 PrP-knockout clone 2 (PrPKO) (middle). IgG isotype (right) was used as the negative control
Fig. 2
Fig. 2
Stem cells marker expression in cellular prion protein (PrP C)-depleted neurospheres. a PrPC expression assessed by flow cytometry in parental monolayer (red) and neurosphere (green) cultures. Negative control shown in blue (only secondary antibody staining). b Immunofluorescence for PrPC (red) and CD133 (green) in parental neurospheres shows co-localization on the cell surface. c Dot plot of CD133 and PrPC expression in parental neurospheres in the absence (–Cu2+) or presence (+Cu2+) of CuSO4 250 μM. d Histogram for PrPC and CD133 in the absence (–Cu2+) and presence (+Cu2+) of CuSO4 250 μM. Negative control shown in blue (only secondary antibody staining). e Dot plot of CD133 expression in parental (left) and shRNA-PrP2 (right) neurospheres. CD133+ shown in red and CD133 shown in black. f Immunofluorescence for the stem cells markers musashi-1, nestin, Sox2, and CD133 (green) in parental (upper) and shRNA-PrP2 (lower) neurospheres. Nuclei staining (TO-PRO) shown in red. g Immunofluorescence for the cell differentiation markers GFAP and βIII-tubulin (green) in parental (left) and shRNA-PrP2 (right) neurospheres after 5 days of serum treatment. Nuclei staining (TO-PRO) shown in red
Fig. 3
Fig. 3
Hsp70/90 organizing protein (HOP) promotes proliferation of neurospheres dependent on cellular prion protein (PrP C) by activating the Erk1/2 signaling pathway. Immunofluorescence for PrPC (green) and HOP (red) in parental neurospheres shows co-localization on the cell surface in non-permeabilized cells (a) and expression of both proteins in the cytoplasm in permeabilized cells (b). Nuclei staining (TO-PRO) in shown in blue. A higher magnification field is shown in the inset. c Immunoblot for HOP in parental (Ptl), shRNA-PrP1 (PrP1), and shRNA-PrP2 (PrP2) neurospheres. GAPDH was used as the loading control. d Densitometry analysis of immunoblot; values of three independent experiments are expressed relative to control (parental). e Immunoblot of conditioned medium of parental (Ptl), shRNA-PrP1 (PrP1), and shRNA-PrP2 (PrP2) PrPC-depleted populations. Total protein extract (Ext). GAPDH immunodetection was used as cell lysis control. f Densitometry analysis of immunoblot; values of three independent experiments are expressed relative to control (parental). g U87 neurospheres treated with HOP and/or peptides pepHOP230–245 or pepHOP422–437 (1 μM), combined or alone, compared to untreated control. Percentage of BrdU-positive cells in all conditions in relation to total number of cells (n = 6, *p < 0.005). h Immunoblot of phosphorylated Erk1/2 and total Erk1/2 in parental and shRNA-PrP2 neurospheres for basal levels (Ctrl), fetal bovine serum (FBS), or recombinant HOP treatments (HOP) for 20 min. GAPDH was used as the loading control. i Densitometry of the relative values of ERK1/2 activation are represented by the ratio of p-ERK and total ERK1/2 in parental and shRNA-PrP2 neurospheres after treatment with recombinant HOP or FBS. j U251 neurospheres of parental and U251 knockout (PrP KO) populations treated with HOP and/or peptides pepHOP230–245 or pepHOP422–437 (1 μM), combined or alone, compared to untreated control. BrdU-positive cells detected by spectrophotometry (n = 4, p < 0.05, ANOVA followed by Tukey post-hoc test)
Fig. 4
Fig. 4
Cellular prion protein (PrP C) and/or Hsp70/90 organizing protein (HOP) knockdown suppresses cell proliferation and tumor growth in vivo. a Immunoblot for HOP expression in U87 non-target (NT), shRNA-HOP (HOP KD), or shRNA-PrP2/HOP (PrP2/HOP KD) populations. Actin was used as the protein loading control. b Immunoblot densitometry analysis; values of three independent experiments are expressed relative to control (parental). c Dot plot for PrPC expression of U87 parental and HOPKD populations. PrPC+ cells shown in red and PrPC– cells shown in black. d. Colorimetric BrdU incorporation assay in U87 parental, HOPKD, PrP2, or PrP2/HOPKD populations. Values of four independent experiments are expressed relative to control (parental). *p < 0.05, ANOVA followed by Tukey post-hoc test. e U87 neurospheres cells from parental, PrP2, HOPKD, or PrP2/HOPKD populations (1 × 106 cells) were implanted into the flank of nude mice and the tumor growth was monitored daily. Data represent tumor volume on day 10 after tumor detection (n = 4, *p < 0.05, ANOVA followed by Tukey post-hoc test). f Tumors were resected, fixed, paraffin embedded, and immunostained for Ki67. Representative images of Ki67 labeling (red) and DAPI (nuclei, blue). g Values represent the percentage of Ki67-positive cells relative to total number of cells (nuclei, DAPI staining)
Fig. 5
Fig. 5
Cellular prion protein (PrP C) promotes GSC self-renewal binding HOP and modulates cell surface adhesion molecule stability. Neurosphere number (a) or size (b) after 1 week treatment every 48 h with Hsp70/90 organizing protein (HOP) and peptides pepHOP230–245 and pepHOP422–437 (1 μM), combined or alone (500nM), compared to control (n = 6, *p < 0.05, ANOVA followed by Tukey post-hoc test). c Dot plot of E-cadherin expression in parental and shRNA-PrP2 neurospheres. E-cad+ cells shown in red and E-cad cells shown in black. d Dot plot of E-cadherin and PrPC expression in parental and shRNA-PrP2 neurospheres. e Immunofluorescence for E-cadherin (green) in parental and shRNA-PrP2 neurospheres, showing expression on the cell surface (parental) and in the perinuclear region (shRNA-PrP2). Nuclei (TO-Pro) stain shown in red. f PrPC (green) and β-catenin (red) expression and co-localization (yellow) of parental and shRNA-PrP2 neurospheres. g Migration assay, ratio between cell migration distance (halo), and neurosphere size for parental and shRNA-PrP2 neurospheres 24 h after plating on laminin-1 (n = 3, *p < 0.05). h Cell scratch assay; images of three experimental replicates were acquired and the distance of each scratch closure after 24 h was measured by comparing with the images at time 0 h for parental and shRNA-PrP2 neurospheres plated on laminin-1 (n = 4, *p < 0.05). i Dot plot of α6 integrin and PrPC expression in parental and shRNA-PrP2 neurospheres. j Immunofluorescence for β1 integrin (green) of parental and shRNA-PrP2 neurospheres. Nuclei (TO-PRO) stain shown in red. k. PrPC (green) and β1 integrin (red) expression and co-localization (yellow) of parental and shRNA-PrP2 neurospheres. Nuclei (TO-PRO) stain shown in blue; a higher magnification is shown in the inset
Fig. 6
Fig. 6
Model of prion protein (PrP) as a scaffold protein modulating GSC biology. Scheme illustrating how PrPC may act as a scaffold protein, regulating stemness (dowregulation of CD133 and Sox2 and Msi1 sub-localization altered), recruiting cell adhesion molecules (E-cadherin and integrin α6β1), binding CD133-β-catenin to the plasma membrane, and modulating GSC proliferation and self-renewal through its interaction with Hsp70/90 organizing protein (HOP). Blockage of PrPC-HOP interaction with HOP peptide impairs the binding of HOP and PrPC and, consequently, Erk1/2 activation, affecting proliferation

Similar articles

Cited by

References

    1. Ellis HP, Greenslade M, Powell B, Spiteri I, Sottoriva A, Kurian KM. Current challenges in glioblastoma: intratumour heterogeneity, residual disease, and models to predict disease recurrence. Front Oncol. 2015;5:251. doi: 10.3389/fonc.2015.00251. - DOI - PMC - PubMed
    1. Lathia JD, Mack SC, Mulkearns-Hubert EE, Valentim CL, Rich JN. Cancer stem cells in glioblastoma. Genes Dev. 2015;29:1203–17. doi: 10.1101/gad.261982.115. - DOI - PMC - PubMed
    1. Persano L, Rampazzo E, Basso G, Viola G. Glioblastoma cancer stem cells: role of the microenvironment and therapeutic targeting. Biochem Pharmacol. 2013;85:612–22. doi: 10.1016/j.bcp.2012.10.001. - DOI - PubMed
    1. Bao S, Wu Q, Sathornsumetee S, Hao Y, Li Z, Hjelmeland AB, et al. Stem cell-like glioma cells promote tumor angiogenesis through vascular endothelial growth factor. Cancer Res. 2006;66:7843–8. doi: 10.1158/0008-5472.CAN-06-1010. - DOI - PubMed
    1. Florio T, Barbieri F. The status of the art of human malignant glioma management: the promising role of targeting tumor-initiating cells. Drug Discov Today. 2012;17:1103–10. doi: 10.1016/j.drudis.2012.06.001. - DOI - PubMed

Publication types