. 2017 Feb:67:153-174.
doi: 10.1016/j.foodpol.2016.09.018.

Are African households (not) leaving agriculture? Patterns of households' income sources in rural Sub-Saharan Africa

Affiliations

Are African households (not) leaving agriculture? Patterns of households' income sources in rural Sub-Saharan Africa

Benjamin Davis et al. Food Policy. 2017 Feb.

Abstract

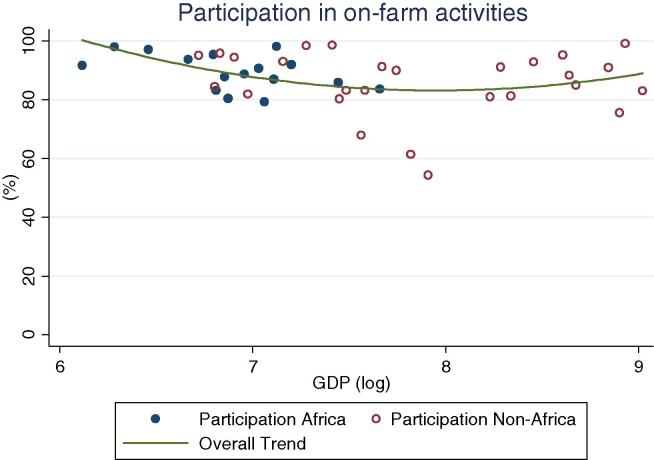
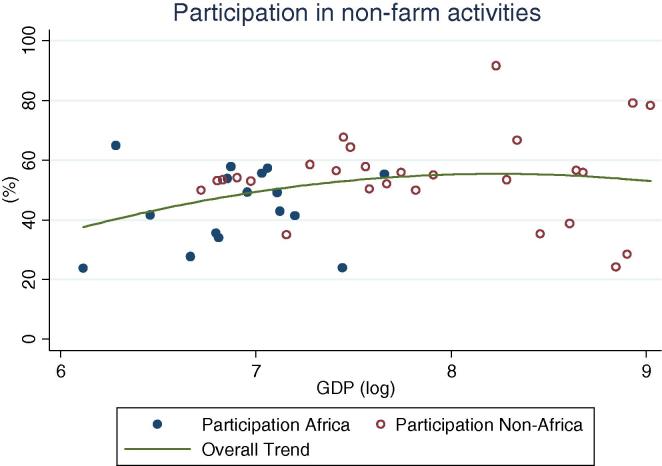
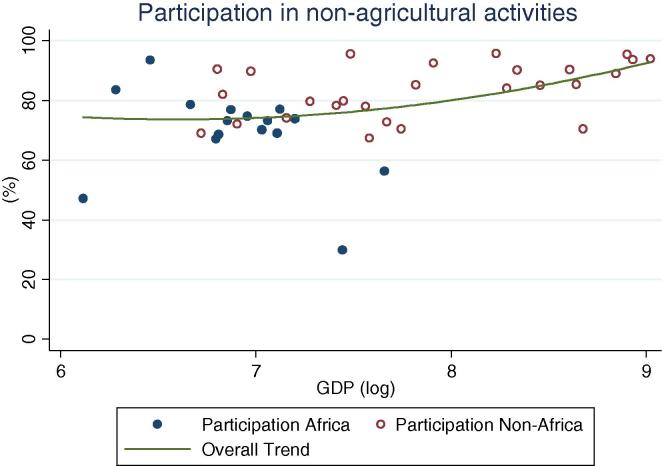
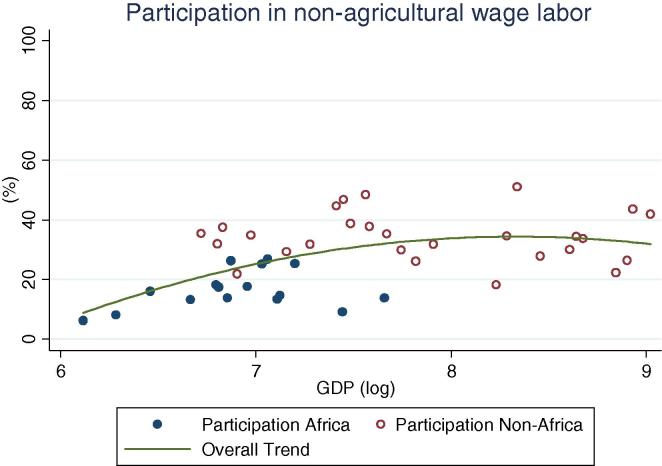
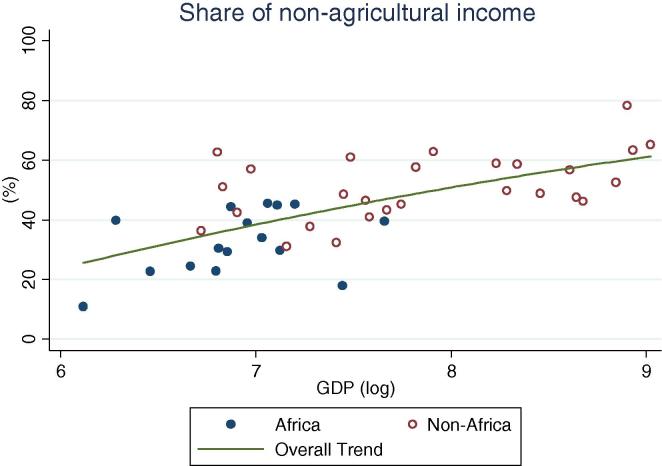
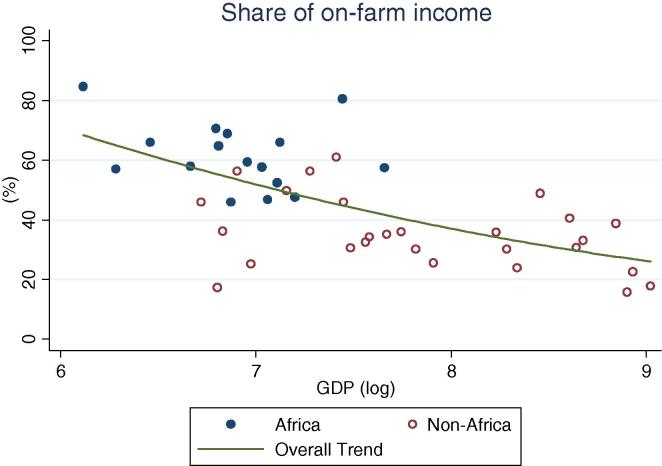
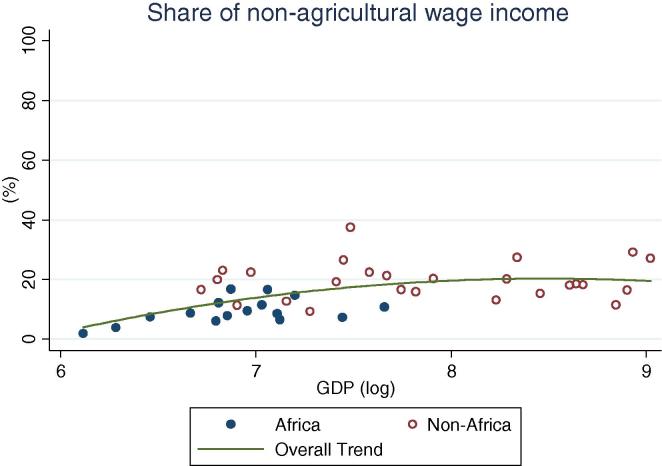
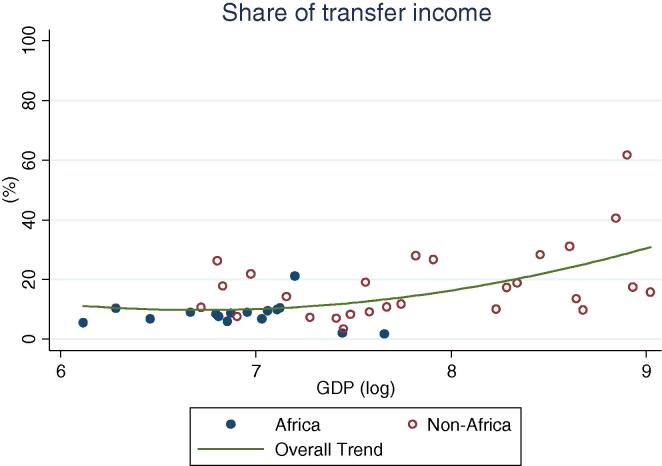
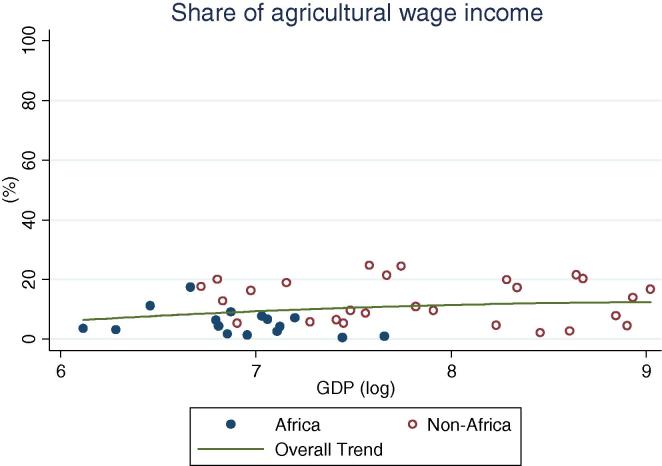
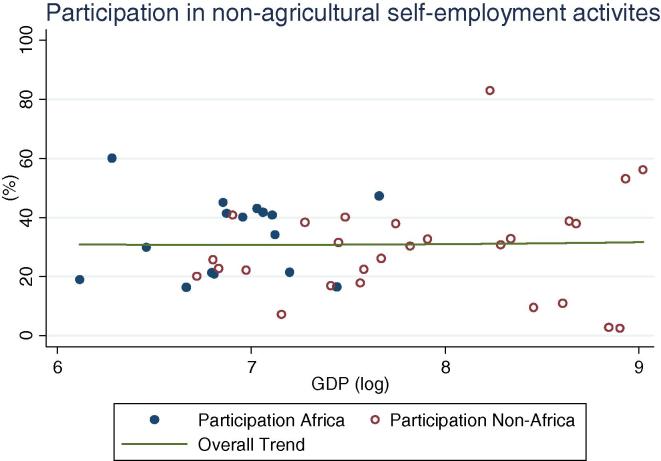
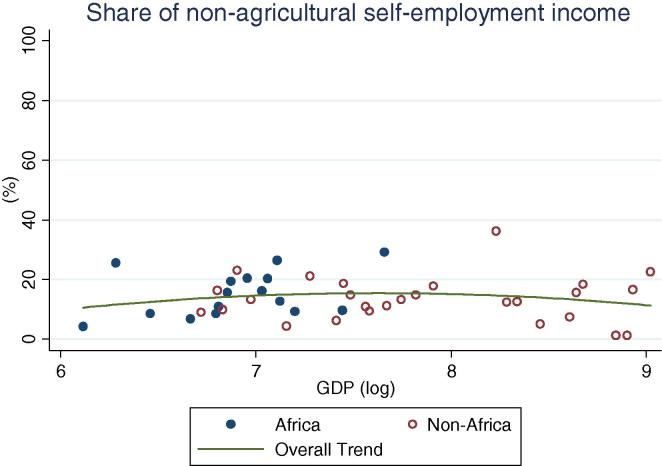
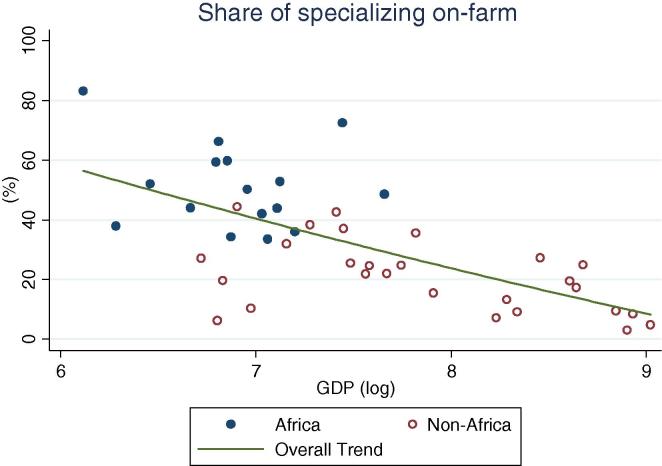
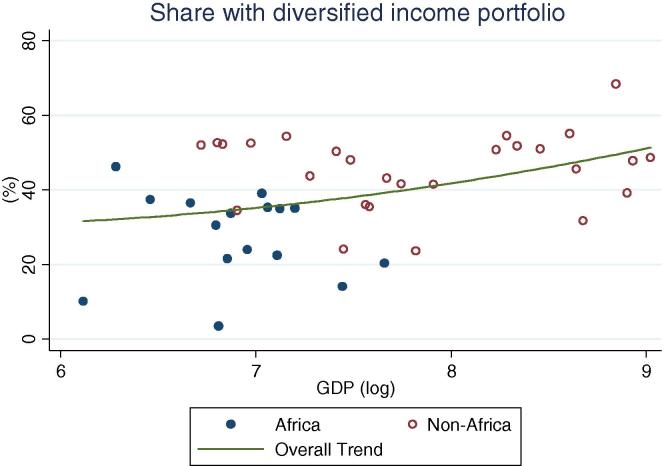
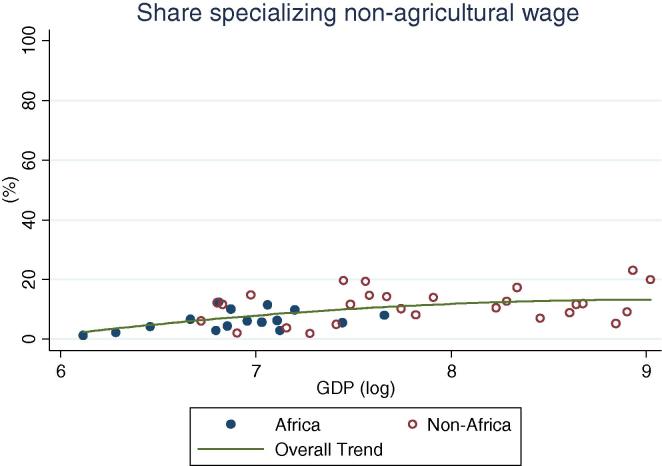
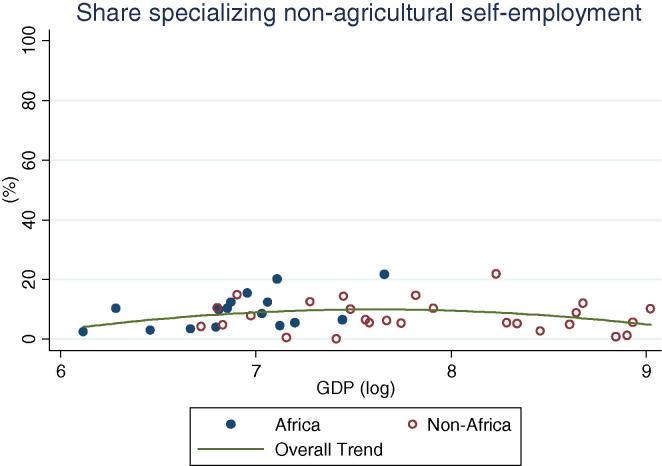
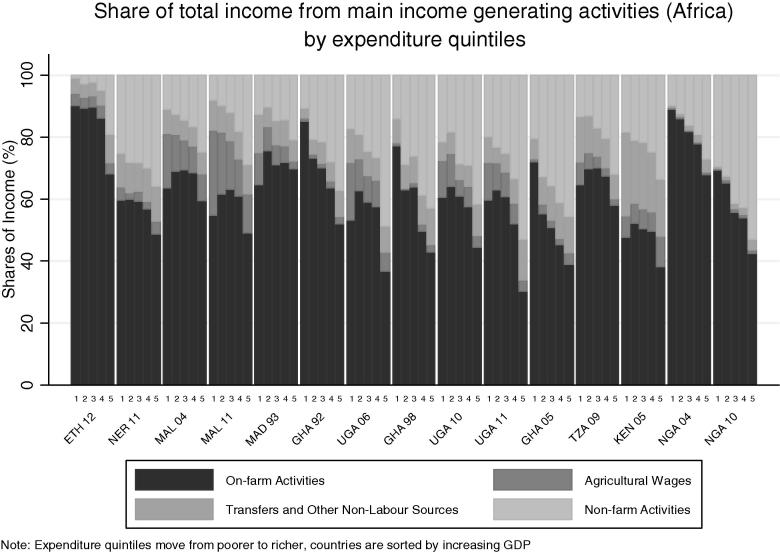
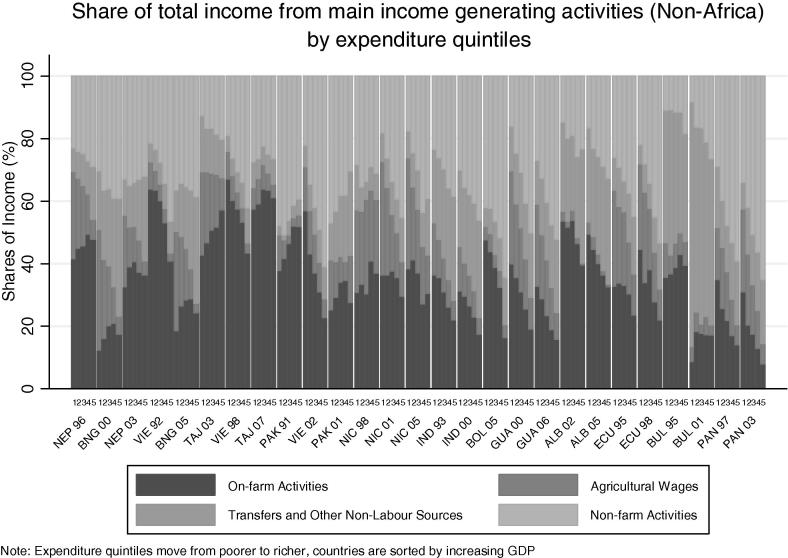
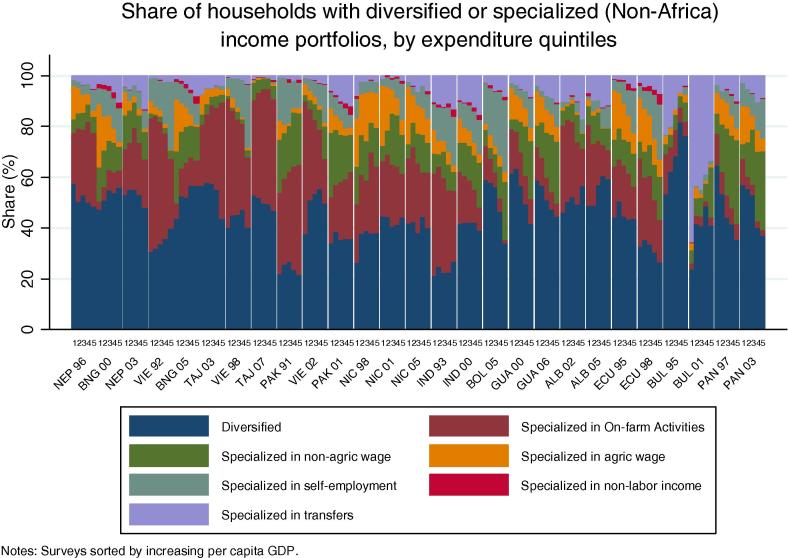
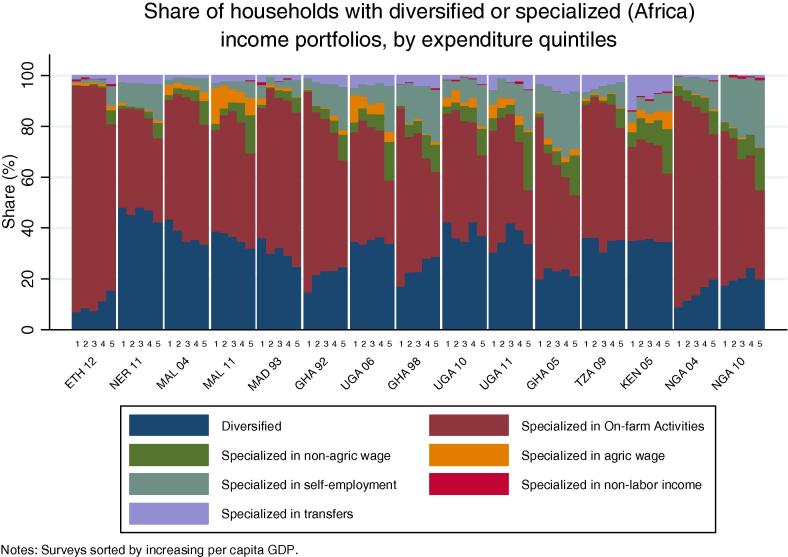
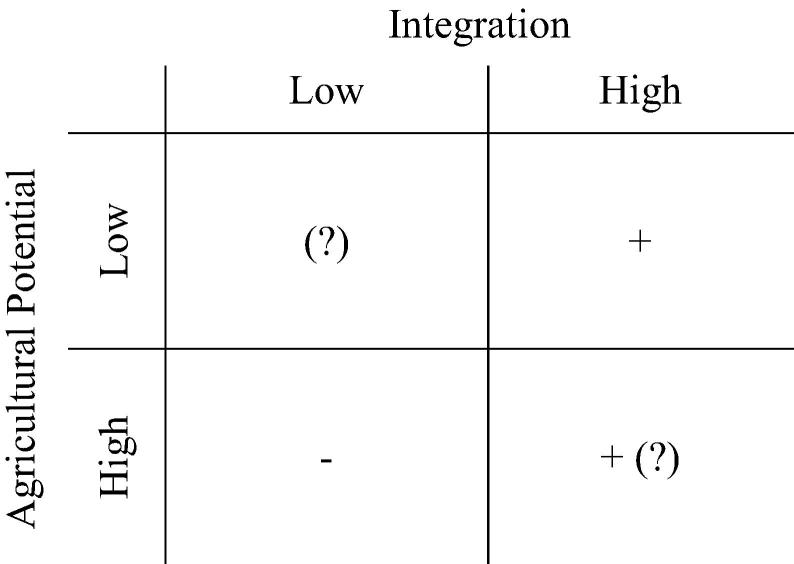
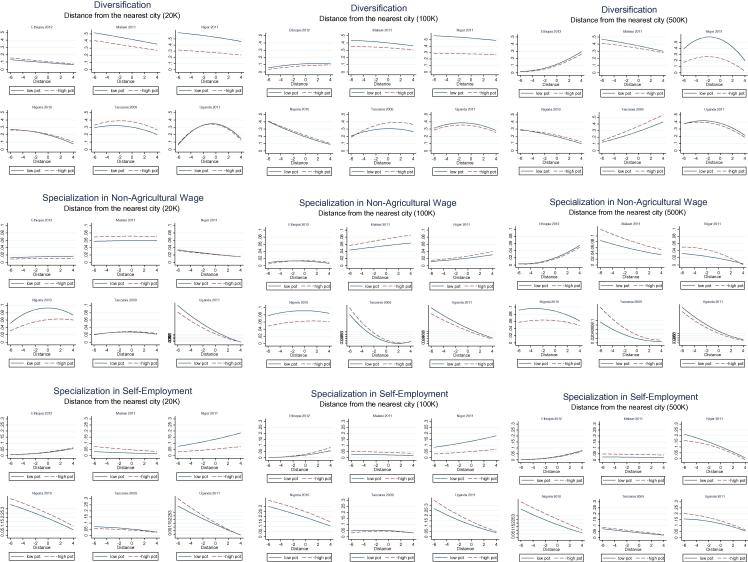
This paper uses comparable income aggregates from 41 national household surveys from 22 countries to explore the patterns of income generation among rural households in Sub-Saharan Africa, and to compare household income strategies in Sub-Saharan Africa with those in other regions. The paper seeks to understand how geography drives these strategies, focusing on the role of agricultural potential and distance to urban areas. Specialization in on-farm activities continues to be the norm in rural Africa, practiced by 52 percent of households (as opposed to 21 percent of households in other regions). Regardless of distance and integration in the urban context, when agro-climatic conditions are favorable, farming remains the occupation of choice for most households in the African countries for which the study has geographically explicit information. However, the paper finds no evidence that African households are on a different trajectory than households in other regions in terms of transitioning to non-agricultural based income strategies.

Keywords: Africa; Agriculture; Income; LSMS; Non-farm employment.


Figures

Fig. 1
Fig. 1
Percentage of rural households participating in on farm activities, by per capita GDP in 2005 PPP dollars.
Fig. 2
Fig. 2
Percentage of rural households participating in non-farm activities, by per capita GDP in 2005 PPP dollars.
Fig. 3
Fig. 3
Percentage of rural households participating in non-agricultural activities, by per capita GDP in 2005 PPP dollars.
Fig. 4
Fig. 4
Percentage of rural households participating in non-agricultural wage labor, by per capita GDP in 2005 PPP dollars.
Fig. 5
Fig. 5
Share of rural households’ non-agricultural income, by per capita GDP in 2005 PPP dollars.
Fig. 6
Fig. 6
Share of rural households’ on farm income, by per capita GDP in 2005 PPP dollars.
Fig. 7
Fig. 7
Share of rural households’ non-agricultural wage income, by per capita GDP in 2005 PPP dollars.
Fig. 8
Fig. 8
Share of rural households’ transfer income, by per capita GDP in 2005 PPP dollars.
Fig. 9
Fig. 9
Share of rural households’ agricultural wage income, by per capita GDP in 2005 PPP dollars.
Fig. 10
Fig. 10
Percentage of rural households participating in no-agricultural self-employment activities, by per capita GDP in 2005 PPP dollars.
Fig. 11
Fig. 11
Share of rural households’ non-agricultural self-employment income, by per capita GDP in 2005 PPP dollars.
Fig. 12
Fig. 12
Share of rural households specializing on farm, by per capita GDP in 2005 PPP dollars.
Fig. 13
Fig. 13
Share of rural households with diversified income portfolio, by per capita GDP in 2005 PPP dollars.
Fig. 14
Fig. 14
Share of rural households specializing in non-agricultural wage, by per capita GDP in 2005 PPP dollars.
Fig. 15
Fig. 15
Share of rural households specializing in non-agricultural self-employment, by per capita GDP in 2005 PPP dollars.
Fig. 16a
Fig. 16a
Share of total income from main income generating activities (Africa) by expenditure quintiles.
Fig. 16b
Fig. 16b
Share of total income from main income generating activities (non-Africa) by expenditure quintiles.
Fig. 17a
Fig. 17a
Share of households with diversified or specialized income portfolios, by expenditure quintiles (Non-Africa).
Fig. 17b
Fig. 17b
Share of households with diversified or specialized income portfolios, by expenditure quintiles (Africa).
Fig. 18
Fig. 18
Cumulative per capita expenditure distributions, by income-generating strategy.
Fig. 19
Fig. 19
Matrix of expected relationship between specialization in non-agricultural activities, agricultural potential, and integration into urban areas.
Fig. 20
Fig. 20
Multinomial logit results: The effect of distance on income strategies, by agricultural potential (aridity) – Base category: Farm specialization.

References

    1. Azzarri C., Carletto C., Davis B., Fatchi T., Vigneri M. Background Paper Prepared for the World Bank Malawi Poverty and Vulnerability Assessment. FAO; Rome: 2006. Food and nutrition security in Malawi.
    1. Barrett C., Reardon T., Webb P. Nonfarm income diversification and household livelihood strategies in Rural Africa: concepts, dynamics and policy implications. Food Policy. 2001;26(4)
    1. Bezu S., Barrett C. Employment dynamics in the rural nonfarm sector in Ethiopia: do the poor have time on their side? J. Develop. Stud. 2012;48(9):1223–1240.
    1. Bezu S., Barrett C., Holden S. Does nonfarm economy offer pathways for upward mobility? World Develop. 2012;40(8):1634–1646.
    1. Binswanger-Mkhize H.P., McCalla A.F., Patel P. Structural transformation and African agriculture. Global J. Emerg. Market Econ. 2010;2:113–152.

LinkOut - more resources