

Links between DNA methylation and nucleosome occupancy in the human genome
- PMID: 28413449
- PMCID: PMC5387343
- DOI: 10.1186/s13072-017-0125-5
Links between DNA methylation and nucleosome occupancy in the human genome
Abstract
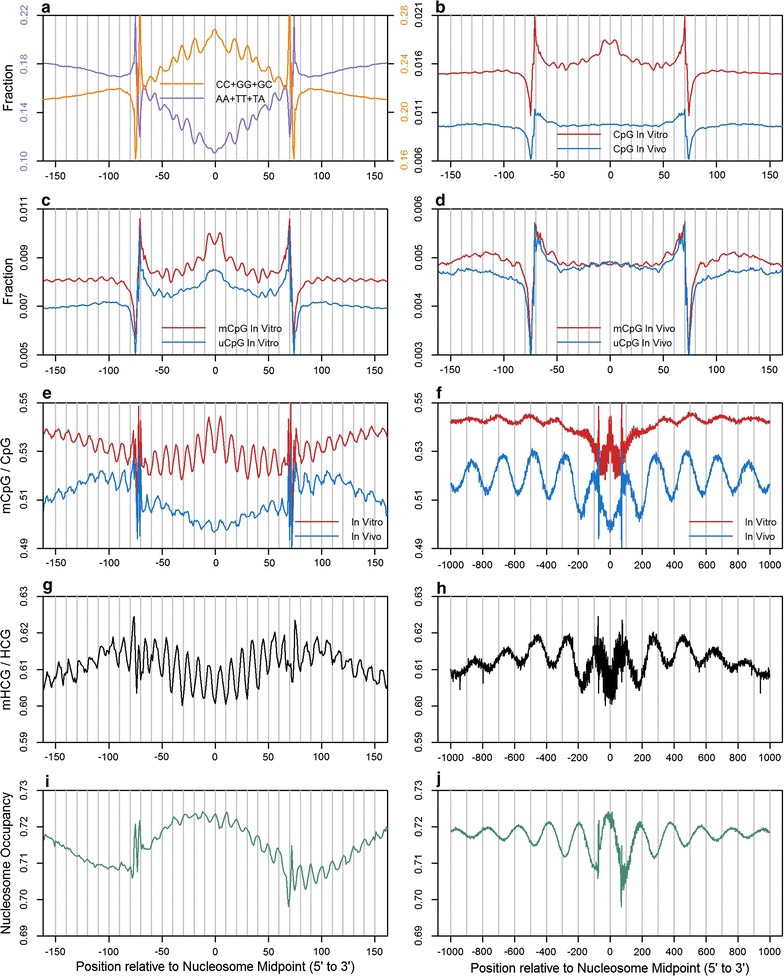
Background: DNA methylation is an epigenetic modification that is enriched in heterochromatin but depleted at active promoters and enhancers. However, the debate on whether or not DNA methylation is a reliable indicator of high nucleosome occupancy has not been settled. For example, the methylation levels of DNA flanking CTCF sites are higher in linker DNA than in nucleosomal DNA, while other studies have shown that the nucleosome core is the preferred site of methylation. In this study, we make progress toward understanding these conflicting phenomena by implementing a bioinformatics approach that combines MNase-seq and NOMe-seq data and by comprehensively profiling DNA methylation and nucleosome occupancy throughout the human genome.
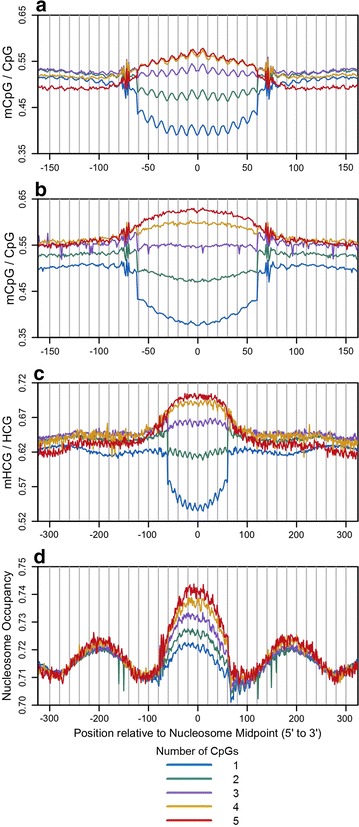
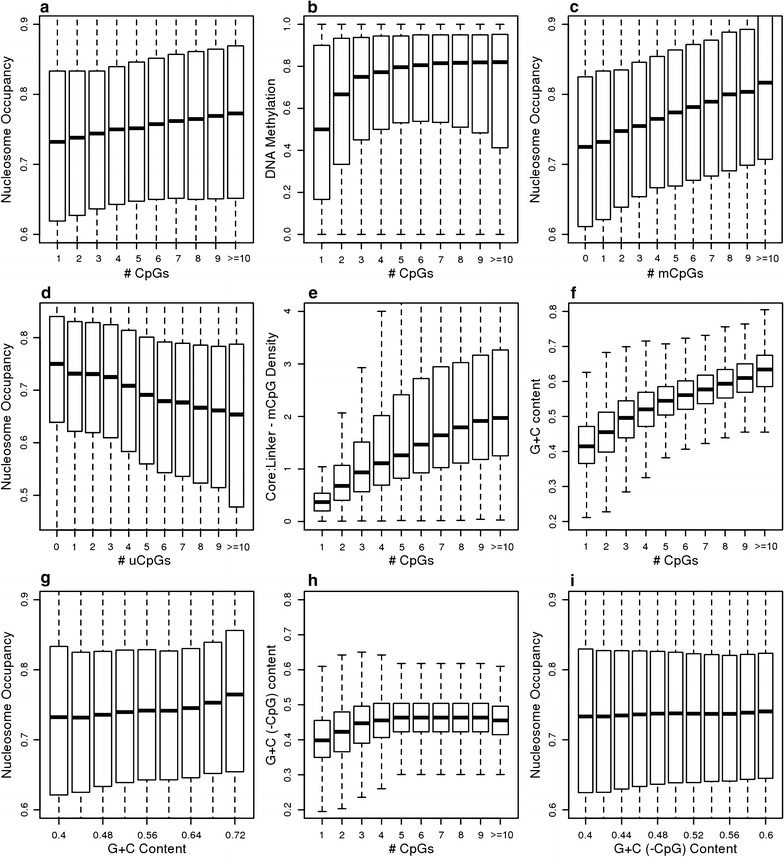
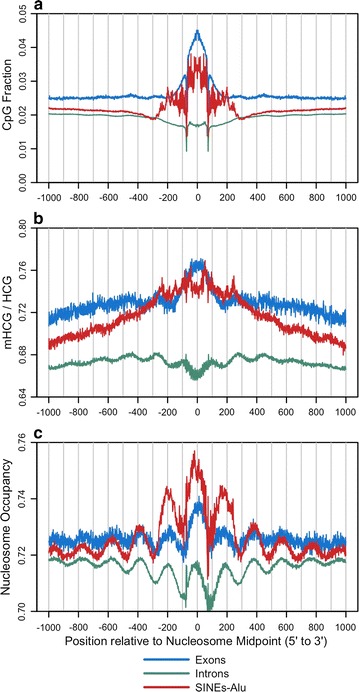
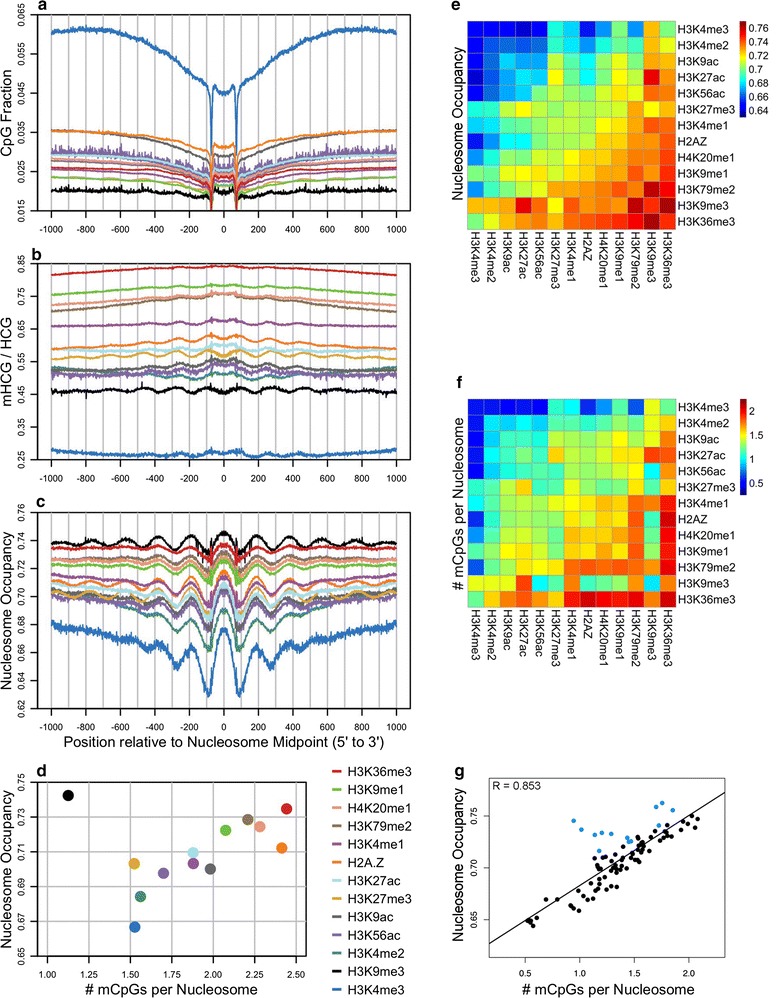
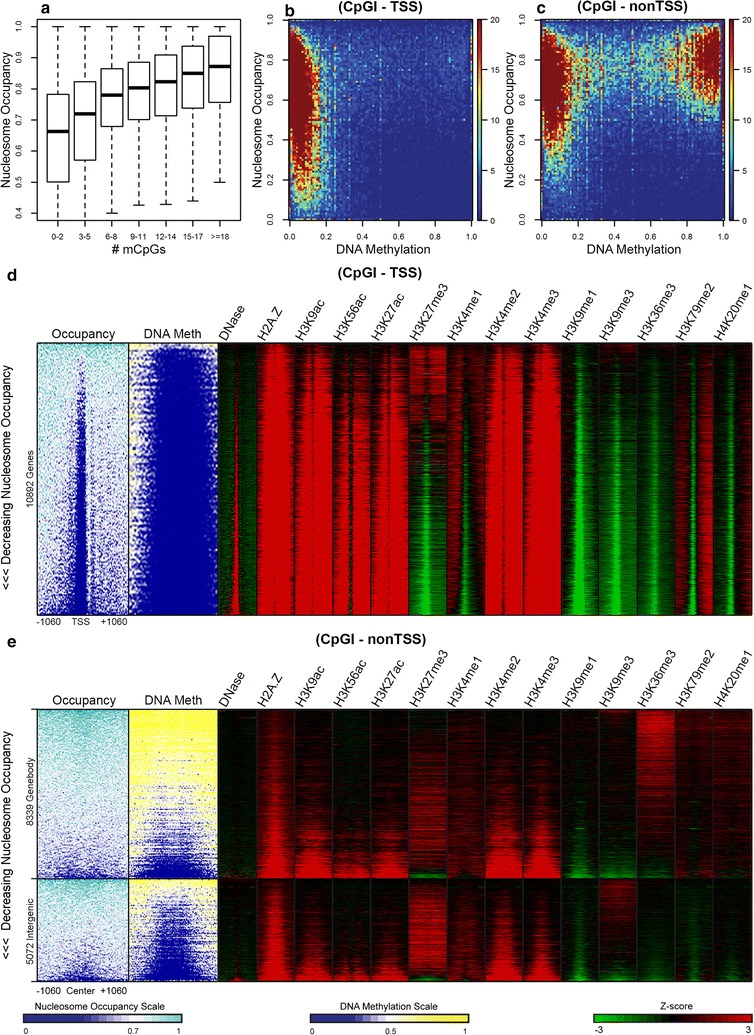
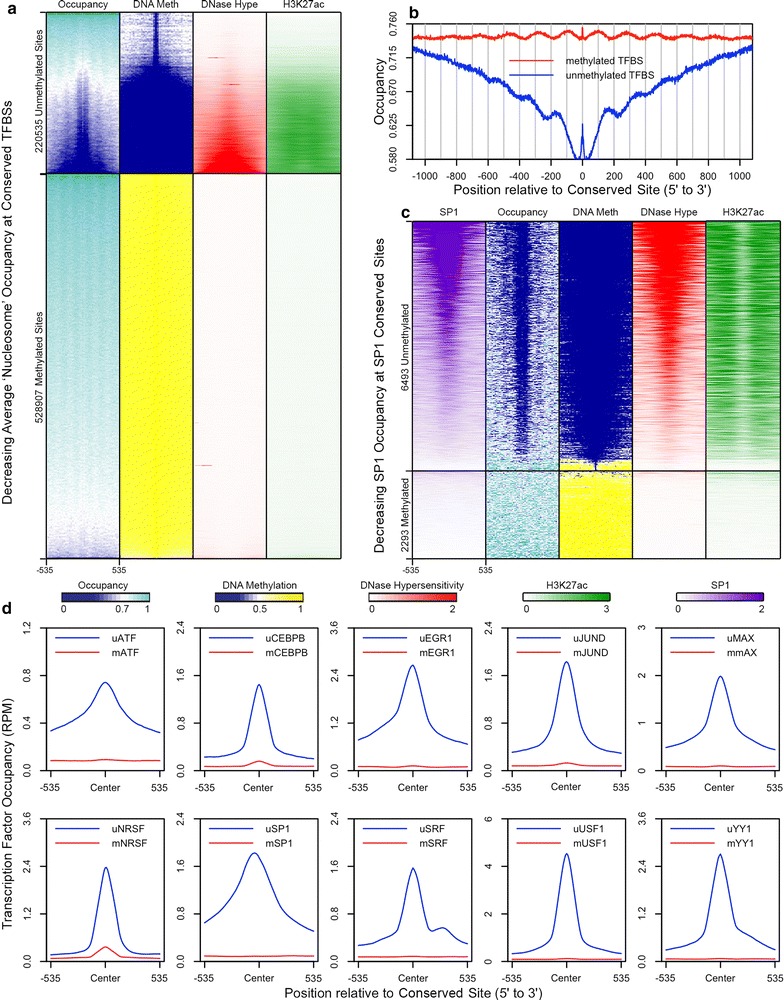
Results: The results demonstrated that increasing methylated CpG density is correlated with nucleosome occupancy in the total genome and within nearly all subgenomic regions. Features with elevated methylated CpG density such as exons, SINE-Alu sequences, H3K36-trimethylated peaks, and methylated CpG islands are among the highest nucleosome occupied elements in the genome, while some of the lowest occupancies are displayed by unmethylated CpG islands and unmethylated transcription factor binding sites. Additionally, outside of CpG islands, the density of CpGs within nucleosomes was shown to be important for the nucleosomal location of DNA methylation with low CpG frequencies favoring linker methylation and high CpG frequencies favoring core particle methylation. Prominent exceptions to the correlations between methylated CpG density and nucleosome occupancy include CpG islands marked by H3K27me3 and CpG-poor heterochromatin marked by H3K9me3, and these modifications, along with DNA methylation, distinguish the major silencing mechanisms of the human epigenome.
Conclusions: Thus, the relationship between DNA methylation and nucleosome occupancy is influenced by the density of methylated CpG dinucleotides and by other epigenomic components in chromatin.
Keywords: CpG; DNA methylation; Epigenetics; MNase-seq; NOMe-seq; Nucleosome.
Figures
Similar articles
-
Defining Regulatory Elements in the Human Genome Using Nucleosome Occupancy and Methylome Sequencing (NOMe-Seq).Methods Mol Biol. 2018;1766:209-229. doi: 10.1007/978-1-4939-7768-0_12. Methods Mol Biol. 2018. PMID: 29605855 Free PMC article.
-
DNA methylation directly silences genes with non-CpG island promoters and establishes a nucleosome occupied promoter.Hum Mol Genet. 2011 Nov 15;20(22):4299-310. doi: 10.1093/hmg/ddr356. Epub 2011 Aug 11. Hum Mol Genet. 2011. PMID: 21835883 Free PMC article.
-
Contrasting chromatin organization of CpG islands and exons in the human genome.Genome Biol. 2010;11(7):R70. doi: 10.1186/gb-2010-11-7-r70. Epub 2010 Jul 5. Genome Biol. 2010. PMID: 20602769 Free PMC article.
-
DNA methylation, nucleosome formation and positioning.Brief Funct Genomic Proteomic. 2005 Feb;3(4):351-61. doi: 10.1093/bfgp/3.4.351. Brief Funct Genomic Proteomic. 2005. PMID: 15814025 Review.
-
Mechanisms of Inheritance of Chromatin States: From Yeast to Human.Annu Rev Biophys. 2025 May;54(1):59-79. doi: 10.1146/annurev-biophys-070524-091904. Epub 2024 Dec 23. Annu Rev Biophys. 2025. PMID: 39715046 Review.
Cited by
-
Spatiotemporal specificity of correlated DNA methylation and gene expression pairs across different human tissues and stages of brain development.Epigenetics. 2022 Oct;17(10):1110-1127. doi: 10.1080/15592294.2021.1993607. Epub 2021 Oct 21. Epigenetics. 2022. PMID: 34652256 Free PMC article.
-
Exploring the Link between Nucleosome Occupancy and DNA Methylation.Front Genet. 2018 Jan 12;8:232. doi: 10.3389/fgene.2017.00232. eCollection 2017. Front Genet. 2018. PMID: 29379519 Free PMC article.
-
Impact of DNA methylation on 3D genome structure.Nat Commun. 2021 May 28;12(1):3243. doi: 10.1038/s41467-021-23142-8. Nat Commun. 2021. PMID: 34050148 Free PMC article.
-
Slow nucleosome dynamics set the transcriptional speed limit and induce RNA polymerase II traffic jams and bursts.PLoS Comput Biol. 2022 Feb 10;18(2):e1009811. doi: 10.1371/journal.pcbi.1009811. eCollection 2022 Feb. PLoS Comput Biol. 2022. PMID: 35143483 Free PMC article.
-
Tissue and cancer-specific expression of DIEXF is epigenetically mediated by an Alu repeat.Epigenetics. 2020 Jun-Jul;15(6-7):765-779. doi: 10.1080/15592294.2020.1722398. Epub 2020 Feb 11. Epigenetics. 2020. PMID: 32041475 Free PMC article.
References
Publication types
MeSH terms
Substances
LinkOut - more resources
Full Text Sources
Other Literature Sources
