. 2017 Feb 27:6:192.
doi: 10.12688/f1000research.10767.3. eCollection 2017.

Automated Wormscan

Affiliations

Automated Wormscan

Timothy Puckering et al. F1000Res. .

Abstract

There has been a recent surge of interest in computer-aided rapid data acquisition to increase the potential throughput and reduce the labour costs of large scale Caenorhabditis elegans studies. We present Automated WormScan, a low-cost, high-throughput automated system using commercial photo scanners, which is extremely easy to implement and use, capable of scoring tens of thousands of organisms per hour with minimal operator input, and is scalable. The method does not rely on software training for image recognition, but uses the generation of difference images from sequential scans to identify moving objects. This approach results in robust identification of worms with little computational demand. We demonstrate the utility of the system by conducting toxicity, growth and fecundity assays, which demonstrate the consistency of our automated system, the quality of the data relative to manual scoring methods and congruity with previously published results.

Keywords: Caenorhabditis elegans; WormScan; phosphine; software; toxicology.


Conflict of interest statement

No competing interests were disclosed.

Figures
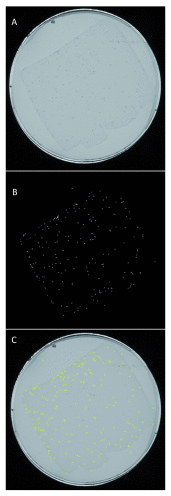
Figure 1.
Figure 1.. Movement based identification of Caenorhabditis elegans based on pixel intensity difference between two successive scans of an agar petri dish.
( A) A high-resolution scan of a petri dish containing a population of approximately 100 early L4 stage C. elegans individuals. ( B) A difference image produced from a pixel-by-pixel comparison with a second image taken of the same plate ten minutes later. White regions correspond to a worm that moved from its original location during this time. ( C) Regions of interest from the difference image that have worm-like size and shape attributes are identified. Archival images are created with an outline of identified worm-like objects overlaid on the original images.
Figure 2.
Figure 2.. Example data-processing spreadsheet.
A count of live worms from every scanned petri plate is extracted from the output of the FIJI plugin and is associated with its scan number and plate position. Researchers then manually enter experimental parameters to automatically fill the 3x4 grids with presumed plate labels by an auto-completion function. If the design of an experiment does not fit this default model, the labels can be inserted manually. The end result is a single table of raw data from the entire collection of images that can easily be tracked back to the archived images.
Figure 3.
Figure 3.. Comparison of worm counts produced by three different human observers vs three independent scans.
Variability in numbers of individual worms counted by Automated Wormscan on the same plate is not significantly different from the variation in counts between three independent human observers using traditional methods. Error bars indicate standard deviation over three independent counts.
Figure 4.
Figure 4.. Phosphine mortality curves of wild type and resistant strains of Caenorhabditis elegans.
Automated Wormscan accurately duplicates previously published phosphine toxicology results. Wild type worms (N2) display an LC 50 of ~400ppm, while the phosphine resistant mutant dld-1(wr4) display an LC 50 of ~1800ppm, congruous with recently published results . Error bars indicate standard deviation over three experimental replicates.
Figure 5.
Figure 5.. Growth rate of daf-2 worms compared with wild type.
Length was calculated as ½ of the perimeter measurement determined by Automated WormScan. Error bars represent standard deviation over three experimental replicates.
Figure 6.
Figure 6.. Reduced fecundity at 90 hours of daf-2 worms compared to wild type.
Fecundity is expressed as juvenile-sized objects (<0.5mm perimeter) per adult-sized object (>1.5mm perimeter) as counted by WormScan. Error bars represent standard deviation over three experimental replicates (>600 juvenile individuals scored).

References

    1. Mathew MD, Mathew ND, Ebert PR: WormScan: a technique for high-throughput phenotypic analysis of Caenorhabditis elegans.Lehner B, editor. PLoS One.Public Library of Science;2012;7(3):e33483. 10.1371/journal.pone.0033483 - DOI - PMC - PubMed
    1. Stroustrup N, Ulmschneider BE, Nash ZM, et al. : The Caenorhabditis elegans Lifespan Machine. Nat Methods.Nature Publishing Group, a division of Macmillan Publishers Limited. All Rights Reserved.;2013;10(7):665–70. 10.1038/nmeth.2475 - DOI - PMC - PubMed
    1. Thompson O, Edgley M, Strasbourger P, et al. : The million mutation project: a new approach to genetics in Caenorhabditis elegans. Genome Res. 2013;23(10):1749–62. 10.1101/gr.157651.113 - DOI - PMC - PubMed
    1. Kamath RS, Fraser AG, Dong Y, et al. : Systematic functional analysis of the Caenorhabditis elegans genome using RNAi. Nature. 2003;421(6920):231–7. 10.1038/nature01278 - DOI - PubMed
    1. Zhou KI, Pincus Z, Slack FJ: Longevity and stress in Caenorhabditis elegans. Aging (Albany NY). 2011;3(8):733–53. 10.18632/aging.100367 - DOI - PMC - PubMed

LinkOut - more resources