. 2016:2:16015.
doi: 10.1038/npjsba.2016.15. Epub 2016 Aug 4.

L1000CDS2: LINCS L1000 characteristic direction signatures search engine

Affiliations

L1000CDS2: LINCS L1000 characteristic direction signatures search engine

Qiaonan Duan et al. NPJ Syst Biol Appl. 2016.

Abstract

The library of integrated network-based cellular signatures (LINCS) L1000 data set currently comprises of over a million gene expression profiles of chemically perturbed human cell lines. Through unique several intrinsic and extrinsic benchmarking schemes, we demonstrate that processing the L1000 data with the characteristic direction (CD) method significantly improves signal to noise compared with the MODZ method currently used to compute L1000 signatures. The CD processed L1000 signatures are served through a state-of-the-art web-based search engine application called L1000CDS2. The L1000CDS2 search engine provides prioritization of thousands of small-molecule signatures, and their pairwise combinations, predicted to either mimic or reverse an input gene expression signature using two methods. The L1000CDS2 search engine also predicts drug targets for all the small molecules profiled by the L1000 assay that we processed. Targets are predicted by computing the cosine similarity between the L1000 small-molecule signatures and a large collection of signatures extracted from the gene expression omnibus (GEO) for single-gene perturbations in mammalian cells. We applied L1000CDS2 to prioritize small molecules that are predicted to reverse expression in 670 disease signatures also extracted from GEO, and prioritized small molecules that can mimic expression of 22 endogenous ligand signatures profiled by the L1000 assay. As a case study, to further demonstrate the utility of L1000CDS2, we collected expression signatures from human cells infected with Ebola virus at 30, 60 and 120 min. Querying these signatures with L1000CDS2 we identified kenpaullone, a GSK3B/CDK2 inhibitor that we show, in subsequent experiments, has a dose-dependent efficacy in inhibiting Ebola infection in vitro without causing cellular toxicity in human cell lines. In summary, the L1000CDS2 tool can be applied in many biological and biomedical settings, while improving the extraction of knowledge from the LINCS L1000 resource.


Conflict of interest statement

COMPETING INTERESTS The authors declare no conflict of interest.

Figures

Figure 1
Figure 1
Intrinsic benchmarking. Expression signatures for each small molecule are computed with the Characteristic Direction (CD) algorithm or downloaded from lincscloud.org. The signatures on lincscloud are computed using the Moderated Z-score (MODZ) method. (a, b) Histograms of the significance scores for the 8,301 signatures from the LJP5 and LJP6 batches. (c) Correlation between the strength metrics for signatures computed by the two methods. (d) Correlation between differential expression significance rank and dose rank using the two methods of computing differential expression. (e) Correlation between differential expression significance rank and dose rank using the two methods of computing differential expression without the influence of insignificant perturbations.
Figure 2
Figure 2
Extrinsic benchmarking. (a) ROC curves showing the recovery of structurally similar small-molecule compounds compared with gene expression signature similarities in A549 cells after 24 h treatment with 10 μM of all compounds computed using the two different methods: the cosine distance between Characteristic Direction (CD) signatures in blue, and the Euclidean distance of the Modulated Z-score (MODZ) signatures in orange, and cosine distance of MODZ signatures in green. Chemical fingerprints similarities used to benchmark the gene expression signature similarity are MACCS and ECFP4, plotted in solid and dashed curves, respectively. (b) The deviation from the cumulative distribution of a uniform for the rankings of drug targets and their direct interactors in gene expression signatures computed using CD (blue) and MODZ (orange) under the same conditions. (c) Recovery of known drug targets by observing the ranks of gene expression signatures extracted from GEO (n=2206) where 917 genes were perturbed by either knocked-down, knocked out, or over-expressed in mammalian cells. GEO signatures are ranked by cosine distance when queried with the L1000 LINCS data processed by the MODZ or the CD methods. The deviation from the cumulative distribution of a uniform for the rankings of drug targets as determined by DrugBank where signatures are computed using CD (blue) and MODZ (orange) under the same conditions. ECFP4, extended-connectivity fingerprints; MACCS, molecular access system; ROC, reveiver operating curves.
Figure 3
Figure 3
Screenshot from the input page of the L1000CDS2 software application. The input text boxes toggle between up and down sets, or an input vector option. Canned analysis for 670 disease signatures is provided with few clicks. The Ebola, ligand and cancer cell line signatures are provided as canned examples.
Figure 4
Figure 4
Screenshot from the single drug/small-molecule results page of the L1000CDS2 software application.
Figure 5
Figure 5
Screenshot from the drug pair results page of the L1000CDS2 software application.
Figure 6
Figure 6
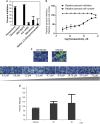
Experimental validation of small-molecule predictions. (a) Initial screen of the top five predicted small molecules to attenuate Ebola infection. HeLa cells were treated with 20 μM of each small molecule and then infected with Ebola at a multiplicity of infection (MOI) of five for 48 h. Ebola-infected cells were stained for viral antigen and analyzed on a confocal high-content imaging platform. (b) Dose–response experiments. HeLa cells were pretreated with a dose range of kenpaullone (0.3–75 μM) then infected with Ebola at an MOI of five for 48 h. (c) Representative images of cells treated in b. (d) Pre-treatment of HeLa cells with NCGC00184902-01 at two doses infected with Ebola. NCGC00184902-01 was predicted to reverse expression of the Ebola infection signatures at all three time points.
Figure 7
Figure 7
GO, KEGG, MGI, KEA and X2K enrichment analyses. (a) Gene Ontology, KEGG pathways and mammalian phenotype enrichment analyses visualization on three representative canvases for the upregulated genes after Ebola infection at 30 min. Each tile in each canvas represents a term/gene-set and where all terms are arranged based on their gene-set content similarity. The canvas is continuous so the sides fold on each other. The tiles brightness represents high enrichment scores (or low P values) computed with the Fisher’s exact test. The most top enriched terms are highlighted. Complete results can be seen in supporting Table 1. (b) Kinase enrichment analysis visualized on a canvas where each tile represents a mammalian kinase and the gene sets for each kinase are its known substrates. The brightness of the tiles represent the enrichment P value scores computed using the Fisher’s exact test. (c) Expression2Kinases analysis of the upregulated genes after 2 h. In this analysis, we first identify transcription factors that are enriched for targets within the differentially expressed genes based on prior ChIP-seq experiments. Then, the top ten transcription factors are connected through known protein–protein interactions. Finally, the resultant proteins within this subnetwork are subjected to kinase enrichment analysis with KEA. Node size reflects connectivity and color distinguishes transcription factors in blue, intermediate proteins in gray and kinases in green. GO, gene ontology.

Similar articles

  • Integrating Differential Gene Expression Analysis with Perturbagen-Response Signatures May Identify Novel Therapies for Thyroid-Associated Orbitopathy.
    Lee JY, Gallo RA, Ledon PJ, Tao W, Tse DT, Pelaez D, Wester ST. Lee JY, et al. Transl Vis Sci Technol. 2020 Aug 25;9(9):39. doi: 10.1167/tvst.9.9.39. eCollection 2020 Aug. Transl Vis Sci Technol. 2020. PMID: 32908802 Free PMC article.
  • LINCS Canvas Browser: interactive web app to query, browse and interrogate LINCS L1000 gene expression signatures.
    Duan Q, Flynn C, Niepel M, Hafner M, Muhlich JL, Fernandez NF, Rouillard AD, Tan CM, Chen EY, Golub TR, Sorger PK, Subramanian A, Ma'ayan A. Duan Q, et al. Nucleic Acids Res. 2014 Jul;42(Web Server issue):W449-60. doi: 10.1093/nar/gku476. Epub 2014 Jun 6. Nucleic Acids Res. 2014. PMID: 24906883 Free PMC article.
  • Compound signature detection on LINCS L1000 big data.
    Liu C, Su J, Yang F, Wei K, Ma J, Zhou X. Liu C, et al. Mol Biosyst. 2015 Mar;11(3):714-22. doi: 10.1039/c4mb00677a. Epub 2015 Jan 22. Mol Biosyst. 2015. PMID: 25609570 Free PMC article.
  • The Library of Integrated Network-Based Cellular Signatures NIH Program: System-Level Cataloging of Human Cells Response to Perturbations.
    Keenan AB, Jenkins SL, Jagodnik KM, Koplev S, He E, Torre D, Wang Z, Dohlman AB, Silverstein MC, Lachmann A, Kuleshov MV, Ma'ayan A, Stathias V, Terryn R, Cooper D, Forlin M, Koleti A, Vidovic D, Chung C, Schürer SC, Vasiliauskas J, Pilarczyk M, Shamsaei B, Fazel M, Ren Y, Niu W, Clark NA, White S, Mahi N, Zhang L, Kouril M, Reichard JF, Sivaganesan S, Medvedovic M, Meller J, Koch RJ, Birtwistle MR, Iyengar R, Sobie EA, Azeloglu EU, Kaye J, Osterloh J, Haston K, Kalra J, Finkbiener S, Li J, Milani P, Adam M, Escalante-Chong R, Sachs K, Lenail A, Ramamoorthy D, Fraenkel E, Daigle G, Hussain U, Coye A, Rothstein J, Sareen D, Ornelas L, Banuelos M, Mandefro B, Ho R, Svendsen CN, Lim RG, Stocksdale J, Casale MS, Thompson TG, Wu J, Thompson LM, Dardov V, Venkatraman V, Matlock A, Van Eyk JE, Jaffe JD, Papanastasiou M, Subramanian A, Golub TR, Erickson SD, Fallahi-Sichani M, Hafner M, Gray NS, Lin JR, Mills CE, Muhlich JL, Niepel M, Shamu CE, Williams EH, Wrobel D, Sorger PK, Heiser LM, Gray JW, Korkola JE, Mills GB, LaBarge M, Feiler HS, Dane MA, Bucher E, Nederlof M, Sudar D, Gross S, Kilburn DF, Smith R, Devlin K, Margolis R, Derr L, Lee A, Pillai A. Keenan AB, et al. Cell Syst. 2018 Jan 24;6(1):13-24. doi: 10.1016/j.cels.2017.11.001. Epub 2017 Nov 29. Cell Syst. 2018. PMID: 29199020 Free PMC article. Review.
  • [Development of antituberculous drugs: current status and future prospects].
    Tomioka H, Namba K. Tomioka H, et al. Kekkaku. 2006 Dec;81(12):753-74. Kekkaku. 2006. PMID: 17240921 Review. Japanese.

Cited by

References

    1. Stegmaier, K. et al. Gene expression–based high-throughput screening (GE-HTS) and application to leukemia differentiation. Nat. Genet. 36, 257–263 (2004). - PubMed
    1. Lamb, J. et al. The Connectivity Map: using gene-expression signatures to connect small molecules, genes, and disease. Science 313, 1929–1935 (2006). - PubMed
    1. Campillos, M., Kuhn, M., Gavin, A.-C., Jensen, L. J. & Bork, P. Drug target identification using side-effect similarity. Science 321, 263–266 (2008). - PubMed
    1. Clark, N. R. et al. The characteristic direction: a geometrical approach to identify differentially expressed genes. BMC Bioinformatics 15, 79 (2014). - PMC - PubMed
    1. Smyth, G. K. in Bioinformatics and Computational Biology Solutions Using R and Bioconductor 397–420 (Springer, 2005).