

miRNA signatures can predict acute liver failure in hepatitis E infected pregnant females
- PMID: 28413835
- PMCID: PMC5384411
- DOI: 10.1016/j.heliyon.2017.e00287
miRNA signatures can predict acute liver failure in hepatitis E infected pregnant females
Abstract
Background: Acute viral hepatitis E (AVH-E) can often result in acute liver failure (ALF) during pregnancy. microRNAs serve as mediators in drug induced liver failure. We investigated their role as a biomarker in predicting ALF due to HEV (ALF-E).
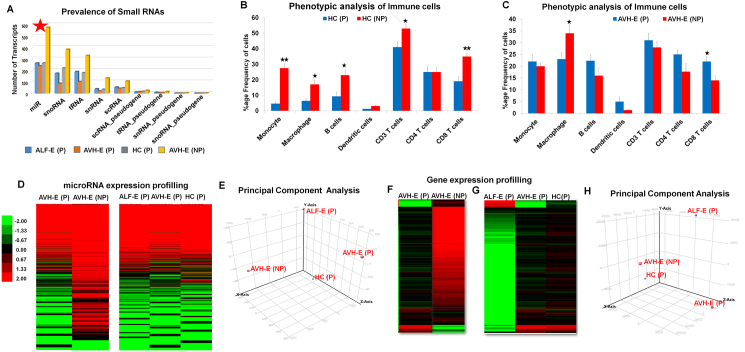
Methods: We performed next generation sequencing and subsequent validation studies in PBMCs of pregnant (P) self limiting AVH-E, ALF due to HEV (ALF-E) and compared with AVH-E in non-pregnant (NP) females and healthy controls.
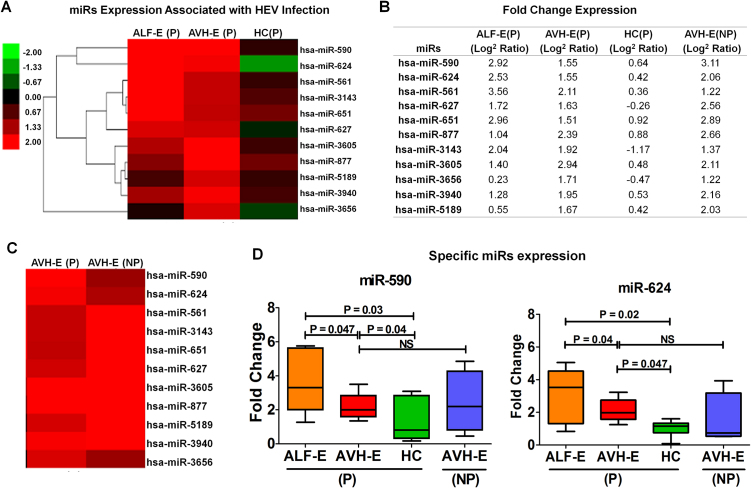
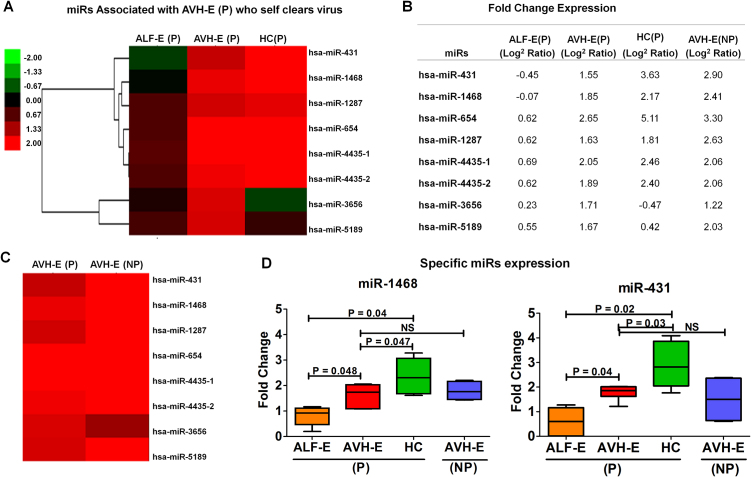
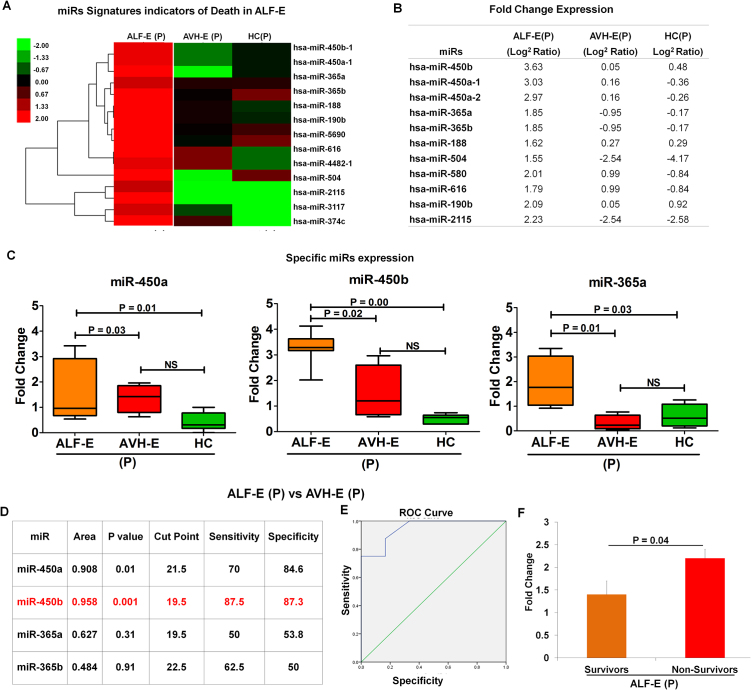
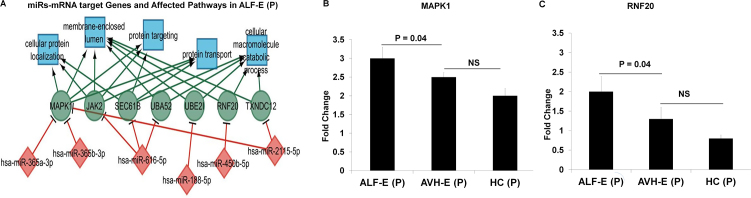
Findings: Eleven microRNAs were significantly expressed in response to HEV infection; importantly, miR- 431, 654, 1468 and 4435, were distinctly expressed in pregnant self-limiting AVH-E and healthy females (p = 0.0005), but not in ALF-E. Sixteen exclusive microRNAs differentiated ALF-E from self limiting AVH-E in pregnant females. miR-450b which affects cellular proliferation and metabolic processes through RNF20 and SECB was predominanlty upregulated and correlated with poor outcome (ROC 0.958, p = 0.001).
Interpretation: Our results reveal that a specific microRNA profile can predict fatality in ALF-E in pregnancy. These microRNAs could be exploited as prognostic biomarkers and help in the development of new therapeutic interventions.
Keywords: Health sciences; Virology.
Figures


Similar articles
-
Impaired monocyte-macrophage functions and defective Toll-like receptor signaling in hepatitis E virus-infected pregnant women with acute liver failure.Hepatology. 2015 Dec;62(6):1683-96. doi: 10.1002/hep.28143. Epub 2015 Oct 28. Hepatology. 2015. PMID: 26331854
-
High levels of circulating HMGB1 as a biomarker of acute liver failure in patients with viral hepatitis E.Liver Int. 2013 Oct;33(9):1341-8. doi: 10.1111/liv.12197. Epub 2013 May 19. Liver Int. 2013. PMID: 23682703
-
Role of HEV antigen detection in HEV-related acute viral hepatitis and acute liver failure.J Med Virol. 2016 Dec;88(12):2179-2185. doi: 10.1002/jmv.24567. Epub 2016 Jul 25. J Med Virol. 2016. PMID: 27153108
-
The burden of HEV-related acute liver failure in Bangladesh, China and India: a systematic review and meta-analysis.BMC Public Health. 2023 Nov 29;23(1):2369. doi: 10.1186/s12889-023-17302-2. BMC Public Health. 2023. PMID: 38031080 Free PMC article.
-
Hepatitis E and Acute-on-Chronic Liver Failure.J Clin Exp Hepatol. 2013 Sep;3(3):225-30. doi: 10.1016/j.jceh.2013.08.013. Epub 2013 Sep 16. J Clin Exp Hepatol. 2013. PMID: 25755504 Free PMC article. Review.
Cited by
-
Potential role of microRNAs in personalized medicine against hepatitis: a futuristic approach.Arch Virol. 2024 Jan 21;169(2):33. doi: 10.1007/s00705-023-05955-8. Arch Virol. 2024. PMID: 38245876 Review.
-
The expression patterns of immune response genes in the Peripheral Blood Mononuclear cells of pregnant women presenting with subclinical or clinical HEV infection are different and trimester-dependent: A whole transcriptome analysis.PLoS One. 2020 Feb 3;15(2):e0228068. doi: 10.1371/journal.pone.0228068. eCollection 2020. PLoS One. 2020. PMID: 32012176 Free PMC article.
-
Micro RNAs-The Small Big Players in Hepatitis E Virus Infection: A Comprehensive Review.Biomolecules. 2022 Oct 22;12(11):1543. doi: 10.3390/biom12111543. Biomolecules. 2022. PMID: 36358893 Free PMC article. Review.
-
Genome-wide association study identifies several loci for HEV seropositivity.iScience. 2023 Aug 10;26(9):107586. doi: 10.1016/j.isci.2023.107586. eCollection 2023 Sep 15. iScience. 2023. PMID: 37664632 Free PMC article.
-
miRNA-ome plasma analysis unveils changes in blood-brain barrier integrity associated with acute liver failure in rats.Fluids Barriers CNS. 2023 Dec 8;20(1):92. doi: 10.1186/s12987-023-00484-7. Fluids Barriers CNS. 2023. PMID: 38066639 Free PMC article.
References
-
- Khuroo M.S., Kamili S. Aetiology, clinical course and outcome of sporadic acute viral hepatitis in pregnancy. J. Viral Hepat. 2003;10(1):61–69. - PubMed
-
- Patra S., Kumar A., Trivedi S.S., Puri M., Sarin S.K. Maternal and fetal outcomes in pregnant women with acute hepatitis E virus infection. Ann. Intern. Med. 2007;147(1):28–33. - PubMed
-
- TrehanPati N., Geffers R., Sukriti, Hissar S., Riese P., Toepfer T. Gene expression signatures of peripheral CD4+ T cells clearly discriminate between patients with acute and chronic hepatitis B infection. Hepatology. 2009;49(3):781–790. - PubMed
-
- John K., Hadem J., Krech T., Wahl K., Manns M.P., Dooley S. MicroRNAs play a role in spontaneous recovery from acute liver failure. Hepatology. 2014;60(4):1346–1355. - PubMed
LinkOut - more resources
Full Text Sources
Other Literature Sources
Miscellaneous
