Case Reports

Inherited GINS1 deficiency underlies growth retardation along with neutropenia and NK cell deficiency

Julien Cottineau et al. J Clin Invest. .

Abstract

Inborn errors of DNA repair or replication underlie a variety of clinical phenotypes. We studied 5 patients from 4 kindreds, all of whom displayed intrauterine growth retardation, chronic neutropenia, and NK cell deficiency. Four of the 5 patients also had postnatal growth retardation. The association of neutropenia and NK cell deficiency, which is unusual among primary immunodeficiencies and bone marrow failures, was due to a blockade in the bone marrow and was mildly symptomatic. We discovered compound heterozygous rare mutations in Go-Ichi-Ni-San (GINS) complex subunit 1 (GINS1, also known as PSF1) in the 5 patients. The GINS complex is essential for eukaryotic DNA replication, and homozygous null mutations of GINS component-encoding genes are embryonic lethal in mice. The patients' fibroblasts displayed impaired GINS complex assembly, basal replication stress, impaired checkpoint signaling, defective cell cycle control, and genomic instability, which was rescued by WT GINS1. The residual levels of GINS1 activity reached 3% to 16% in patients' cells, depending on their GINS1 genotype, and correlated with the severity of growth retardation and the in vitro cellular phenotype. The levels of GINS1 activity did not influence the immunological phenotype, which was uniform. Autosomal recessive, partial GINS1 deficiency impairs DNA replication and underlies intra-uterine (and postnatal) growth retardation, chronic neutropenia, and NK cell deficiency.


Conflict of interest statement

Conflict of interest: The authors have declared that no conflict of interest exists.

Figures

Figure 1
Figure 1. NK cell and neutrophil deficiency.
(A) Representative flow cytometry plots of peripheral total NK cells in PBMCs from a travel control and 4 patients. (B) Quantification, by flow cytometry, of peripheral total, CD56bright, and CD56dim NK cells, in the travel controls and patients (*P < 0.05, **P < 0.01, ***P < 0.001; 1-way bidirectional ANOVA). Het, heterozygote. (C) NK cell expansion upon cytokine stimulation was assessed by culture of PBMCs with complete medium supplemented or not with IL-2 (100 U/ml) or IL-15 (10 ng/ml) for 3.5 days. (D) Quantification, by flow cytometry, of peripheral total ILC and ILC1, ILC2, and ILC3 subsets in CD45+ PBMCs, MAIT (CD3+Vα7.2+CD161hi) cells and NKT (CD3+Vα24+Vβ11+) cells in the travel controls and patients. ns, not significant. (E) Neutrophil counts of 4 patients. (F) Analysis of neutrophil precursors in the bone marrow of 4 patients. Patient P5 was treated by G-CSF.
Figure 2
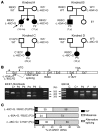
Figure 2. Identification of GINS1 mutations.
(A) Pedigrees of the 4 families, showing allele segregation. The index case is indicated by an arrow, and “E?” indicates an unknown genotype. The age of each patient is indicated in parentheses. (B) Schematic diagram of the structure of the GINS1 cDNA, consisting of 7 exons, indicating the positions of mutations. The arrows show the primers used for cDNA amplification. Electrophoresis of PCR products from GINS1 cDNA for a control (C+), P2, P2’s father (F), P2’s mother (M), P3, P4, and P5. Ex1, exon 1. (C) Schematic diagram of the relative expression levels of each allele corresponding to the various genotypes as assessed by cloning of the cDNA molecules from patient fibroblasts.
Figure 3
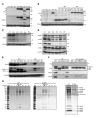
Figure 3. The GINS1 mutants are associated with CMG complex loss of function or instability.
(A) Western blot analysis of total protein extracts from HEK293T cells expressing GINS1 cDNAs. Cells were not transfected (NT), mock transfected (MO), or transfected with pCMV6 empty (EV), pCMV6 GINS1 WT-Flag (WT), pCMV6 GINS1 R83C-Flag (R83C), pCMV6 GINS1 delEx1-Flag (ΔE1), or pCMV6 GINS1 C152Y-Flag (C152Y), with antibodies against Flag-tag and GINS1. An antibody against α-tubulin was used as a loading control. (B) Western blot analysis of total protein extracts from HEK293T cells not transfected, mock transfected, or transfected with pCMV6 empty vector (EV), pCMV6 GINS1 WT- or ΔE1-Flag (WT, ΔE1), pCMV6 GINS1 WT- or ΔE1-ATG1-Flag (WT- or ΔE1-ATG1), pCMV6 GINS1 WT or ΔE1-ATG2-Flag (WT- or ΔE1-ATG2), pCMV6 GINS1 WT or ΔE1-ATG3-Flag (WT- or ΔE1-ATG3), pCMV6 GINS1 WT or ΔE1-ATG1+2+3-Flag (WT- or ΔE1-ATG1,2,3) vectors. An antibody against α-tubulin was used as a loading control. (C) Western blot analysis of GINS1 expression on total protein extracts from patient and control E6/E7-fibroblasts. An antibody against GAPDH was used as a loading control. (D) Western blot analysis of GINS2, GINS3, GINS4, and MCM4 in total protein extracts from patient and control E6/E7-fibroblasts. An antibody against GAPDH was used as a loading control. (E) Western blot analysis of GINS1 and GINS3 expression in total protein extracts from control and P2 E6/E7-fibroblasts lentiviral transduced by empty vector (EV), GINS1-WT (WT), GINS1-R83C (R83C), or GINS1-ΔE1 (ΔE1) or not transduced (NT). An antibody against GAPDH was used as a loading control. Results in AE are representative of 3 independent experiments. (F) Total protein extracts from HeLa cells transfected with pIRESpuroHF-GINS1 WT or mutant constructs (R83C, ΔE1, C152Y) encoding N-terminally His6Flag2-tagged proteins were subjected to immunoprecipitation with an antibody against the Flag tag, in the presence (+Flag) or absence of the 3XFlag peptide. Western blotting was performed with antibodies against the Flag tag, GINS3, and GINS4. Results are representative of 4 independent experiments. (G) Left: Purification of the CMG complex from Sf9 insect cells co-infected with viruses expressing the 11 CMG subunits, including GINS1 WT or C152Y, as described in Methods. Gradient fractions were subjected to SDS-PAGE separation followed by silver staining: 5 μl for GINS1 WT and 15 μl for GINS1 C152Y. Right: The peak fractions of both CMG (WT or C152Y) purification (5 μl fraction 7) were subjected to SDS-PAGE separation. Results are representative of 2 independent experiments.
Figure 4
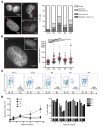
Figure 4. Abnormal nuclear structure and cell cycle defects in primary cells of patients with GINS1 mutations.
(A) Nuclear abnormalities visualized and quantified in 100 cells analyzed by fluorescence microscopy after DAPI staining on primary fibroblasts. Left: Images illustrating the different nucleus morphologies observed in patients’ cells. Right: Cells were scored as normal or having cytokinesis abnormalities (1), micronuclei (2), multi-lobed nuclei (3), and nuclei with grossly abnormal morphology (4) (n = 3; 3 independent controls in each experiment). (B) Left: Image illustrating the increased nucleus size in P3 versus a control. Right: Measurement of nucleus area with ImageJ software after DAPI staining of primary fibroblasts (***P < 0.001; 1-way bidirectional ANOVA). (C) Cell cycle analysis by BrdU/propidium iodide staining of unsynchronized primary fibroblasts from healthy control (CTL) and 3 patients (P2, P3, and P4). Results are representative of 3 independent experiments. (D) Growth curve (left) and viability (right) of primary fibroblasts from 5 healthy controls and 3 patients (P2, P3, and P5). Results are representative of 2 independent experiments.
Figure 5
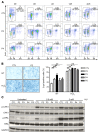
Figure 5. GINS1 mutations are associated with poor ATR pathway activation.
(A) Cell cycle analysis by BrdU/propidium iodide staining on E6/E7-fibroblasts from a healthy control (CTL) and 2 patients (P2 and P4) from the indicated time points (0, 4, 12, to 20 hours) after nocodazole synchronization. Results are representative of 3 independent experiments. (B) Percentage of E6/E7-fibroblasts from controls and patients positive for senescence-associated β-gal activity (n = 3, 300 cells analyzed/experiment), as determined by microscopy. (*P < 0.05, **P < 0.01, ***P < 0.001; 1-way bidirectional ANOVA). Original magnification, ×20. (C) Phosphorylation of CHK1 and RPA, assessed by Western blot analysis of total protein extracts from untreated or treated (incubation for 20 hours with 0.5 or 2 mM HU) E6/E7-fibroblasts from controls and patients, with antibodies against P-CHK1, P-RPA, CHK1, and RPA. GAPDH was used as a loading control. The data shown are representative of 3 independent experiments.
Figure 6
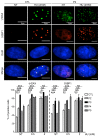
Figure 6. GINS1 mutations are associated with increased DNA damage.
Top: E6/E7-fibroblasts were seeded on glass coverslips before treatment with 0.5 or 2 mM HU for 20 hours or left untreated. Cells were fixed before staining with γH2AX and 53BP1 antibodies and DAPI. Bottom: Quantification of slides for percentage of cells with at least 3 foci. Values represent the mean averages ± SEM of scoring from 3 independent experiments (*P < 0.05, **P < 0.01, ***P < 0.001; 1-way bidirectional ANOVA).
Figure 7
Figure 7. GINS1-deficient patient cells show impaired DNA replication.
(A) Left: Scheme of the protocol used for double-pulse labeling of replication forks in asynchronous E6/E7-fibroblasts. Successive pulses with CldU and IdU enable recognition of ongoing forks, and initiation and termination events. Red and green arrows represent neo-synthesized DNA labeled with CldU (first pulse) and IdU (second pulse), respectively. Representative pictures of DNA fibers of replication, initiation, termination, uni- or bidirectional forks and clusters are shown. Right: Analysis of replication parameters in untreated E6/E7-fibroblasts from patients and 3 independent controls (CTL). Quantification of all events in 300 fibers was analyzed in 2 independent experiments. One representative control is shown. (B) Measurement of the CldU signal length of 50 CldU+IdU bidirectional starting signals. Measurement was done in patients and 3 independent controls in 2 independent experiments; red bars represent the mean. One representative control is shown. (C) Measurement of the CldU signal length of 50 CldU+IdU bidirectional starting signals from control and P2 E6/E7-fibroblasts lentiviral transduced by empty vector (EV); or GINS1-WT (WT), GINS1-R83C (R83C), or GINS1-ΔE1 (ΔE1); or not transduced (NT). The experiment was repeated two times. Red bars represent the mean. (D) Quantification of normal/stalled/collapsed replication forks in 50 bidirectional starting signals from patients and 3 independent controls. Replication forks were considered to have collapsed if there was no IdU signal or this signal was ≤10% of the CldU signal. ***P < 0.001; 1-way bidirectional ANOVA. Quantification was analyzed in 2 independent experiments. One representative control is shown.

Comment in

  • Defects in DNA replication hit NK cells and neutrophils

References

    1. Moretta L, Moretta A. Unravelling natural killer cell function: triggering and inhibitory human NK receptors. EMBO J. 2004;23(2):255–259. doi: 10.1038/sj.emboj.7600019. - DOI - PMC - PubMed
    1. Vivier E, et al. Innate or adaptive immunity? The example of natural killer cells. Science. 2011;331(6013):44–49. doi: 10.1126/science.1198687. - DOI - PMC - PubMed
    1. Jouanguy E, Gineau L, Cottineau J, Béziat V, Vivier E, Casanova JL. Inborn errors of the development of human natural killer cells. Curr Opin Allergy Clin Immunol. 2013;13(6):589–595. doi: 10.1097/ACI.0000000000000011. - DOI - PMC - PubMed
    1. Orange JS. Natural killer cell deficiency. J Allergy Clin Immunol. 2013;132(3):515–525. - PMC - PubMed
    1. Gineau L, et al. Partial MCM4 deficiency in patients with growth retardation, adrenal insufficiency, and natural killer cell deficiency. J Clin Invest. 2012;122(3):821–832. doi: 10.1172/JCI61014. - DOI - PMC - PubMed

Publication types

MeSH terms