. 2017 May 1;127(5):1960-1977.
doi: 10.1172/JCI91138. Epub 2017 Apr 17.

PD-L1 interacts with CD80 to regulate graft-versus-leukemia activity of donor CD8+ T cells

PD-L1 interacts with CD80 to regulate graft-versus-leukemia activity of donor CD8+ T cells

Xiong Ni et al. J Clin Invest. .

Abstract

Programmed death ligand-1 (PD-L1) interacts with programmed death-1 (PD-1) and the immunostimulatory molecule CD80 and functions as a checkpoint to regulate immune responses. The interaction of PD-L1 with CD80 alone has been shown to exacerbate the severity of graft-versus-host disease (GVHD), whereas costimulation of CD80 and PD-1 ameliorates GVHD. Here we have demonstrated that temporary depletion of donor CD4+ T cells early after hematopoietic cell transplantation effectively prevents GVHD while preserving strong graft-versus-leukemia (GVL) effects in allogeneic and xenogeneic murine GVHD models. Depletion of donor CD4+ T cells increased serum IFN-γ but reduced IL-2 concentrations, leading to upregulation of PD-L1 expression by recipient tissues and donor CD8+ T cells. In GVHD target tissues, the interactions of PD-L1 with PD-1 on donor CD8+ T cells cause anergy, exhaustion, and apoptosis, thereby preventing GVHD. In lymphoid tissues, the interactions of PD-L1 with CD80 augment CD8+ T cell expansion without increasing anergy, exhaustion, or apoptosis, resulting in strong GVL effects. These results indicate that the outcome of PD-L1-mediated signaling in CD8+ T cells depends on the presence or absence of CD4+ T cells, the nature of the interacting receptor expressed by CD8+ T cells, and the tissue environment in which the signaling occurs.


Conflict of interest statement

Conflict of interest: The authors have declared that no conflict of interest exists.

Figures

Figure 1
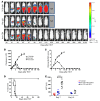
Figure 1. Three injections of anti-CD4 prevent both acute and chronic GVHD and preserve GVL effects after HCT with C57BL/6 donors and BALB/c recipients.
Lethally irradiated BALB/c recipients transplanted with splenocytes (5 × 10⁶) and TCD-BM (2.5 × 10⁶) from C57BL/6 donors. Recipients were challenged with i.p. injection of BCL1/Luc cells (5 × 10⁶ per mouse) and were given 3 i.v. injections of rat IgG or anti-CD4 mAb (500 μg/mouse) at days 0, 14, and 28 after HCT. Recipients given TCD-BM cells (2.5 × 10⁶) alone were used as controls. Mice were monitored for tumor growth using in vivo bioluminescent imaging (BLI), clinical signs of GVHD, and survival. (A) One representative BLI image from each time point is shown for each group. (B) Summary of photons per second of recipients. (C) Clinical GVHD score. (D) Percentage of survival. (E) Serum AST concentrations on days 7 and 12 after HCT. n = 4–8 per group, combined from 2 replicate experiments. Data represent mean ± SEM. P values were calculated by multiple t test (B and C), log-rank test (D), or unpaired 2-tailed Student’s t tests (E) (****P < 0.0001).
Figure 2
Figure 2. Depletion of donor CD4+ T cells preserves GVL effect while preventing GVHD after HCT with A/J donors and C57BL/6 recipients.
Lethally irradiated C57BL/6 recipients transplanted with splenocytes (SPL; 10 × 106, 20 × 106, or 40 × 106) and BM cells (10 × 106) from A/J donors. eGFP+ blast-crisis chronic myelogenous leukemia cells (eGFP+ BC-CML, 20 × 103) were injected i.v. on day 0. Recipients were injected with either rat IgG or anti-CD4 mAb (500 μg/mouse) at days 0, 7, 14, 28, 45, and 60 after HCT. Recipients were monitored for signs of tumor burden and clinical GVHD. Data are combined from 2–4 replicate experiments. (A) Percentage of survival; n = 8–16 per group. (B) Moribund mice with or without GVHD during observation and mice at day 100 after HCT were checked for BC-CML tumor cells in the spleen, liver, and BM. Percentage of BC-CML cells in spleen, liver, and BM is shown; n = 6–12 per group. N/D, non-detectable. (C) One hundred days after HCT, splenocytes were stained with anti–H-2Kb, TCRβ, CD4, and CD8 mAbs and analyzed for CD4+ T cell recovery after anti-CD4 mAb treatment. One representative panel from 4 recipients in each group is displayed. (D) Percentage of body weight change in recipients transplanted with 40 × 106 splenocytes treated with either rat IgG or anti-CD4 antibody; n = 8–12 per group. (E) One hundred days after HCT, histopathology of skin, salivary gland, lung, liver (original magnification, ×200), small intestine, and colon (original magnification, ×400) was evaluated. A representative photomicrograph and mean ± SEM of histopathology scores are shown; n = 6 per group. Data represent mean ± SEM combined from 2–4 independent experiments. P values were calculated by log-rank test (A), unpaired 2-tailed Student’s t tests (B and E), or multiple t test (D) (**P < 0.01, ****P < 0.0001). †, indicates all mice died.
Figure 3
Figure 3. Depletion of donor CD4+ T cells preserves GVL effect while preventing GVHD in a xenogeneic GVHD model.
NSG recipients transplanted with PBMCs (20 × 106 i.p.) from healthy human donors were injected with either IgG or anti–human CD4 mAb (200 μg/mouse, twice weekly for 4 weeks). 1 × 10⁶ eGFP+ Raji cells were injected i.p. on day 0. Recipients were monitored for signs of tumor burden and clinical GVHD. (A) Percentage of body weight change, survival, and representative photograph of mice transplanted with 20 × 106 PBMCs at day 50 to 60 after HCT are shown; n = 12 per group. (B) Histopathology of skin, salivary gland, lung, and liver was evaluated 50–100 days after HCT. Tissues from the IgG-treated group were harvested approximately 50 days after HCT when the recipients had become moribund. Tissues from anti-CD4–treated recipients were harvested at 100 days after HCT when we ended the experiments. A representative photomicrograph (original magnification, ×200) and mean ± SEM of histopathology scores are shown; n = 6 per group. (C) Survival of recipients transplanted with 20 × 106 PBMCs and 1 × 10⁶ Raji cells with IgG or anti–human CD4 mAb; n = 12 per group. Panels show eGFP staining to identify Raji cells in the spleen, liver, and BM with or without anti-CD4 treatment when mice became moribund or at day 100 after HCT when we ended the experiments. Percentages of Raji cells in spleen, liver, and BM are shown; n = 4 per group. Data represent mean ± SEM combined from 2 replicate experiments. P values were calculated by unpaired 2-tailed Student’s t tests (B and C) or multiple t test and log-rank test (A and C) (*P < 0.05, **P < 0.01, ***P < 0.001). †, indicates all mice died.
Figure 4
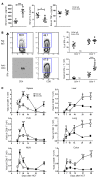
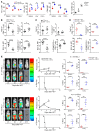
Figure 4. Depletion of donor CD4+ T cells increases serum IFN-γ concentrations but decreases IL-2 concentrations and augments CD8+ T cell expansion in lymphoid tissues but not in GVHD target tissues.
BALB/c recipients transplanted with splenocytes (2.5 × 10⁶) and TCD-BM cells (2.5 × 10⁶) from C57BL/6 donors were injected with either rat IgG or anti-CD4 mAb (500 μg/mouse) at day 0 after HCT. (A) Concentrations of IFN-γ, IL-2, and TNF-α in serum from recipients 7 days after HCT; n = 6 per group. (B) Splenocytes from recipients at day 7 after HCT were gated on H-2Kb+TCRβ+ and displayed as IFN-γ versus CD4 or CD8. Representative patterns and mean ± SEM of the percentage and yield of IFN-γ+ donor T cells in the spleen are shown; n = 8 per group. (C) Kinetic changes in donor CD8+ T cell expansion and infiltration. At days 5, 7, 10, 14, 21, and 28 after HCT, spleen, popliteal lymph nodes (PLN), mesenteric lymph nodes (MLN), liver, lung, and colon of recipients were harvested for analysis of donor CD8+ T yield. Mean ± SEM of the yield of H-2Kb+TCRβ+ CD8+ T cells is shown; n = 4–6 per group. Data represent mean ± SEM combined from 2 replicate experiments. P values were calculated by unpaired 2-tailed Student’s t tests (*P < 0.05, **P < 0.01, ***P < 0.001).
Figure 5
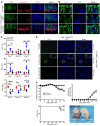
Figure 5. Depletion of donor CD4+ T cells protects Paneth cells, colonic epithelial cells, and hepatocytes.
Lethally irradiated WT BALB/c recipients transplanted with TCD-BM alone or with TCD-BM cells and splenocytes (2.5 × 10⁶) from C57BL/6 donors were injected with rat IgG or anti-CD4 mAb (500 μg/mouse) on day 0. Seven days after HCT, intestinal and liver tissue was analyzed. (A) Small intestine paraffin sections were stained with anti–IL-22R (green), anti-lysozyme (red), and DAPI (blue). (B) Colon paraffin sections were stained with anti-cytokeratin (CK) and DAPI (blue). (A and B) One representative photomicrograph (original magnification, ×400) is shown from 4 per group. (C) Liver enzymes in serum of recipients at days 7, 10, and 21 were measured. Mean ± SEM; n = 4–6 per group (*P < 0.05, **P < 0.01, ***P < 0.001, ****P < 0.0001). ALT, alanine aminotransferase; AST, aspartate amino transferase; ALB, albumin. (D) TUNEL staining for hepatocyte apoptosis assay. A representative immunofluorescent photomicrograph (original magnification, ×400) and mean ± SEM of percentage of TUNEL+ apoptotic hepatocytes are shown; n = 4 per group. (E) Recipients were sacrificed at day 21 after HCT, and sorted liver-infiltrating donor CD8+ T cells (1 × 10⁶) were transplanted together with TCD-BM (5 × 10⁶) into secondary 200-cGy-irradiated Rag2–/– BALB/c mice. Mice were monitored for clinical GVHD. Percentage of body weight change, clinical cutaneous GVHD score, survival curve, and representative photo of mice at day 60 after HCT are shown; n = 8 per group combined from 2 replicate experiments. P values were calculated by 1-way ANOVA multiple-comparisons (C) and multiple t test and log-rank test (E).
Figure 6
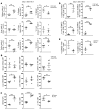
Figure 6. Depletion of donor CD4+ T cells augments donor CD8+ T cell apoptosis in the intestine and anergy/exhaustion in the liver, but not in the spleen.
Lethally irradiated WT BALB/c mice were transplanted and treated at day 0 with IgG or anti-CD4 mAb as in Figure 5. On day 7 after HCT, spleen, liver, and colon from recipients were harvested. (A) Yield, annexin V staining, and BrdU staining of donor CD8+ T cells in spleen, liver, and colon; n = 4–6 per group. (B and C) GRAIL, TIM-3, and IL-7Rα expression by donor CD8+ T cells in spleen and liver; n = 4–6 per group. (D and E) Percentage of EOMES+T-bet+ and EOMES+PD-1+ donor CD8+ T cells in spleen and liver; n = 4 per group. (C and E) Comparison of anti-CD4 treated spleen and liver. Data represent mean ± SEM combined from 2 replicate experiments. P values were calculated by unpaired 2-tailed Student’s t test (*P < 0.05, **P < 0.01, ***P < 0.001).
Figure 7
Figure 7. Depletion of donor CD4+ T cells allows host-tissue PD-L1 to tolerize CD8+ T cells in GVHD target tissues but not in lymphoid tissues.
Lethally irradiated WT or Pdl1–/– BALB/c mice were transplanted and treated at day 0 with anti-CD4 mAb as described in Figure 5. On day 7 after HCT, spleen, liver, and colon from recipients were harvested. (A) Yield, annexin V staining, and BrdU staining of donor CD8+ T cells in spleen, liver, and colon; n = 4–6 per group. (B) GRAIL, TIM-3, and IL-7Rα expression by donor CD8+ T cells in spleen and liver; n = 4–6 per group. (C) Percentage of EOMES+T-bet+ cells and EOMES+PD-1+ cells among donor CD8+ T cells in spleen and liver; n = 4 per group. Data represent mean ± SEM combined from 2 replicate experiments. P values were calculated by unpaired 2-tailed Student’s t tests (*P < 0.05, **P < 0.01).
Figure 8
Figure 8. Donor CD8+ T-T PD-L1/CD80 interactions augment CD8+ T expansion and GVL effects in lymphoid tissues.
(A) Lethally irradiated WT BALB/c recipients received HCT as described in Figure 5. PD-L1, PD-1, and CD80 expression on donor CD8+ T cells in spleen, liver, and colon on day 7 after HCT; PD-1/CD80 ratio is for comparison of spleen, liver, and colon in anti-CD4 treated recipients; n = 4–6 per group. (B) WT BALB/c recipients were transplanted with 1 × 10⁶ Thy1.2+ splenocytes from WT or Pdl1–/– C57BL/6 donors and TCD-BM cells from WT C57BL/6 and given anti-CD4 mAb (500 μg/mouse) on day 0. Yield, annexin V staining, BCL-XL staining, and percentage of EOMES+PD-1+ cells among donor CD8+ T cells in spleen are shown; n = 6–10 per group, combined from 2 replicate experiments. (C) 1 × 10⁶ Thy1.2+ splenocytes from CD80–/– donors were used to repeat experiments described in B; n = 8. (D) Anti-CD4–treated WT BALB/c recipients were injected with IgG or PD-L1–specific mAb 43H12 (500 μg/mouse) on days 0 and 2 after HCT. Yield, annexin V staining, BCL-XL staining, and percentage EOMES+PD-1+ cells among donor CD8+ T cells in spleen are shown; n = 4–6 per group. (E) Anti-CD4–treated BALB/c recipients of splenocytes, TCD-BM, and BCL1/Luc+ cells were treated with 43H12 mAb or control IgG on days 0 and 2. Recipients were monitored for survival and tumor burden as described in Figure 1. A representative BLI for each group, photons per second of BLI, survival, and percentage of BCL1 cells in the spleen, mesenteric lymph nodes, liver, and lung are shown; n = 4–8 per group. Data represent mean ± SEM combined from 2 replicate experiments. P values were calculated by unpaired 2-tailed Student’s t tests (*P < 0.05, **P < 0.01, ***P < 0.001, ****P < 0.0001). †, indicates all mice died.
Figure 9
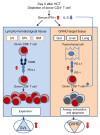
Figure 9. Summary diagram of donor and host-tissue cell expression of PD-L1 in regulation of donor CD8+ T expansion and tolerance in the lymphoid and GVHD target tissues.
LN, lymph node; SPL, spleen.

Comment in

  • PD-L1 serves as a double agent in separating GVL from GVHD

References

    1. Appelbaum FR. Haematopoietic cell transplantation as immunotherapy. Nature. 2001;411(6835):385–389. doi: 10.1038/35077251. - DOI - PubMed
    1. Shlomchik WD. Graft-versus-host disease. Nat Rev Immunol. 2007;7(5):340–352. doi: 10.1038/nri2000. - DOI - PubMed
    1. Zeng D, et al. Bone marrow NK1.1(–) and NK1.1(+) T cells reciprocally regulate acute graft versus host disease. J Exp Med. 1999;189(7):1073–1081. doi: 10.1084/jem.189.7.1073. - DOI - PMC - PubMed
    1. Ito M, Shizuru JA. Graft-vs.-lymphoma effect in an allogeneic hematopoietic stem cell transplantation model. Biol Blood Marrow Transplant. 1999;5(6):357–368. doi: 10.1016/S1083-8791(99)70012-1. - DOI - PubMed
    1. Chakraverty R, Sykes M. The role of antigen-presenting cells in triggering graft-versus-host disease and graft-versus-leukemia. Blood. 2007;110(1):9–17. doi: 10.1182/blood-2006-12-022038. - DOI - PMC - PubMed

MeSH terms