. 2017 May;19(5):558-567.
doi: 10.1038/ncb3507. Epub 2017 Apr 17.

High-resolution myogenic lineage mapping by single-cell mass cytometry

Affiliations

High-resolution myogenic lineage mapping by single-cell mass cytometry

Ermelinda Porpiglia et al. Nat Cell Biol. 2017 May.

Erratum in

Abstract

Muscle regeneration is a dynamic process during which cell state and identity change over time. A major roadblock has been a lack of tools to resolve a myogenic progression in vivo. Here we capitalize on a transformative technology, single-cell mass cytometry (CyTOF), to identify in vivo skeletal muscle stem cell and previously unrecognized progenitor populations that precede differentiation. We discovered two cell surface markers, CD9 and CD104, whose combined expression enabled in vivo identification and prospective isolation of stem and progenitor cells. Data analysis using the X-shift algorithm paired with single-cell force-directed layout visualization defined a molecular signature of the activated stem cell state (CD44+/CD98+/MyoD+) and delineated a myogenic trajectory during recovery from acute muscle injury. Our studies uncover the dynamics of skeletal muscle regeneration in vivo and pave the way for the elucidation of the regulatory networks that underlie cell-state transitions in muscle diseases and ageing.


Conflict of interest statement

COMPETING FINANCIAL INTERESTS

The authors declare no competing financial interests.

Figures

Figure 1
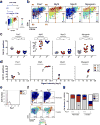
Figure 1. Identification of distinct cell surface markers that delineate a myogenic progression in vivo
(a) Cell surface marker screening panel analysis of muscle stem cells (MuSCs) and myoblasts. A single-cell suspension of hindlimb muscle isolated from Pax7-ZsGreen reporter mice, and cultured myoblasts were stained with 176 cell surface antibodies and analyzed by fluorescence-based flow cytometry. MuSCs were identified as ZsGreen+ cells. The plot shows the fraction of cells expressing each cell surface marker (y axis) and the level of protein expression, indicated as intensity of blue (MuSCs) and red (Myoblasts). (b) CyTOF mass cytometry workflow. Tibialis Anterior (TA) and Gastrocnemius (GA) muscles were triturated, digested to a single-cell suspension, stained with isotope-chelated antibodies and run through the CyTOF instrument. Stained cells were passed through an inductively-coupled plasma, atomized, ionized, and the elemental composition was mass measured. Signals corresponding to each elemental tag were correlated to the presence of the respective isotopic marker. Data were analyzed using standard flow cytometry software and the clustering algorithm X-shift. (c) Live/Lineage7integrin+/CD9+ cells gated from murine hindlimb muscles (TA and GA) were analyzed with the X-shift algorithm (K=30 was auto-selected by the switch-point finding algorithm) yielding six clusters (color-coded in blue, purple, light green, dark green, red and orange). These clusters were visualized using single-cell force-directed layout. Up to 2000 cells were randomly selected from each X-shift cluster, each cell was connected to 30 nearest neighbors in the phenotypic space and the graph layout was generated using the ForceAltas2 algorithm (representative experiment, n= 3 mice; 4 independent experiments). (d) Expression level of the myogenic transcription factors Pax7, Myf5, MyoD and Myogenin was visualized in the X-shift clusters shown in (c). Developmental time was inferred and three distinct populations were identified as SC, P1 and P2 (representative experiment, n= 3 mice). (e) Expression level of CD9 and CD104 was visualized in the X-shift clusters shown in (c) (representative experiment, n= 3 mice). (f) Model summarizing the expression pattern of the newly identified surface markers, CD9 and CD104, during the proposed transition from the stem cell (SC) to the progenitor (P1, P2) state.
Figure 2
Figure 2. Unique strategy for prospective isolation of stem and progenitor cells in vivo in skeletal muscle
(a) Scheme of gating strategy for CyTOF data. Live cells are identified based on lack of cisplatin binding. Live/Lineage/α7integrin+/CD9+ cells are selected and a biaxial dot plot of CD9 (y axis) by CD104 (x axis), colored by channel (CD104 expression), is shown. (b) Representative biaxial dot plot of CD9 by CD104 colored by channel, showing expression of Pax7, Myf5, MyoD and Myogenin in the stem and progenitor cells populations. (c) Data summary shows the fraction of cells (y axis) within populations SC, P1 and P2, expressing Pax7, Myf5, MyoD and Myogenin ((n=10 mice (Pax7), n= 9 (Myf5 and MyoD), 3 independent experiments; n=14 (Myogenin), 4 independent experiments). Line represents mean ± SEM. ANOVA test was performed with significance determined by Bonferroni's multiple comparisons test. (d) Data summary of myogenic transcription factor expression levels within populations SC, P1 and P2. Each graph shows the relationship between the percentage of positive cells (y axis) and the signal intensity within the positive population (x axis, log2) for the expression of Pax7, Myf5, MyoD and Myogenin (representative experiment, n=3 mice). (e) Histogram overlay of Pax7 expression in muscle isolated from Pax7 knock-out (Pax7−/−) and wild type (WT) mice and stained with an isotope-chelated antibody against Pax7. (f) Representative biaxial dot plots of CD9 by CD104 colored by channel, showing MyoD expression within populations SC, P1 and P2, in Pax7−/− and WT muscle isolated from neonates and 3 weeks old mice. (g) Stacked columns indicate the relative proportion of each population within the Live/Lineage/α7 integrin+/CD9+ myogenic compartment in Pax7−/− and WT muscle isolated from neonates (mean ± SEM from n=3 mice, 2 independent experiments) and 3 weeks old mice (n=1 Pax7−/−; mean ± SEM from n=10 WT, 2 independent experiments). Multiple t-tests analysis with Bonferroni correction was used to determine difference between Pax7−/− and WT neonates within populations SC, P1, P2. *, **, *** and **** represent statistical significance at p<0.05, p<0.01, p<0.001 and p<0.0001 respectively. NS represents statistically non-significant.
Figure 3
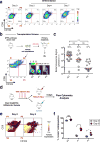
Figure 3. Progenitor cell populations originate from muscle stem cells and exhibit distinct regenerative capacity in vivo
(a) Flow cytometry analysis of sorted α7integrin+/CD34+ cells, cultured in growth media for 1 week on biomimetic hydrogels and then in differentiation media on collagen-coated plates for 2, 4, 7 days respectively. Representative biaxial plots of CD9 by CD104 show the fraction of populations SC, P1, P2 and P3 at the indicated time points (n=5, 2 independent experiments). (b) Scheme depicting the in vivo assay of regenerative capacity. Hindlimb muscles isolated from GFP/Luciferase mice were digested to a single-cell suspension. Cell populations SC, P1 and P2, were sorted based on expression of CD9 and CD104 (dot plot, lower left panel) and transplanted (200 cells/injection) into the irradiated TA muscle of NOD/SCID mice. Representative BLI images at 5 weeks post transplant are shown (lower right panel). (c) Scatter plot shows the percentage of transplants from each condition that engrafted above threshold (dashed line, 80,000 photons/s) into recipient tissue and the BLI signal intensity (y axis). Line represents median BLI signal (n= 19 mice (SC and P2), 3 independent experiments; n= 12 (P1), 2 independent experiments). ANOVA test was performed with significance determined by Bonferroni’s multiple comparisons test. (d) Scheme depicting lineage-tracing experiment to track progenitor populations in vivo upon injury. (e) TA muscle isolated from uninjured and injured mice (day 6 post-injury) was digested to a single-cell suspension and stained using fluorescently-conjugated antibodies against lineage markers, α7integrin, CD9 and CD104. Representative biaxial dot plots of CD9 by CD104 colored by channel, show the expression of tdTomato in populations SC, P1 and P2 at day 0 and day 6-post injury (n=3 mice per condition). (f) The scatter plot shows the fraction of tomato+ cells in populations SC, P1 and P2 at day 0 and day 6-post injury (mean ± SD from n=3 mice per condition). Multiple t-tests analysis with Bonferroni correction was used to determine the difference between the two groups (uninjured and injured) within population SC, P1 and P2. *, **, and **** represents statistical significance at p<0.05, p<0.01 and p<0.0001. NS represents statistically non-significant.
Figure 4
Figure 4. CyTOF analysis reveals the cellular and molecular dynamics within stem and progenitor cell populations during recovery from acute injury
(a) Experimental scheme depicts acute injury time course. Mice were acutely injured by notexin injection in the TA and GA muscles, 6 or 3 days prior to tissue collection and injected with IdU 8 hours prior to being sacrificed. Muscle tissues of 3 indicated groups were simultaneously collected at day 0, stained with isotope-chelated antibodies, run through the CyTOF instrument and analyzed using the X-shift clustering algorithm. (b) Representative biaxial dot plot of CD9 by CD104 colored by channel shows IdU incorporation (upper panels) and MyoD expression (lower panels) within individual populations during the injury time course (Day 0, Day 3, Day 6). Arrows indicate increased IdU incorporation and MyoD expression in the SC population at day 3. (c) The cells within each population in (b) are quantified as a fraction of the α7integrin+/CD9+ myogenic compartment during the injury time course. Stacked columns indicate the relative proportion of each population within the Live/Lineage/α7 integrin+/CD9+ population at each time point (mean ± SEM from n= 8 mice, 3 independent experiments). (d) Scatter plots show cell number (%) for each population in (b) as a function of time (day) post-injury. Line represents mean ± SEM. (e) Scatter plot shows the fraction of IdU+ cells within each population in (b) during the time course of muscle injury. Line represents mean ± SEM. Statistical analyses were performed using two-way ANOVA test with significance level determined by Bonferroni’s multiple comparisons test. *, *** and **** represent statistical significance at p<0.05, p<0.001 and p<0.0001 respectively. NS represents statistically non-significant.
Figure 5
Figure 5. High dimensional analysis of acute muscle injury identifies a molecular signature of the activated stem cell state
(a) Heatmap of protein expression in uninjured populations (transformed ratios compared to population SC, n=3 mice per condition). (b) Heatmap of protein expression in individual populations during the time course of injury (transformed ratios compared to day 0, n=3 mice per condition). (c) Representative biaxial dot plots of CD98 (y axis) by CD44 (x axis) colored by channel, showing MyoD expression in subsets of the SC population defined by CD98 and CD44 expression, during the injury time course (Day 0, Day 3, Day 6) (n=5, 2 independent experiments). (d) Cells within each CD98 by CD44 subset are quantified as a fraction of the SC population during the injury time course. Stacked columns indicate the relative proportion of each subset within the SC population at each time point (mean ± SEM from n=5, 2 independent experiments). Statistical analyses were performed using two-way ANOVA test for multiple comparisons with significance level determined by Bonferroni’s multiple comparisons test. The relative increase in the fraction of cells within the CD98+/CD44+ subset from Day 0 to Day 3 post-injury is highly significant (p<0.0001). (e) PCA plot of individual populations in (b) during the time course of injury. Proteins were clustered by their log2 median intensities (n=3 mice per condition)
Figure 6
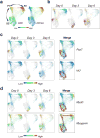
Figure 6. High dimensional analysis of acute muscle injury uncovers cell state transitions in vivo
(a) Live/Lineage7 integrin+/CD9+ cells gated from hindlimb muscles isolated during the course of notexin injury (Day 0, Day 3, Day 6) were clustered with X-shift algorithm and cells within the resultant clusters were visualized using single-cell force-directed layout as described in Fig. 1c. The color code shows the expression level of CD9 and CD104 (representative analysis, n=9 mice). (b) Visualization of cells from the X-shift clusters at each time point (Day 0, Day 3, Day 6) using single-cell force directed layout. The color code shows X-shift clusters (n=3 mice per condition). (c) Visualization of cells from the X-shift clusters as in (b). The color code shows the expression level of Pax7 (upper panels), and IdU incorporation (lower panels). Arrows indicate the trajectory of SC over time. (d) Visualization of X-shift clusters as in (b). The color code shows the expression level of MyoD (upper panels) and Myogenin (lower panels). Arrows indicate the trajectory of SC as in (c) and the progression at day 6 from SC to P1 and P2 (highlighted by Myogenin expression).

Similar articles

Cited by

References

    1. Chang NC, Rudnicki MA. Satellite cells: the architects of skeletal muscle. Curr. Top. Dev. Biol. 2014;107:161–181. - PubMed
    1. Blau HM, Cosgrove BD, Ho ATV. The central role of muscle stem cells in regenerative failure with aging. Nature Medicine. 2015;21:854–862. - PMC - PubMed
    1. Weissman IL. Translating stem and progenitor cell biology to the clinic: barriers and opportunities. Science. 2000;287:1442–1446. - PubMed
    1. Bendall SC, et al. Single-Cell Mass Cytometry of Differential Immune and Drug Responses Across a Human Hematopoietic Continuum. Science. 2011;332:687–696. - PMC - PubMed
    1. Bendall SC, et al. Single-cell trajectory detection uncovers progression and regulatory coordination in human B cell development. Cell. 2014;157:714–725. - PMC - PubMed

MeSH terms