. 2017 May;23(5):623-630.
doi: 10.1038/nm.4316. Epub 2017 Apr 17.

Alternatively activated macrophages do not synthesize catecholamines or contribute to adipose tissue adaptive thermogenesis

Affiliations

Alternatively activated macrophages do not synthesize catecholamines or contribute to adipose tissue adaptive thermogenesis

Katrin Fischer et al. Nat Med. 2017 May.

Abstract

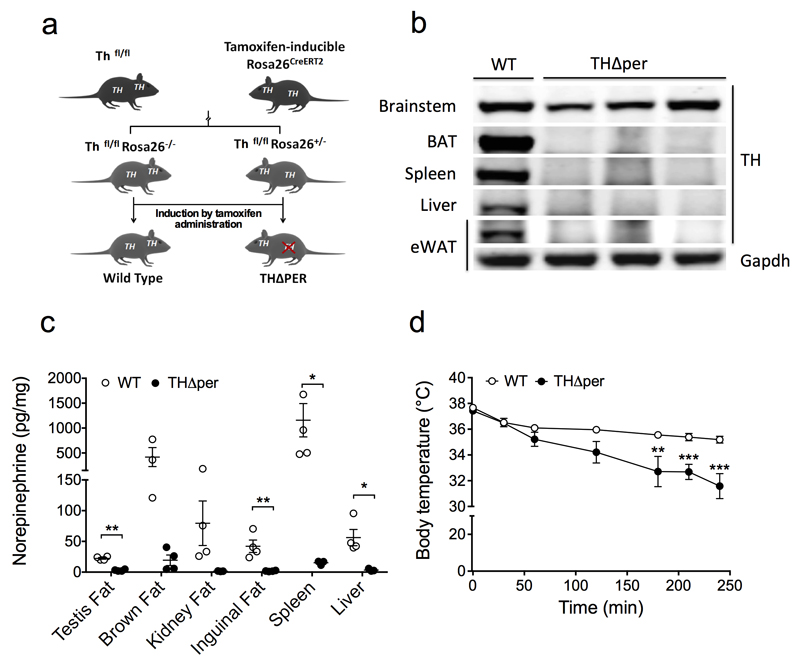
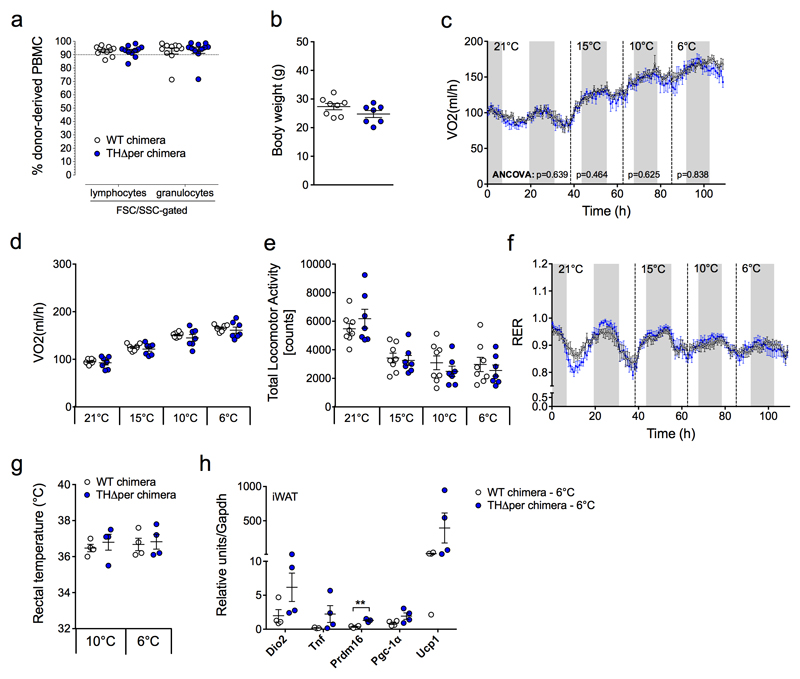
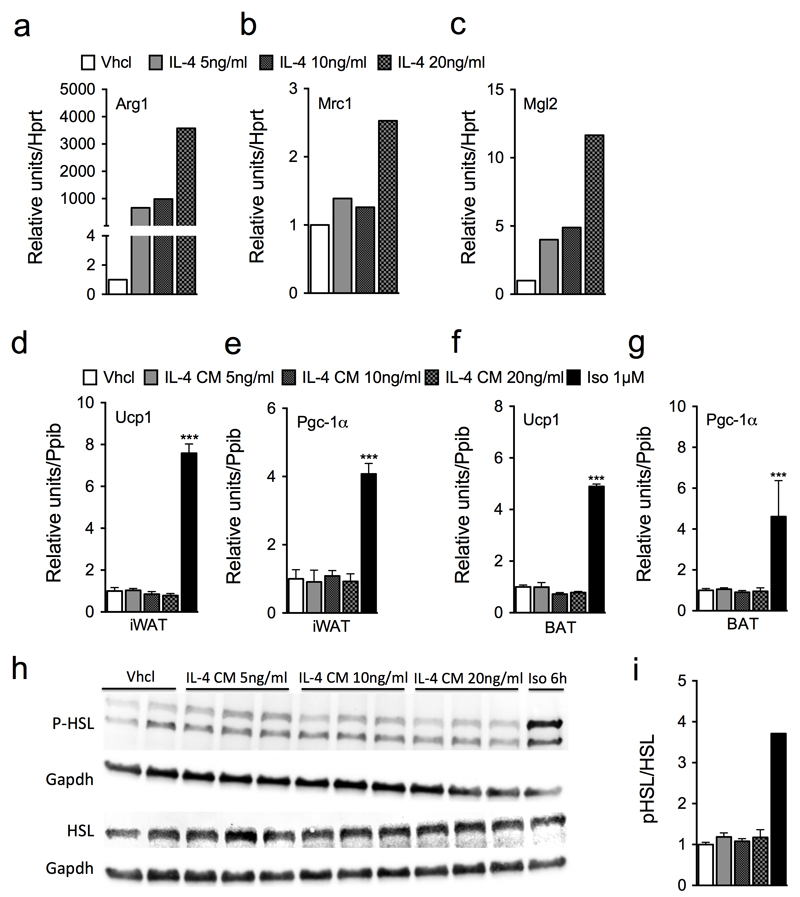
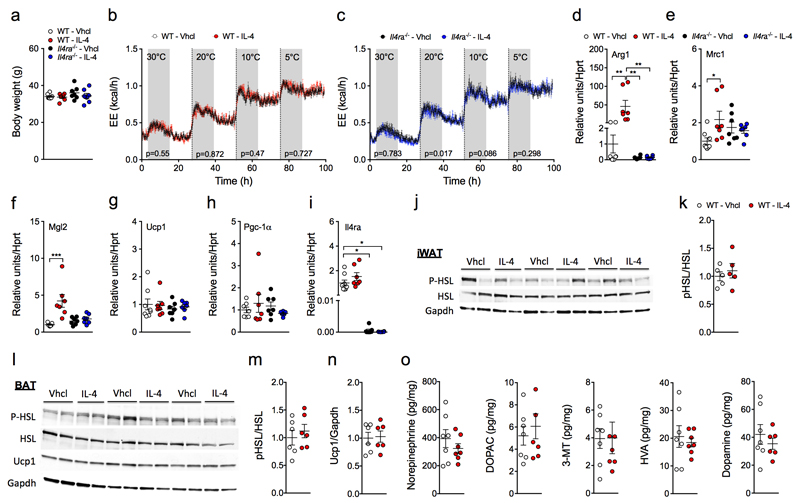
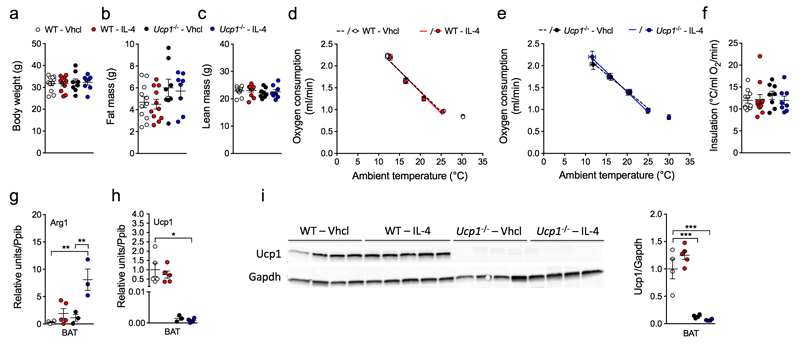
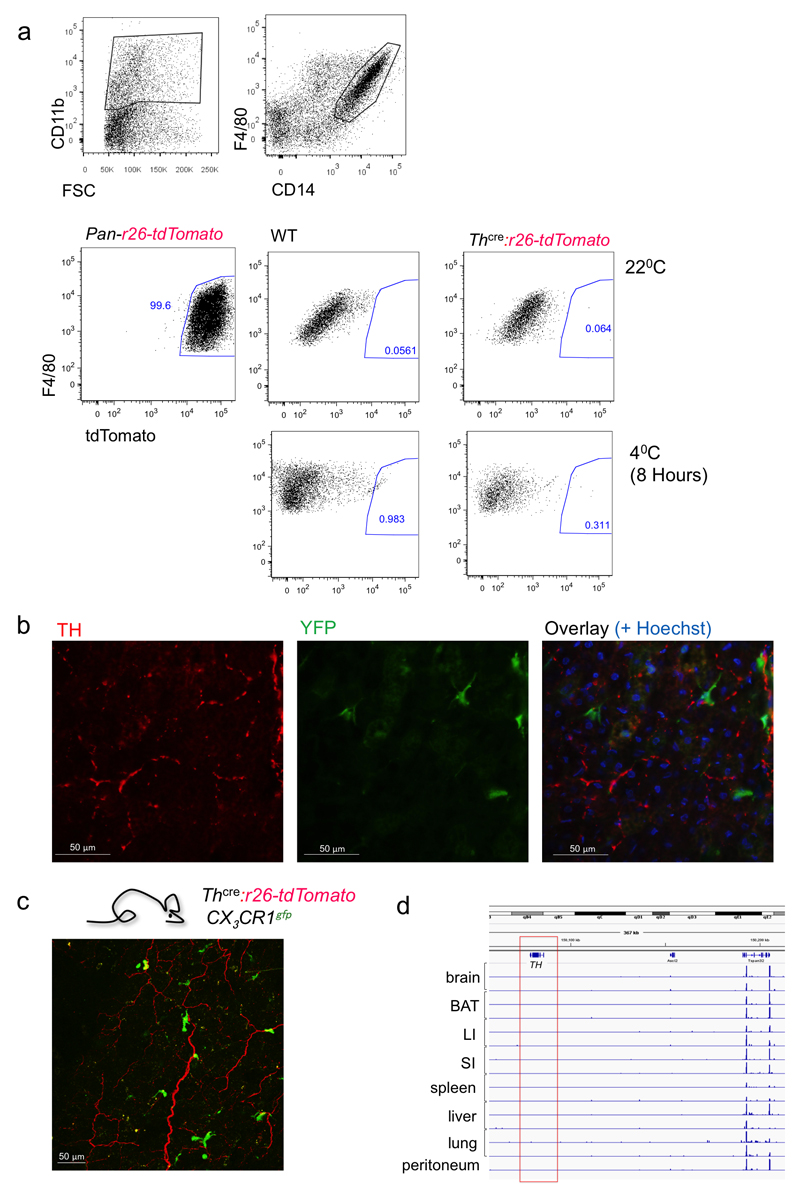
Adaptive thermogenesis is the process of heat generation in response to cold stimulation. It is under the control of the sympathetic nervous system, whose chief effector is the catecholamine norepinephrine (NE). NE enhances thermogenesis through β3-adrenergic receptors to activate brown adipose tissue and by 'browning' white adipose tissue. Recent studies have reported that alternative activation of macrophages in response to interleukin (IL)-4 stimulation induces the expression of tyrosine hydroxylase (TH), a key enzyme in the catecholamine synthesis pathway, and that this activation provides an alternative source of locally produced catecholamines during the thermogenic process. Here we report that the deletion of Th in hematopoietic cells of adult mice neither alters energy expenditure upon cold exposure nor reduces browning in inguinal adipose tissue. Bone marrow-derived macrophages did not release NE in response to stimulation with IL-4, and conditioned media from IL-4-stimulated macrophages failed to induce expression of thermogenic genes, such as uncoupling protein 1 (Ucp1), in adipocytes cultured with the conditioned media. Furthermore, chronic treatment with IL-4 failed to increase energy expenditure in wild-type, Ucp1-/- and interleukin-4 receptor-α double-negative (Il4ra-/-) mice. In agreement with these findings, adipose-tissue-resident macrophages did not express TH. Thus, we conclude that alternatively activated macrophages do not synthesize relevant amounts of catecholamines, and hence, are not likely to have a direct role in adipocyte metabolism or adaptive thermogenesis.


Conflict of interest statement

Competing financial interests

The authors declare no competing financial interests.

Figures

Figure 1
Figure 1. Selective deletion of TH in peripheral but not CNS tissues results in peripheral catecholamine depletion and impaired thermoregulation.
(a) Schematic of the inducible peripheral Th knockout (THΔper) mouse model. (b) Representative Western blot images of indicated tissues from WT or THΔper mice. Uncropped Western blot images are shown in Supplementary Figure 11. For WT and THΔper mice n = 2 and n = 3 samples (brain stem), n = 7 and n = 5 (BAT), n = 4 and n = 6 (spleen), n = 4 and n = 4 (liver) and n = 1 and n = 3 (eWAT). Gapdh of eWAT was chosen as a representative image for the loading control; comparable Gapdh loading for other tissues is shown in Supplementary Figure 11. (c) Level of norepinephrine in peripheral tissues of WT (n = 3-5) and THΔper (n = 3-4) mice, each dot representing one animal.. (d) Body temperature of WT (n = 7) and THΔper mice (n = 7) during a cold tolerance test at 4°C. Data represent mean ± s.e.m. *P < 0.05; **P < 0.01; ***P < 0.001, based on 2-sided Student’s t-test (c) or 2-way analysis of variance (ANOVA) followed by Bonferroni post-hoc comparison of the individual time-points (d).
Figure 2
Figure 2. Energy expenditure of WT and THΔper chimera.
(a) Percent donor-derived hematopoietic cells in peripheral blood 8 wks after bone marrow transplantation from WT (n = 11) or THΔper mice into WT mice (n = 11), designated from here on as WT chimera and THΔper chimera (FSC, forward scatter; SSC, sided scatter). (b) Body weight of chimera. (c-f) Energy expenditure as determined by longitudinal (c) and average (d) oxygen consumption, total locomotor activity (e) and RER (f) during a successive reduction in ambient temperatures (21, 15, 10, or 6°C) (n = 8 WT and n = 7 THΔper chimera). (g) Rectal temperature of WT (n = 4) and THΔper chimera (n = 4), exposed to either 10 or 6°C for 24 h. (h) Gene expression of browning and brown fat thermogenesis markers (Dio2, Tnf, Prdm16, Pgc-1α, Ucp1) in iWAT from WT (n = 4) and THΔper chimera (n = 4) after 24-h exposure to or 6°C. Data represent means ± s.e.m. * P < 0.05; ** P < 0.01, based on 2-sided Student’s t-test (a,b,d,e,g,h), analysis of co-variance (ANCOVA) with body weight as covariate (c), or 2-way ANOVA followed by Bonferroni post-hoc comparison (f).
Figure 3
Figure 3. Effect of alternatively activated macrophages from BALB/c mice on thermogenesis in primary inguinal white and brown adipocytes.
(a-c) Representative expression profile of M2 macrophage markers (Arg1, Mrc1, Mgl2) in IL-4-treated BMDM cells (graph shows 1 out of 3 independently performed experiments). (d-g) Gene expression of brown fat-specific markers (Ucp1, Pgc-1α) in conditioned media from IL-4-treated BMDMs (IL-4-CM) or isoproterenol (Iso)-treated iWAT (d,e) or BAT (f,g) primary cells for 6 h. Displayed results are representative for three independently performed experiments, each performed with n = 3 technical replicates. (h-i) Representative Western blot (h) and quantification (i) of phosphorylated or total HSL of 6-d differentiated BAT primary cells treated with IL-4-CM or Iso (1 µM) for 6 h. Western blot in panel h shows one out of three independently performed experiments, each performed with n = 3 technical replicates. Uncropped Western blot images are shown in Supplementary Figure 11. Data represent means ± s.e.m. * P < 0.05; ** P < 0.01; *** P < 0.001, based on 1-way ANOVA followed by Bonferroni-multiple comparison test.
Figure 4
Figure 4. Effect of IL-4 on energy expenditure and thermogenesis in WT and Il4ra-/- mice at different temperatures.
(a-c) Body weight (a) and energy expenditure of saline (Vhcl) or IL-4 (50 µg/kg)-treated WT (n = 8 and n = 7) (b) or Il4ra-/- mice (n = 7 each treatment) (c) was recorded over 4 d with ambient temperature decreasing from 30°C to 20°C to 10°C to 5°C (24-h measurement for each temperature). (d-i) Gene expression of M2 macrophage markers Arg1 (d), Mrc1 (e), Mgl2 (f), brown fat-specific markers Ucp1 (g), Pgc-1α (h), and Interleukin-4 receptor alpha, Il4ra (i) of BAT from cold-exposed WT or Il4ra-/- mice treated with either vehicle (n = 7-8 and n = 6-7) or IL-4 (n = 6-7 each treatment), each dot representing one animal. (j-n) Protein analysis of iWAT (j-k) and BAT (l-n) from cold-exposed WT mice treated with either vehicle (n = 6) or IL-4 (n = 6). Uncropped Western blot images are shown in Supplementary Figure 11. Catecholamines and metabolites (norepinephrine, 3,4-dihydroxyphenylacetic acid (DOPAC), 3-methoxytyramine (3-MT), homovanillic acid (HVA) and dopamine) were measured in BAT from cold-exposed mice treated with vehicle (n = 7) or IL-4 (n = 7) (o). Data represent means ± s.e.m. *, P < 0.05; ** P < 0.01; *** P < 0.001, based on 1-way ANOVA followed by Bonferroni-multiple comparison test (a,d-i), analysis of co-variance (ANCOVA) with body weight and body composition (fat and lean tissue mass) as covariate (b,c) or 2-sided Student’s t-test (k,m-o).
Figure 5
Figure 5. Effect of IL-4 on thermogenesis in WT and Ucp1-/- mice.
(a-c) Body weight (a) and body composition (b,c) of saline (Vhcl) or IL-4 (50 µg/kg)-treated WT and Ucp1-/- mice. (d-f) Scholander plot of vhcl (n = 11) or IL-4 (n = 11) treated WT (d) or Ucp1-/- (n = 8 each treatment) (e) mice and calculated insulation of all groups (f). (g-i) Gene expression of Arg1 (g) and Ucp1 (h) (n = 4-5 WT and n = 3-4 Ucp1-/- each treatment; each dot representing one animal), as well as protein levels of Ucp1 (i) from BAT of WT and Ucp1-/- mice treated with vhcl (n = 4 WT and n = 4 Ucp1-/-) or IL-4 (n = 5 WT and n = 4 Ucp1-/-). Uncropped Western blot images are shown in Supplementary Figure 12. Data represent means ± s.e.m. * P < 0.05; ** P < 0.01; *** P < 0.001, based on 1-way ANOVA followed by Bonferroni-multiple comparison test.
Figure 6
Figure 6. Tyrosine hydroxylase staining of brown adipose tissue macrophages.
(a) Representative FACS analysis of BAT macrophages isolated from pan-tdTomato, WT and ThCre:tdTomatofl/fl mice (n = 2 each genotype), either from mice housed at 22°C or at 4°C for 8 h; (top) macrophage gating strategy on CD11b, F4/80 and CD14 expressing cells. (b) Representative histology of BAT taken from Cx3cr1cre:r26- YFP animals in 22°C, stained for TH (red) and YFP (green) (n = 2) (scale bar: 50 µm). (c) Representative 2-photon live imaging of BAT taken from ThCre:tdTomato fl/fl:Cx3cr1gfp mice at 22°C (n = 5) (scale bar: 50 µm). (d) Integrative Genomics Viewer (IGV) plots of RNA sequencing data of the TH locus of macrophages isolated from brain, BAT, spleen, liver, peritoneum, large and small intestine (Li, SI) under steady state; data are from, except for BAT macrophages. Displayed results in panel d were performed in technical duplicates.

Similar articles

Cited by

References

    1. Jastroch M, et al. Seasonal Control of Mammalian Energy Balance: Recent advances in the understanding of daily torpor and hibernation. Journal of neuroendocrinology. 2016 doi: 10.1111/jne.12437. - DOI - PubMed
    1. Cannon B, Nedergaard J. Brown adipose tissue: function and physiological significance. Physiological reviews. 2004;84:277–359. doi: 10.1152/physrev.00015.2003. - DOI - PubMed
    1. Oelkrug R, Polymeropoulos ET, Jastroch M. Brown adipose tissue: physiological function and evolutionary significance. Journal of comparative physiology. B, Biochemical, systemic, and environmental physiology. 2015;185:587–606. doi: 10.1007/s00360-015-0907-7. - DOI - PubMed
    1. Cypess AM, Kahn CR. Brown fat as a therapy for obesity and diabetes. Current opinion in endocrinology, diabetes, and obesity. 2010;17:143–149. doi: 10.1097/MED.0b013e328337a81f. - DOI - PMC - PubMed
    1. Bartelt A, et al. Brown adipose tissue activity controls triglyceride clearance. Nature medicine. 2011;17:200–205. doi: 10.1038/nm.2297. - DOI - PubMed

MeSH terms