. 2017 Apr 17;15(4):e2001069.
doi: 10.1371/journal.pbio.2001069. eCollection 2017 Apr.

Transcriptional regulatory logic of the diurnal cycle in the mouse liver

Affiliations

Transcriptional regulatory logic of the diurnal cycle in the mouse liver

Jonathan Aryeh Sobel et al. PLoS Biol. .

Abstract

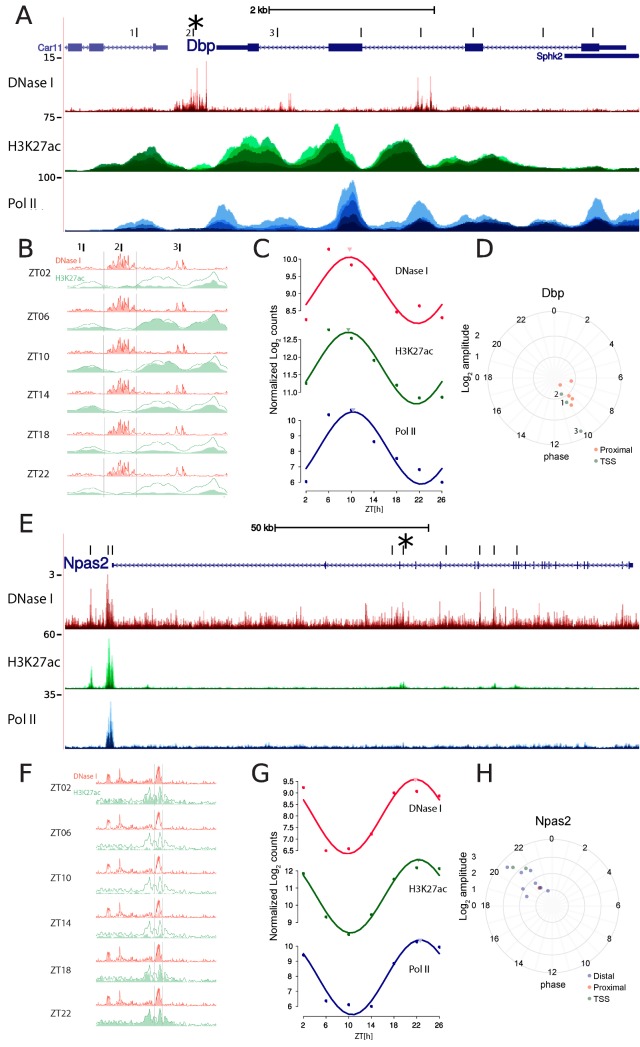
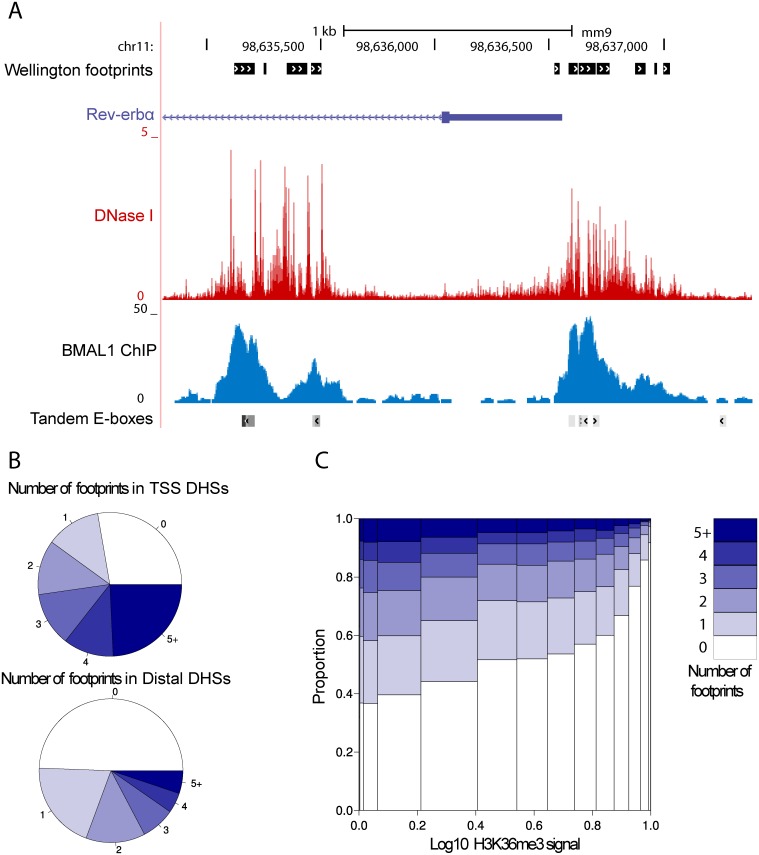
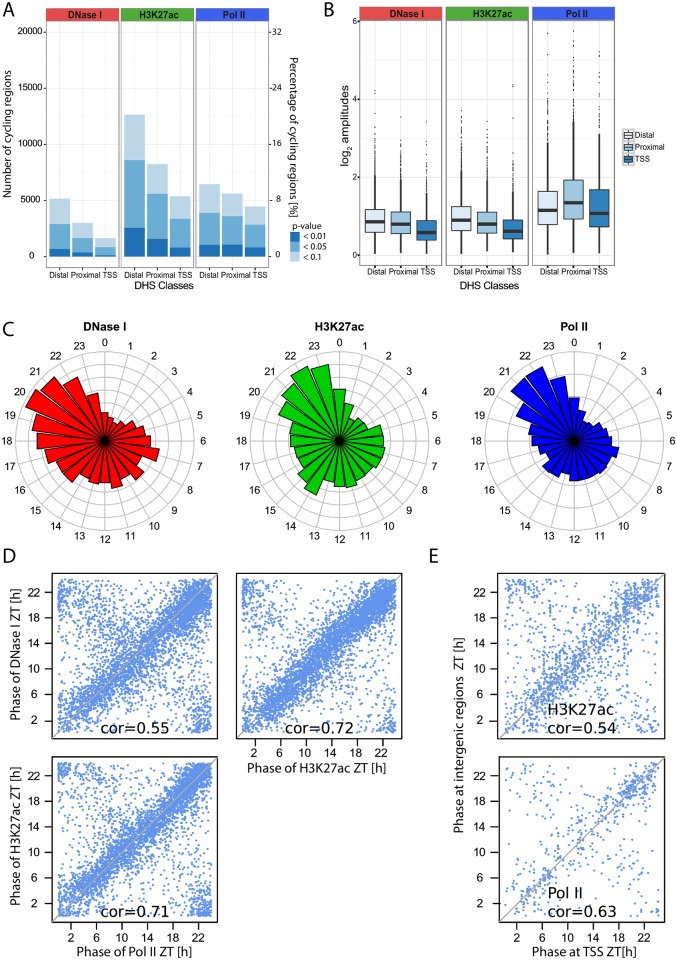
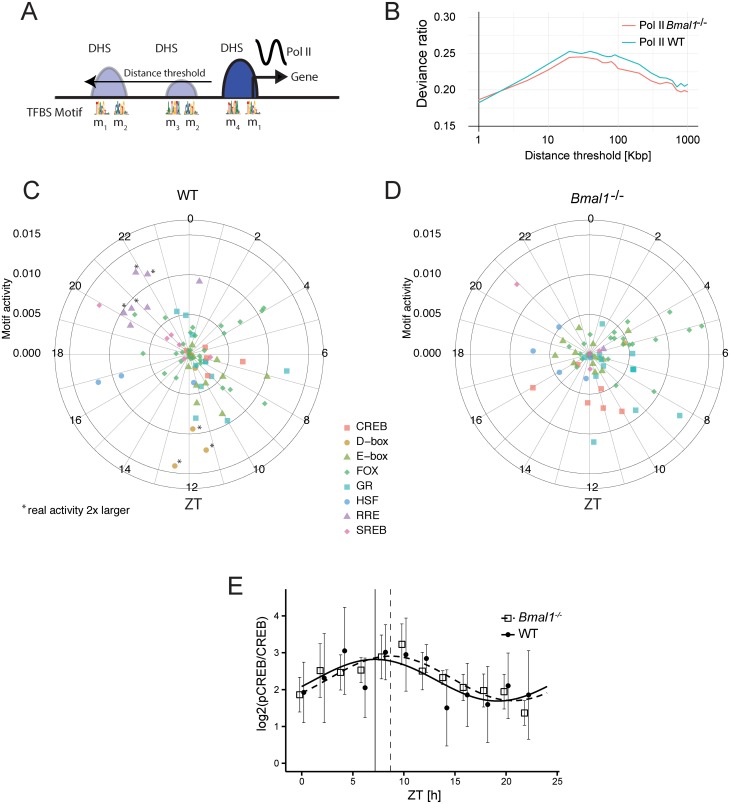
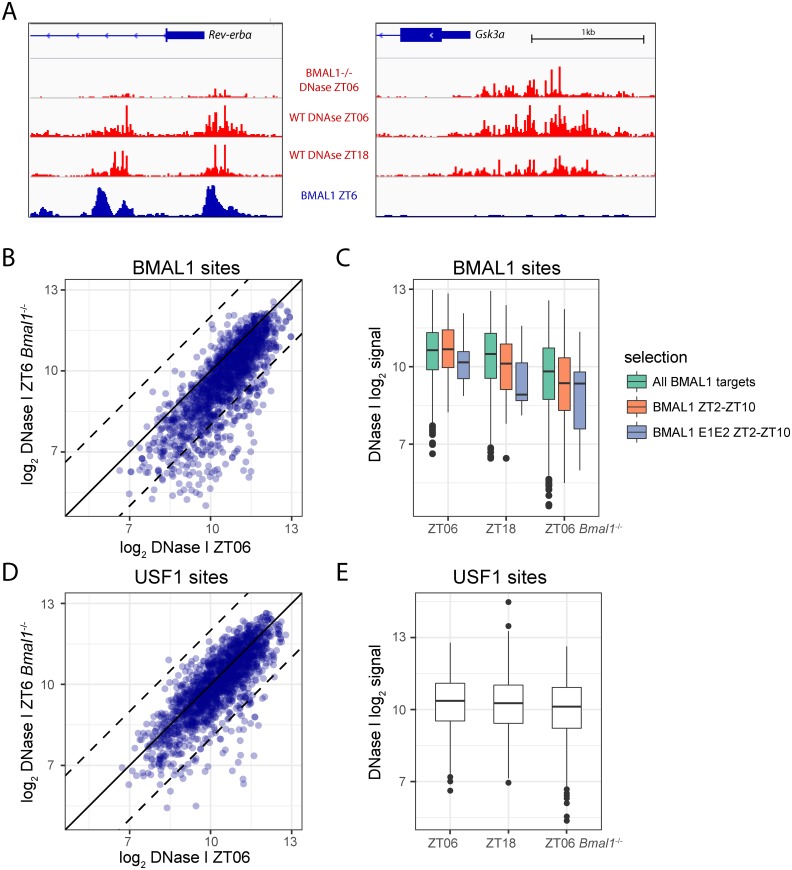
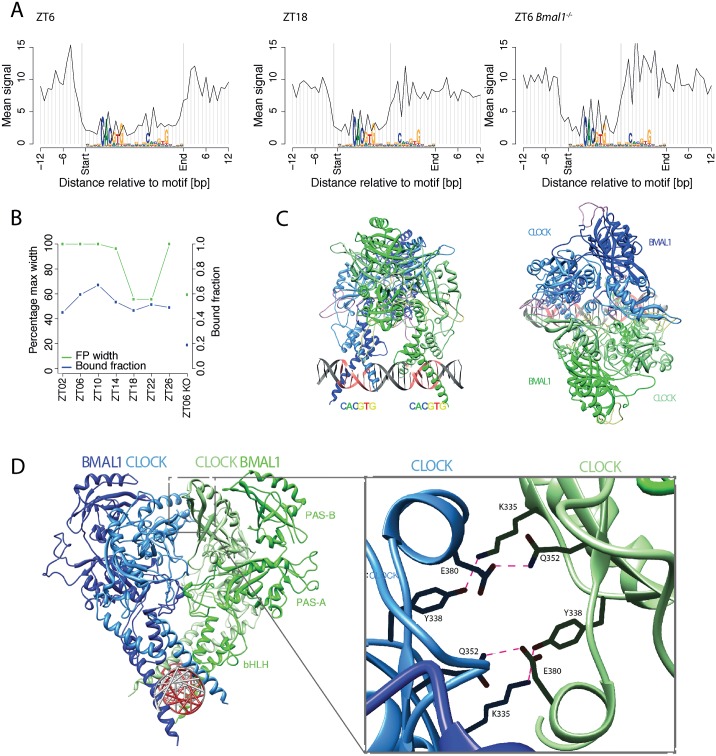
Many organisms exhibit temporal rhythms in gene expression that propel diurnal cycles in physiology. In the liver of mammals, these rhythms are controlled by transcription-translation feedback loops of the core circadian clock and by feeding-fasting cycles. To better understand the regulatory interplay between the circadian clock and feeding rhythms, we mapped DNase I hypersensitive sites (DHSs) in the mouse liver during a diurnal cycle. The intensity of DNase I cleavages cycled at a substantial fraction of all DHSs, suggesting that DHSs harbor regulatory elements that control rhythmic transcription. Using chromatin immunoprecipitation followed by DNA sequencing (ChIP-seq), we found that hypersensitivity cycled in phase with RNA polymerase II (Pol II) loading and H3K27ac histone marks. We then combined the DHSs with temporal Pol II profiles in wild-type (WT) and Bmal1-/- livers to computationally identify transcription factors through which the core clock and feeding-fasting cycles control diurnal rhythms in transcription. While a similar number of mRNAs accumulated rhythmically in Bmal1-/- compared to WT livers, the amplitudes in Bmal1-/- were generally lower. The residual rhythms in Bmal1-/- reflected transcriptional regulators mediating feeding-fasting responses as well as responses to rhythmic systemic signals. Finally, the analysis of DNase I cuts at nucleotide resolution showed dynamically changing footprints consistent with dynamic binding of CLOCK:BMAL1 complexes. Structural modeling suggested that these footprints are driven by a transient heterotetramer binding configuration at peak activity. Together, our temporal DNase I mappings allowed us to decipher the global regulation of diurnal transcription rhythms in the mouse liver.


Conflict of interest statement

BW and FG are employess of Nestlé Institute of Health Sciences SA.

Figures

Fig 1
Fig 1. DNase I hypersensitivity is rhythmic during diurnal cycles in mouse liver.
A. DNase I hypersensitivity, RNA polymerase II (Pol II) density, and H3K27ac enrichment at the Dbp locus. The DNase I track shows the frequency at which nucleotide-resolved DNase I cuts, while H3K27ac and Pol II chromatin immunoprecipitation followed by DNA sequencing (ChIP-seq) signals are smoothed over 100 bp. All time points are overlaid. The center of each DNase I hypersensitive site (DHS)-enriched region is indicated by vertical ticks (three sites near the TSS are numbered). B. Zoom-in around the transcription start site (TSS) of Dbp (the three TSSs in A are marked) reveals DNase I cuts in between H3K27ac-marked nucleosomes. Both DNase I and H3K27ac signals are maximal at ZT6–ZT10 and minimal at ZT22, consistent with BMAL1-mediated activation of Dbp transcription (absolute signal is highest for site 2, while amplitude is highest for site 3; see panel D). The red and green lines (identical in all subgraphs) show the max signal over the time points at each position and serve as a guide to the eye. C. Quantification of read counts (in log2 units) for DNase I cuts (in windows of ±300 bp) and Pol II and H3K27Ac ChIP-seq data (in windows of ±1,000 bp) centered on the Dbp TSS using cosine fits. Cosine fits show a common estimated peak time around ZT10 (marked by the inverted triangles). Peak-to-trough amplitudes are about 16-fold for Pol II and approximately 4-fold for both DNase I and H3K27ac. D. Phases and amplitudes of all DHS sites located in the neighborhood of the Dbp gene (nearest TSS association according to annotation). Distances from the center of the plot indicate fitted log2 amplitudes, and angles (clockwise from ZT0) indicate peak times. We observed that all regions oscillate around a common phase of ZT10. Of the three sites near the TSS (numbered 1–3), site 3 has the highest amplitude. E–H. Idem as A–D but for Npas2, which has an opposite phase to Dbp (i.e., Npas2 peaks near ZT22). Oscillatory amplitudes are generally larger for Npas2 compared to Dbp. G shows quantification of the signal at the TSS as in panel C.
Fig 2
Fig 2. Location-dependent footprint characteristics of DNase I Hypersensitive Sites (DHSs).
A. Visualization of DNase I signal (red) around the Rev-erbα promoter with the footprints (detected by Wellington) annotated in black, on top. This region contains BMAL1-binding sites (blue) with E-box motifs, annotated on the bottom line, which is marked by a characteristic footprint. The DNase I cleavage pattern is lower at the binding site, reflecting protection of the DNA from digestion, whereas high signals are observed on the edges of the binding site. B. Number of footprints within DHSs (±300 bp around the peak center). TSS regions contain more footprints on average. More than half of distal regions contain a footprint. C. Number of footprints detected in DHSs in function of (relative) H3K36me3 signal [12].
Fig 3
Fig 3. Genome-wide rhythms in DNase I signals are synchronous with RNA Polymerase II (Pol II) transcription and histone acetylation.
A. Number of DNase I hypersensitive sites (DHSs) with statistically significant cycling DNase I signals (left), H3K27ac signals (middle), or Pol II signals (right) at three different thresholds (p < 0.1, p < 0.05 and p < 0.01, harmonic regression), partitioned according to their genomic location: TSS (1 kb), proximal (1–10 kb from TSS), or distal (>10 kb from TSS). B. Comparison of log2 amplitudes for DHSs in each class (TSS, proximal, and distal) and in each signal (Pol II, H3K27ac, and DNase I). We selected 4,606 sites (FDR < 0.05, Fisher's combined test). Higher amplitudes were observed in distal and proximal regions compared to TSSs (p < 2.2*10−16, t test). In addition, Pol II loadings showed higher peak-to-trough ratios than the two other signals. C. Circular histograms representing the distributions of phases for each mark at DHSs selected as in B. D. Comparisons of peak times between DNase I, Pol II, and H3K27ac at DHSs (DHSs selected with p < 0.05, Fisher’s combined test), diagonals are indicated in gray. Values of circular correlations are indicated (p < 10−10, circular correlation). E. Relationships of peak times between DHSs in intergenic regions with their nearest TSS (pairs selected with FDR < 0.1, Fisher’s combined test). We found 1,611 and 630 significant pairs for H3K27ac and Pol II signals, respectively.
Fig 4
Fig 4. Distal DNase I Hypersensitive Sites (DHSs) help identify diurnally active transcription regulators.
A. Scheme of the linear model to infer active transcription regulators: transcription factor (TF) motifs in DHSs within a symmetric window around active transcription start sites (TSSs) are used to explain diurnal rhythms in transcription. B. Fraction of explained temporal variance (deviance ratio) in RNA polymerase II (Pol II) loading (at the TSS of all actives genes) for WT and Bmal1-/- mice, in function of the window size (radius) for DHS inclusion, shows a maximum at around 50 kb. Here, α = 0 was used in the glmnet (Materials and methods). C–D. Inferred TF motif activities for WT and in Bmal1-/- mice shown with amplitudes (distance from center) and peak times (clockwise, ZT0 at the top) using a window size of 50 kb. All 819 (WT) and 629 (Bmal1-/-) motifs (overlap is 427) with nonzero activities are shown. Note though that most activities are very small and cluster in the center. Certain families of TFs are indicated in colors (full results are provided in S4 Table). Radial scale for activities is arbitrary but comparable in C and D. E. Quantification of western blots for pCREB (Ser 133 phosphorylation) and CREB in WT and Bmal1-/- genotypes (log2 (pCREB/CREB)). Nuclear extracts from four independent livers were harvested every 2 h. Both genotypes showed a significant oscillation (p < 0.05, harmonic regression) of the mean signal from the four mice. Though the peak time in Bmal1-/- mice is delayed by 1.8 h, the comparison of the rhythm in the two genotypes was not significant (p = 0.49, Chow test). Individual blots are shown in S7 Fig.
Fig 5
Fig 5. Chromatin accessibility in Bmal1-/- mice at ZT6 is generally similar as in the Wild-Type (WT) mice but is lower at BMAL1 sites.
A. The Rev-erbα (left) and Gsk3a (right) promoters. DNase I signal (in red) is strongly reduced in Bmal1-/- mice at sites bound by CLOCK:BMAL1 in WT mice (BMAL1 chromatin immunoprecipitation followed by DNA sequencing (ChIP-seq) signal in blue) in the Rev-erbα promoter but is similar in WT and Bmal1-/- mice at the Gsk3a promoter that are not bound by BMAL1. The vertical scale is the same for all three DNase I tracks, as well as for both BMAL1 ChiP-seq tracks. Wild-type ZT18 signals are lower (about half) than at ZT6 in both genes but not as low as in the Bmal1-/- mice. B. Comparison of DNase I signals at ZT6 in Bmal1-/- versus WT mice. All DNase I hypersensitive sites (DHSs) overlapping BMAL1 ChIP-seq peaks in [17] are shown (n = 1,555). The dashed lines indicate 4-fold difference. C. Boxplots showing DNase I intensity at the same sites as in B, at peak (ZT6) and trough (ZT18) activities of BMAL1 in the WT, and at ZT6 in Bmal1-/- mice for all BMAL1-binding sites (green), BMAL1 sites with an associated expression phase between ZT2 and ZT10 (orange), and with a tandem E-box (grey). All pairwise comparisons (within the same color) between either ZT6 versus ZT18 or ZT6 versus ZT6 Bmal1-/- are significant (p < 0.001). D–E. Same as B–C but using overlap with USF1 ChIP-seq peaks [74] to select DHSs (n = 1,705).
Fig 6
Fig 6. BMAL1 footprints indicate temporally changing protein–DNA complexes, consistent with binding of a heterotetramer to DNA.
A. Genomic profiles of DNase I cuts around double E-boxes with a spacer of 6 bp (E1-E2 sp6). We selected n = 249 E1-E2 sp6 motifs overlapping a BMAL1 chromatin immunoprecipitation followed by DNA sequencing (ChIP-seq) peak and show the average of profiles for loci classified as bound by the mixture model (posterior probability >0.5). At ZT6, we observed that nucleotides around both E-boxes are protected. In contrast, at ZT18, the width of the protected region is reduced by approximately half, with the second E-box no longer protected from digestion. The signals are anchored to the motif position. Orientation of sites and signals is according to the best match to the E1-E2 sp6 motif. In Bmal1-/-, only one E-box appears occupied. B. Width (left-side y-axis, green) of the protected region in WT and in Bmal1-/- mice for E1-E2 sp6 motifs occupied by BMAL1. Fraction of predicted occupied sites is shown in blue (right-side y-axis). C. Two views of the 3-D computational model of the CLOCK:BMAL1 heterotetramer showing two heterodimers of CLOCK:BMAL1 occupying an E1-E2 sp6 site. The two heterodimers are shown in green and blue, while darker green and darker blue correspond to BMAL1 and lighter colors to CLOCK proteins. Information content along the DNA strands is shown in grey with highly constrained nucleotides of the motif in red. D. Zoom on the interacting residuals on the PAS-B domain of CLOCK implicated in the heterotetramer formation.

References

    1. Green CB, Takahashi JS, Bass J (2008) The meter of metabolism. Cell 134: 728–742. 10.1016/j.cell.2008.08.022 - DOI - PMC - PubMed
    1. Dibner C, Schibler U, Albrecht U (2010) The mammalian circadian timing system: organization and coordination of central and peripheral clocks. Annu Rev Physiol 72: 517–549. 10.1146/annurev-physiol-021909-135821 - DOI - PubMed
    1. Kornmann B, Schaad O, Bujard H, Takahashi JS, Schibler U (2007) System-driven and oscillator-dependent circadian transcription in mice with a conditionally active liver clock. PLoS Biol 5: e34 10.1371/journal.pbio.0050034 - DOI - PMC - PubMed
    1. Lamia KA, Storch KF, Weitz CJ (2008) Physiological significance of a peripheral tissue circadian clock. Proc Natl Acad Sci U S A 105: 15172–15177. 10.1073/pnas.0806717105 - DOI - PMC - PubMed
    1. Vollmers C, Gill S, DiTacchio L, Pulivarthy SR, Le HD, et al. (2009) Time of feeding and the intrinsic circadian clock drive rhythms in hepatic gene expression. Proc Natl Acad Sci U S A 106: 21453–21458. 10.1073/pnas.0909591106 - DOI - PMC - PubMed

Publication types

MeSH terms