. 2017 Apr 17;11(4):e0005552.
doi: 10.1371/journal.pntd.0005552. eCollection 2017 Apr.

Trypanosoma brucei TbIF1 inhibits the essential F1-ATPase in the infectious form of the parasite

Affiliations

Trypanosoma brucei TbIF1 inhibits the essential F1-ATPase in the infectious form of the parasite

Brian Panicucci et al. PLoS Negl Trop Dis. .

Abstract

The mitochondrial (mt) FoF1-ATP synthase of the digenetic parasite, Trypanosoma brucei, generates ATP during the insect procyclic form (PF), but becomes a perpetual consumer of ATP in the mammalian bloodstream form (BF), which lacks a canonical respiratory chain. This unconventional dependence on FoF1-ATPase is required to maintain the essential mt membrane potential (Δψm). Normally, ATP hydrolysis by this rotary molecular motor is restricted to when eukaryotic cells experience sporadic hypoxic conditions, during which this compulsory function quickly depletes the cellular ATP pool. To protect against this cellular treason, the highly conserved inhibitory factor 1 (IF1) binds the enzyme in a manner that solely inhibits the hydrolytic activity. Intriguingly, we were able to identify the IF1 homolog in T. brucei (TbIF1), but determined that its expression in the mitochondrion is tightly regulated throughout the life cycle as it is only detected in PF cells. TbIF1 appears to primarily function as an emergency brake in PF cells, where it prevented the restoration of the Δψm by FoF1-ATPase when respiration was chemically inhibited. In vitro, TbIF1 overexpression specifically inhibits the hydrolytic activity but not the synthetic capability of the FoF1-ATP synthase in PF mitochondria. Furthermore, low μM amounts of recombinant TbIF1 achieve the same inhibition of total mt ATPase activity as the FoF1-ATPase specific inhibitors, azide and oligomycin. Therefore, even minimal ectopic expression of TbIF1 in BF cells proved lethal as the indispensable Δψm collapsed due to inhibited FoF1-ATPase. In summary, we provide evidence that T. brucei harbors a natural and potent unidirectional inhibitor of the vital FoF1-ATPase activity that can be exploited for future structure-based drug design.


Conflict of interest statement

The authors have declared that no competing interests exist.

Figures

Fig 1
Fig 1. TbIF1 shares homology with IF1 proteins from various model organisms.
Using the alignment program MAFFT, the amino acid sequence of IF1 from T. brucei (Tb) is compared to those of Solanum tuberosum (St, [20]), Saccharomyces cerevisiase (Sc, [22]), Caenorhabditis elegans (Ce, [21]), Human sapiens (Hs, [44]) and Bos taurus (Bs, [19]) IF1s. Identical and conservatively substituted resides are shaded in black and grey, respectively. Predicted mt import signal sequences were removed from each coding sequence prior to the analysis. The minimal inhibitory sequence [42] and dimerization domain of bovine IF1[45] are indicated. The green, yellow, and red bars above the alignment indicate when the nucleotides at each position have identities of 100%, between 100% and 30%, and <30%, respectively.
Fig 2
Fig 2. TbIF1 expression is only detected in PF T. brucei, where it is localized to the mitochondrion.
(A) The steady state abundance of TbIF1 was determined in T. brucei PF427, BF427 and Dk164 whole cell lysates by western blot analysis using a specific polyclonal anti-TbIF1 antiserum. An anti-APRT1 antiserum was used to estimate equal protein loading on SDS-PAGE. The molecular weight of the detected proteins is indicated on the left. (B) TbIF1 subcellular localization was determined in PF 29–13 and PF TbIF1 OE cells either noninduced (NON) or expressing V5-tagged TbIF1 for 48 hours (IND 48h). Whole cell lysates (WCL) and digitonin extracted cytosolic (CYT) and organellar (ORG) fractions were analyzed by immunoblot with the following antibodies: anti-APRT (cytosol), anti-mtHsp70 (organellar fraction), anti-V5 and anti-TbIF1. (C) Immunofluorescence assays with a fluorescein isothiocyanate (FITC)-conjugated secondary antibody that recognizes primary antibodies detecting either all TbIF1 variants (anti-TbIF1) or just the ectopic V5-tagged TbIF1 (anti-V5) further verify that the protein is targeted to the mitochondrion in PF TbIF1 OE cells induced for 48 hours (IND 48h). Noninduced (NON) PF TbIF1 OE cells were included as a control, while the DNA contents and single reticulated mitochondrion were visualized using DAPI (4,6-diamidino-2-phenylindole) and MitoTracker Red CMXRos staining, respectively. The overall cell morphology is depicted in the differential interference contrast (DIC) microscopy images.
Fig 3
Fig 3. Neither TbIF1 silencing nor overexpression are harmful to PF T. brucei cells grown in vitro.
(A) TbIF1 RNAi noninduced (NON) and induced (IND) cells were maintained in the exponential growth phase (between 106 and 107 cells/ml) and the cumulative cell number represents the normalization of cell densities by factoring in the daily dilution factor. The figure is representative of three independent RNAi inductions. B) The growth rate of cells either induced (IND) or noninduced (NON) for TbIF1 OE were determined in the same manner as in A. C) The steady-state abundance of TbIF1 in the parental cell line (29–13), TbIF1 RNAi noninduced (NON) and cells induced (IND) with tet for 1, 2, 3 and 4 days was determined by western blot analysis using a specific TbIF1 antiserum. Cytosolic enolase served as a loading control. The numbers depicted underneath the top panel represent the abundance of immunodetected protein as a percentage of the noninduced samples after normalizing to the loading control. D) Ectopic V5-tagged TbIF1 expression was confirmed by western blot analysis using whole cell lysates from PF 29–13, noninduced (NON) TbIF1 OE and cells induced (IND) for 1, 2, 3 and 4 days. The endogenous TbIF1 and the V5-tagged ectopic protein were visualized using a polyclonal TbIF1 antiserum. Comparable loading was confirmed by Bio-Rad TGX stain-free technology. Levels of V5-tagged TbIF1 overexpression as compared to the endogenous TbIF1 are indicated at the top of the immunoblot.
Fig 4
Fig 4. Upon chemical inhibition of respiration, TbIF1 prevents the establishment of a new FoF1-ATPase mediated Δψm.
(A) and (D) The in situ dissipation of the Δψm in response to chemical treatment by NaCN was measured using the safranine O dye in the following cell lines: 29–13 (black line), TbIF1 RNAi noninduced (NON, grey line), TbIF1 RNAi induced for 2 and 4 days (IND2 and IND4, red lines), TbIF1 OE noninduced (NON, dark blue line) and TbIF1 OE induced for 2 days (IND2, light blue line). The reaction was initiated with digitonin (50 μM), whereas NaCN (50 μM) and FCCP (20 μM) were added when indicated. (means ± s.d.; n = 3). (B) and (E) The assay described for (A) and (D) was used to observe the dissipation of the Δψm when the same cells were simultaneously treated with 50 μM NaCN and 2.5 μg/ml oligomycin (NaCN+OM). (means ± s.d.; n = 3). (C) and (F) Changes in safranine O fluorescence after the addition of either NaCN or NaCN+OM to the cell lines outlined above. *** p < 0.0002, Student’s t test.
Fig 5
Fig 5. TbIF1 functions as a unidirectional inhibitor of T. brucei FoF1-ATP synthase.
(A) Total ATPase activity was measured in TbIF1 OE cells that were noninduced (grey) or induced for 2 days with tet (grey cross-hatch). To define the contribution of FoF1-ATPase to the total ATPase activity measured, samples were also incubated with either azide (AZ, 1 mM) or oligomycin (OM, 2.5 μg/ml). The total amount of free-phosphate detected in the untreated noninduced sample was set at 100%. (means ± s.d.; n = 3; ** p < 0.001; Student’s t test). (B) The amount of ATP synthesized by oxidative phosphorylation was measured in the digitonin-extracted mitochondria from both noninduced (NON) TbIF1 OE cells and cells induced for 2 days (IND2). The reaction was started by the addition of succinate and ADP. Malonate (mal.) and atractyloside (atract.) were added as specific inhibitors of succinate dehydrogenase and the ATP/ADP carrier, respectively.
Fig 6
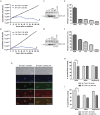
Fig 6. Overexpression of TbIF1 significantly affects the viability of BF and Dk cells due to the dramatic decrease of the Δψm when FoF1-ATPase is inhibited.
(A, B) Growth curves of noninduced and tet induced BF (A) and Dk (B) TbIF1 OE cells. Cultures were maintained in the exponential growth phase (between 105 and 106 cells/ml) and the figure is representative of three independent tet inductions. (C, D) Western blot analysis of TbIF1_V5 immunoprecipitated with a V5 monoclonal antibody from BF (C) and Dk (D) TbIF1 OE cells that were noninduced (N) or induced for 12, 24 or 36 hours. The purified protein samples were probed with a polyclonal antiserum raised against TbIF1 and the asterisk identifies a nonspecific band that serves as a loading control. The no mAb lane represents nonspecific proteins isolated during an immunoprecipitation step that omitted the V5 antibody. (E, F) Using flow cytometry and the fluorescent dye TMRE, the in vivo Δψm was measured in BF (E) and Dk (F) TbIF1 OE cells that were either not induced or induced for 4, 12 or 24 hours. A noninduced sample was also treated with FCCP to demonstrate that the assay was specifically measuring the Δψm. (means ± s.d.; n = 3). (G) Immunofluorescence of noninduced (NON) or induced (IND 24h) BF TbIF1 OE cells reveals an unchanged overall mt morphology upon TbIF1 induction. Mitochondria were visualized by immunostaining with an anti-mtHsp70 antibody (green) and by staining with MitoTracker Red CMXRos (red), a fluorescentdye that is Δψm dependent. DNA contents are stained with DAPI (blue) and the morphology of the cells was visualized using DIC imaging. (H, I) Total ATPase activity was quantified in crude mitochondrial preparations isolated from BF (H) and Dk (I) TbIF1 OE cells that were tet induced for 12 hours or not at all. Replicates of these samples were also treated either with oligomycin (OM, 2.5 μg/ml) or azide (AZ, 1 mM) to determine the proportion of this activity generated by FoF1-ATPase. (means ± s.d.; n = 3; ** p < 0.01; Student’s t test)
Fig 7
Fig 7. Recombinant TbIF1 inhibits the FoF1-ATPase activity in vitro.
Mitochondria isolated from wildtype PF427 cells were lysed with dodecyl maltoside and the ATPase activity was measured by a Pullman assay. These samples were either treated with azide (AZ, 2 mM), oligomycin (OM, 50 μM) or the indicated rTbIF1 concentrations. (means ± s.d.; n > 3).

Similar articles

Cited by

References

    1. Matthews KR (2015) 25 years of African trypanosome research: From description to molecular dissection and new drug discovery. Mol Biochem Parasitol 200: 30–40. 10.1016/j.molbiopara.2015.01.006 - DOI - PMC - PubMed
    1. Matthews KR (2005) The developmental cell biology of Trypanosoma brucei. J Cell Sci 118: 283–290. 10.1242/jcs.01649 - DOI - PMC - PubMed
    1. Tielens AG, Van Hellemond JJ (1998) Differences in energy metabolism between trypanosomatidae. Parasitol Today 14: 265–272. - PubMed
    1. van Hellemond JJ, Opperdoes FR, Tielens AG (2005) The extraordinary mitochondrion and unusual citric acid cycle in Trypanosoma brucei. Biochem Soc Trans 33: 967–971. 10.1042/BST20050967 - DOI - PubMed
    1. Bringaud F, Riviere L, Coustou V (2006) Energy metabolism of trypanosomatids: adaptation to available carbon sources. Mol Biochem Parasitol 149: 1–9. 10.1016/j.molbiopara.2006.03.017 - DOI - PubMed

Publication types

MeSH terms

LinkOut - more resources