. 2017 Apr 17;13(4):e1006729.
doi: 10.1371/journal.pgen.1006729. eCollection 2017 Apr.

Neuronal cell fate specification by the molecular convergence of different spatio-temporal cues on a common initiator terminal selector gene

Affiliations

Neuronal cell fate specification by the molecular convergence of different spatio-temporal cues on a common initiator terminal selector gene

Johannes Stratmann et al. PLoS Genet. .

Abstract

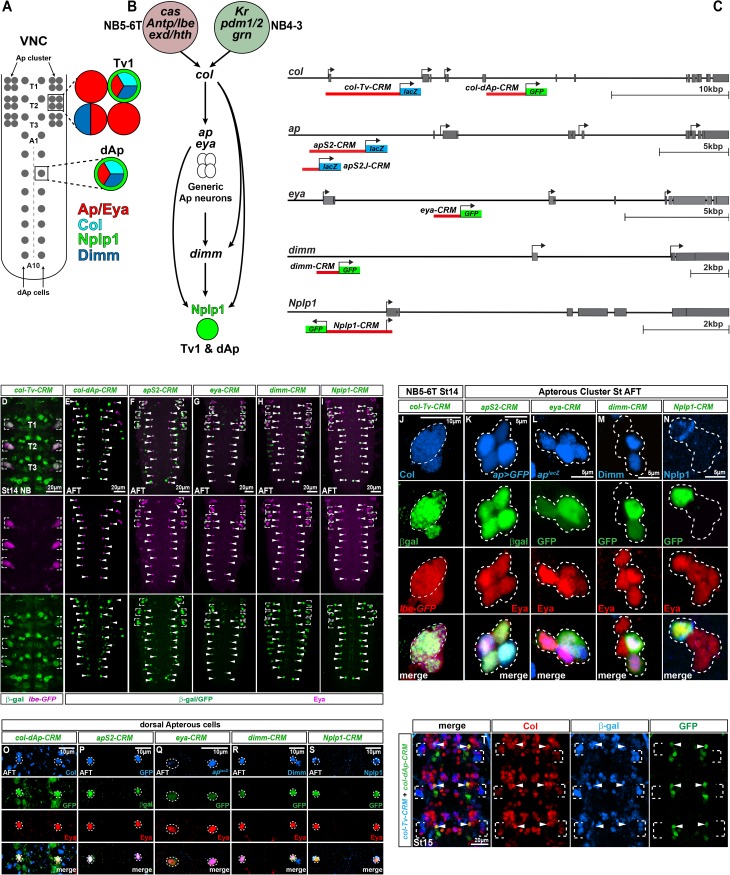
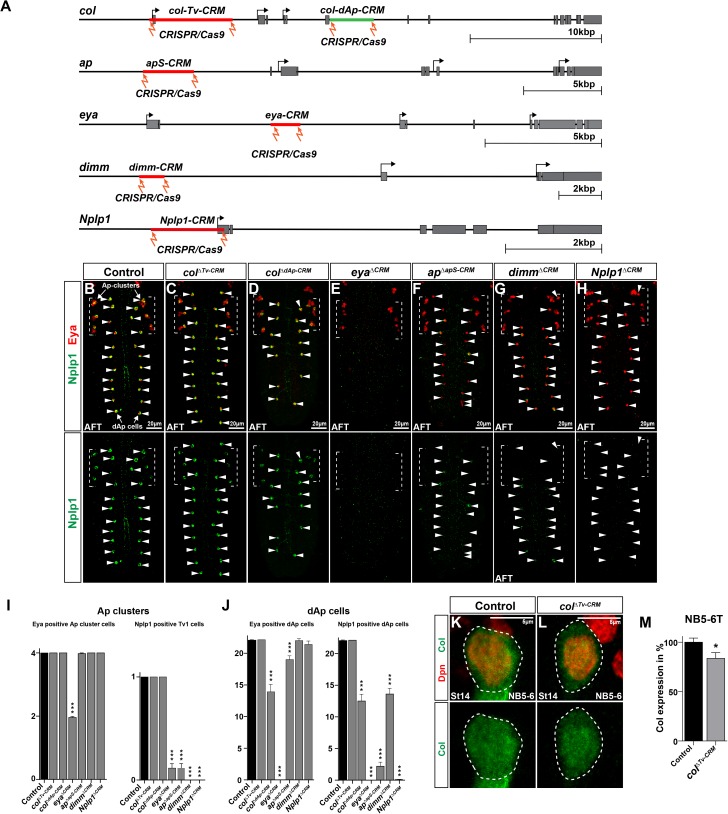
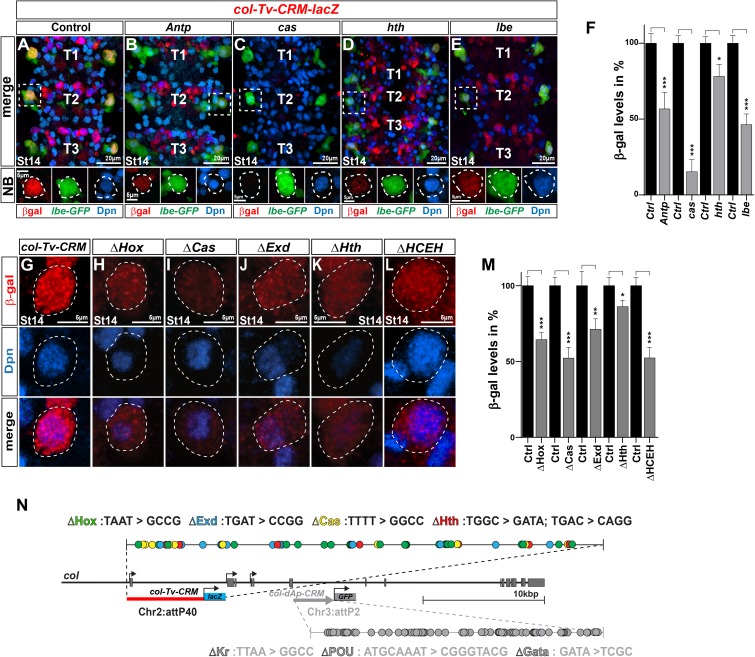
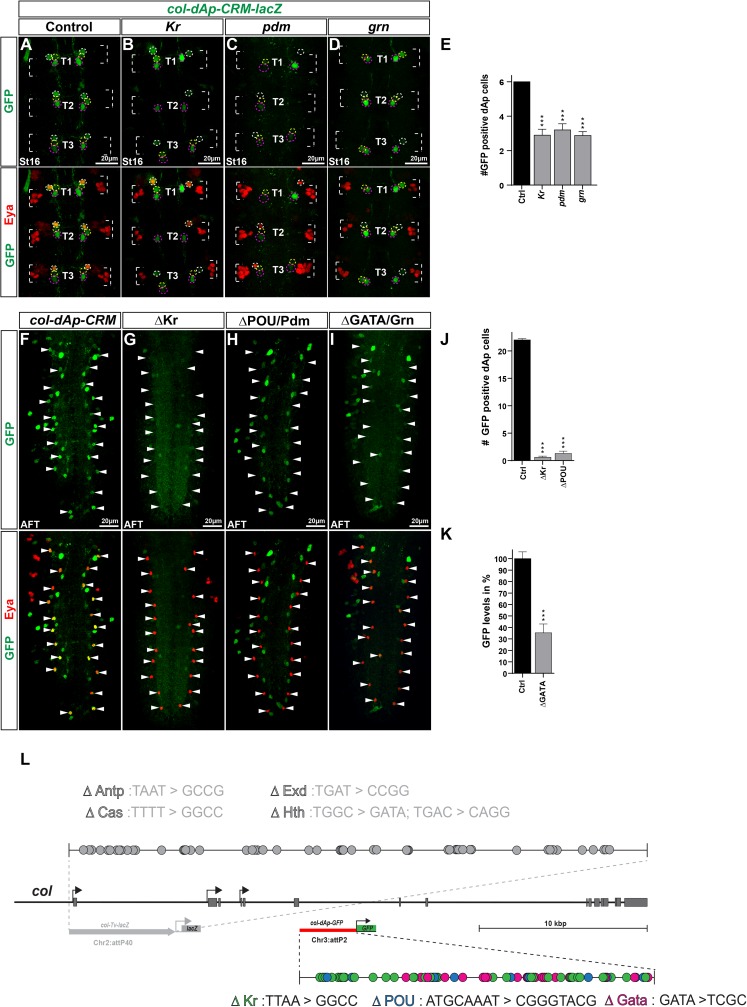
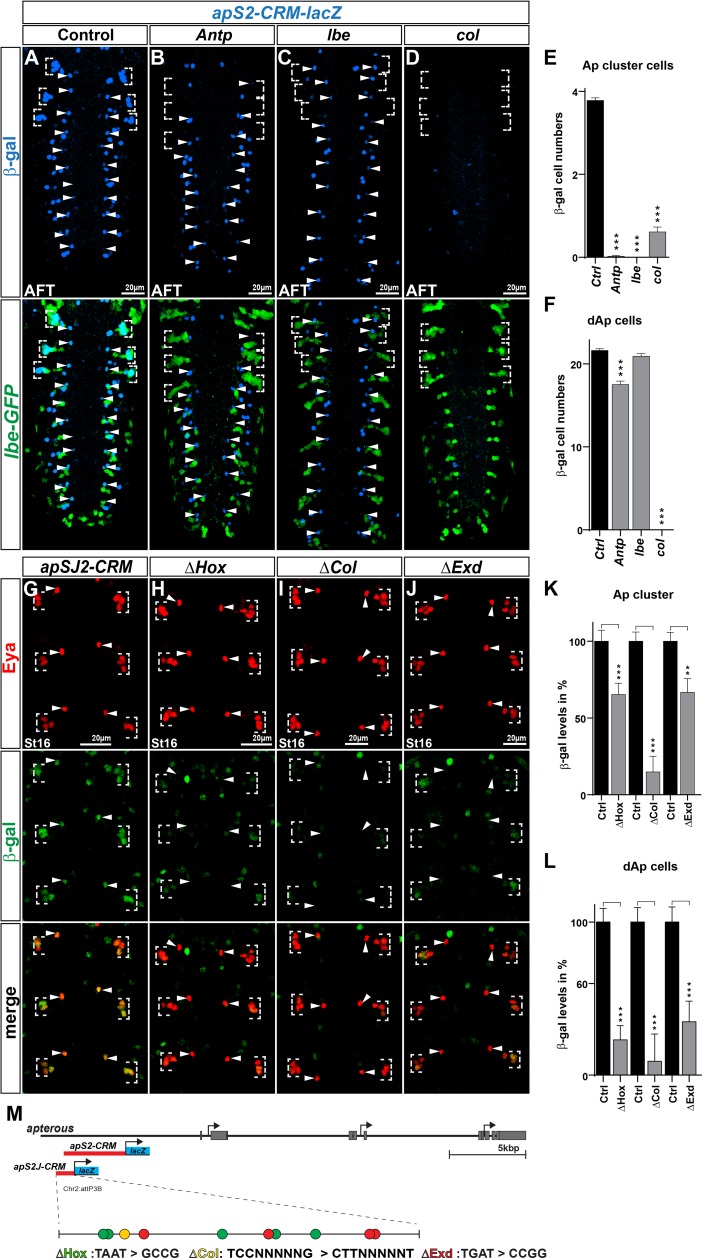
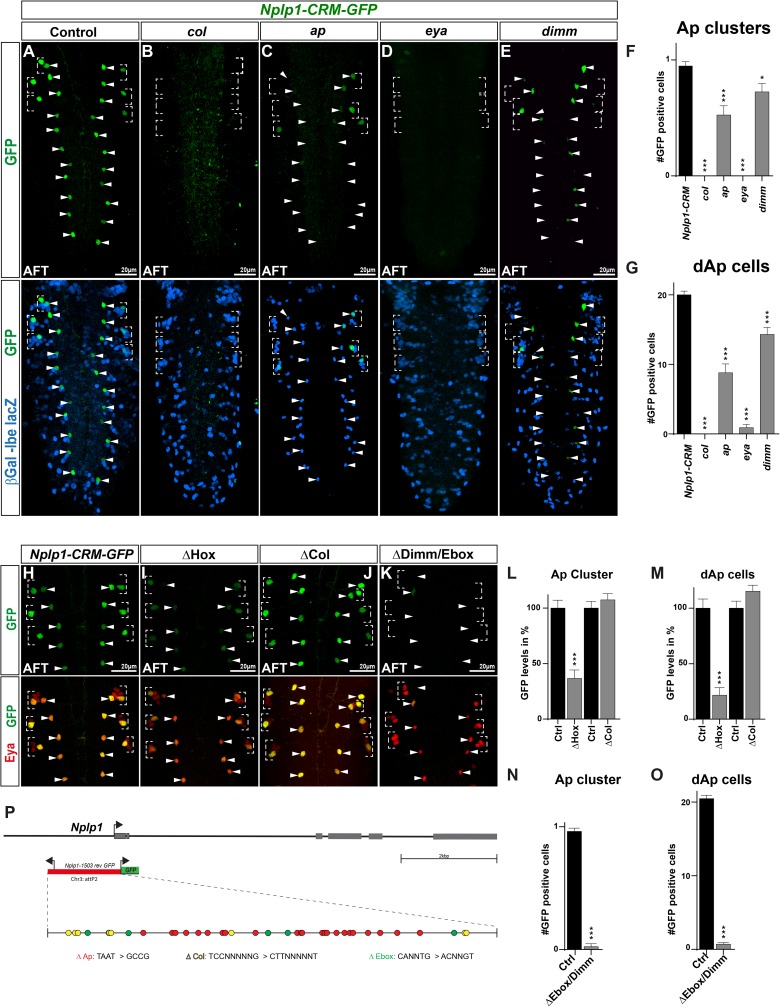
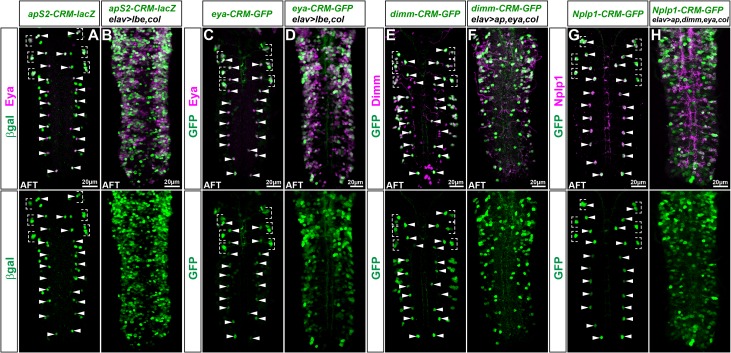
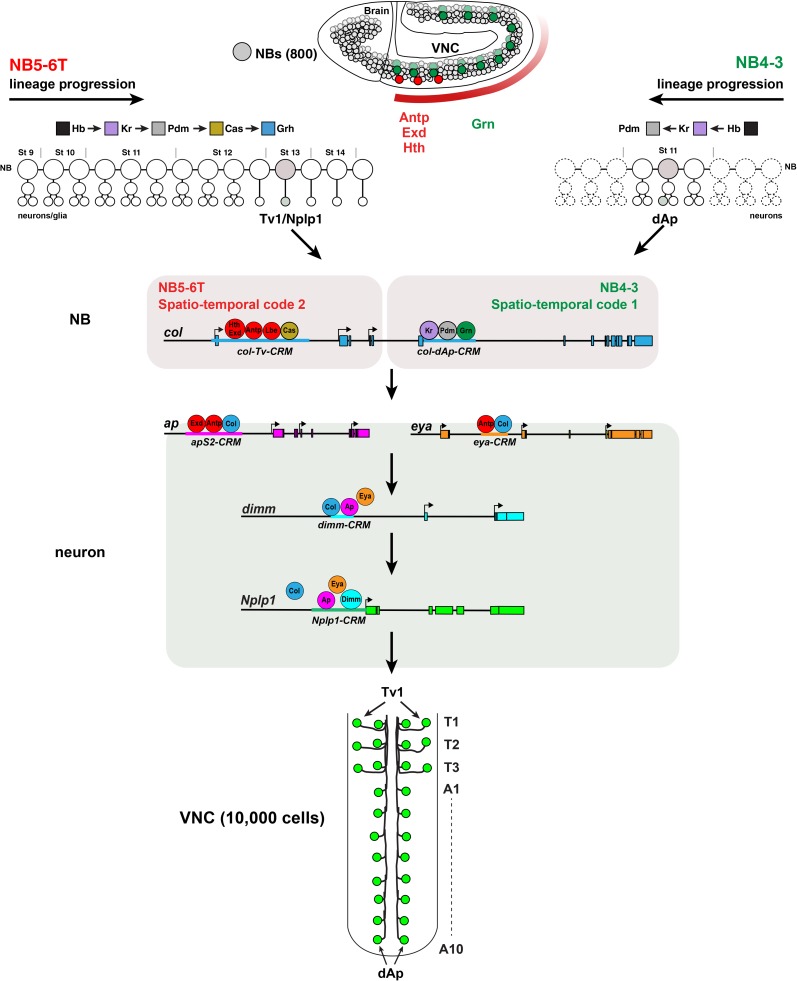
The extensive genetic regulatory flows underlying specification of different neuronal subtypes are not well understood at the molecular level. The Nplp1 neuropeptide neurons in the developing Drosophila nerve cord belong to two sub-classes; Tv1 and dAp neurons, generated by two distinct progenitors. Nplp1 neurons are specified by spatial cues; the Hox homeotic network and GATA factor grn, and temporal cues; the hb -> Kr -> Pdm -> cas -> grh temporal cascade. These spatio-temporal cues combine into two distinct codes; one for Tv1 and one for dAp neurons that activate a common terminal selector feedforward cascade of col -> ap/eya -> dimm -> Nplp1. Here, we molecularly decode the specification of Nplp1 neurons, and find that the cis-regulatory organization of col functions as an integratory node for the different spatio-temporal combinatorial codes. These findings may provide a logical framework for addressing spatio-temporal control of neuronal sub-type specification in other systems.


Conflict of interest statement

The authors have declared that no competing interests exist.

Figures

Fig 1
Fig 1. Identification of enhancers for the Nplp1 specification cascade.
(A) Model of the Drosophila VNC at stage AFT, with focus on the thoracic Ap clusters and the dorsal Ap cells (dAp), together with corresponding markers expressed at stage AFT i.e. Col, Ap/Eya, Dimm and Nplp1. (B) Showing the feedforward regulatory cascade critical for terminal specification of both the Tv1/Nplp1 and dAp/Nplp1. In Tv1 specification col is activated by spatial input via Antp, lbe, hth/exd together with temporal input from cas. In dAp specification col is activated via the temporal factors Kr, pdm1/2 together with spatial input from grn. Once col is activated in both cell subtypes, the same Nplp1 terminal selector cascade is triggered in both dAp and Tv1 to specify the Nplp1 cell fate. (C) Enhancer-reporter constructs used to study cell type specific expression of the factors critical during Nplp1 cell fate specification in both dAp and Tv1 cells. col expression is under the control of two different enhancers. Expression of col in the NB5-6T is controlled by the col-Tv-CRM while col expression in the dAp cells is controlled by the col-dAp-CRM. For ap enhancer studies we used two different enhancer fragments. To test the enhancer in mutant background we used the apS2-lacZ and for mutation of transcription factor binding sites the shorter apSJ2-lacZ was used. The Nplp1-CRM contains the promoter for Nplp1, and in order to avoid ectopic expression of GFP from the Nplp1 promoter, the DNA sequence of the Nplp1-CRM was placed in reverse orientation in front of the GFP reporter. (D) Staining of the col-Tv-CRM reporter construct in T1-T3 for β-gal and lbe(K)-GFP (NB5-6T) (false colored) shows that the col-Tv-CRM drives reporter expression broadly in the thoracic region but also specifically in the NB5-6T. (E-I) Staining for β-gal or GFP as a readout of enhancer activity and Eya as a location marker on whole VNCs shows overlap between the reporter expression and the Ap (both Ap cluster and dAp) cells. (J) Zoom in on the NB5-6T shows a robust overlap between the col-Tv-CRM and endogenous Col expression at stage14. (K-N) Detailed analysis of the enhancer expression in the Ap cluster at stage AFT shows a precise overlap between the apS, eya, dimm and Nplp1 enhancer-reporter constructs and endogenous gene expression (compare to A). (O-S) Detailed analysis of the enhancer expression in the dAp cells at stage AFT shows a precise overlap between the col-dAp, apS, eya, dimm and Nplp1 enhancer-reporter constructs and endogenous gene expression. (T) Triple stain at St15 for β-gal, GFP and Col, for the col-Tv-CRM and col-dAp-CRM, reveals that the separate col enhancer fragments do not overlap and show cell type specific reporter expression. Both fragments show overlapping activity with endogenous col expression. Genotypes: (D, J) col-CRM-lacZ/lbe(K)-GFP. (E) col-dAp-CRM-GFP. (F) apS-CRM-lacZ. (G) eya-CRM-GFP. (H, M, R) dimm-CRM-GFP. (I, N, S) Nplp1-CRM-GFP. (K, P) ap-Gal4>UAS-eGFP; apS2-CRM/+. (L, Q) aprK568/+; eya-CRM/+. (T) col-CRM-lacZ/+; col-dAp-CRM-GFP/+.
Fig 2
Fig 2. CRISPR/Cas9 deletion of enhancers affects Tv1 and dAp specification.
(A) Schematic representation of the CRISPR/Cas9 mutant experiments, showing the gene loci of the genes which are part of the terminal selector cascade of Nplp1 cell fate specification in Tv1 and dAp cells. Red bars represent the location of the identified enhancers. In the col gene, two independent enhancers were identified, in red the col-Tv-CRM, active in the NB5-6T and the Ap cluster (compare to Fig 1T) and in green the col-dAp-CRM specifically active in NB4-3 and the dAp cells. “Lightning bolts” represent the location to which the Cas9 protein is guided by gRNAs in order to induce enhancer deletions. (B-H) Whole VNC scans showing Eya and Nplp1 expression in control and CRM mutants for the identified enhancers. (I) Quantification of Eya and Nplp1 expressing cells in the Ap cluster, in control and CRM mutants. eyaΔCRM mutants show a significant decrease in the number of Eya positive Ap cluster cells, while the other mutants have no impact on Eya cell numbers in the Ap clusters. eyaΔCRM, apΔapS-CRM, dimmΔCRM and Nplp1ΔCRM mutants all affect Nplp1 expression in Tv1 (*** p≤0.0001, n≥44 clusters, Students t-test, +/- SEM). (J) Quantification of Eya and Nplp1 positive dAp cells in control and CRM mutants. colΔdAp-CRM, eyaΔCRM, and apΔapS-CRM show significant decrease in Eya positive dAp cells, while colΔTv-CRM, dimmΔCRM and Nplp1ΔCRM mutants show no effect. In contrast, all CRM mutants shows significantly reduced numbers of Nplp1 positive dAp cells (*** p≤0.0001, n = 10 embryos, Students t-test, +/- SEM). (K-L) Staining for Col and Dpn in the NB5-6 at St14, in control and colΔTv-CRM mutants. (M) Quantification of Col expression levels in the NB shows that Col levels are significantly reduced by 17% in colΔTv-CRM mutants (* p = 0.013, n = 36 NBs, Students t-test, +/- SEM). Genotypes: (B, K) OregonR. (C, L) colΔTv-CRM. (D) colΔdAp-CRM. (E) eyaΔCRM. (F) apΔapS-CRM. (G) dimmΔCRM. (H) Nplp1ΔCRM.
Fig 3
Fig 3. col-Tv enhancer analysis.
(A-E) T1-T3 region of the Drosophila VNC and a zoom-in on the NB5-6 at stage 14, stained for Dpn, lbe(K)-GFP and β-gal to show the activity of the col-Tv-CRM-lacZ fragment under (A) control conditions and (B-E) in different mutant backgrounds for col upstream activators in NB5-6 i.e., Antp, hth, cas and lbe. Reporter expression under control of the col-Tv-CRM shows reduced expression in all mutant backgrounds. (F) Quantification of β-gal levels from the col-Tv-CRM in NB5-6 at stage 14 in different mutant backgrounds, shows that all mutant backgrounds affect the col-Tv-CRM activity and β-gal levels are reduced significantly compared to each control (*** p≤0.0001, * p≤0.01, n≥30 NBs, Students t-test, +/- SEM). (G-L) Staining for β-gal and Dpn of the NB5-6 at stage14, to assess the col-Tv-CRM activity of (G) the col-Tv-CRM wild type fragment and (H-L) the col-Tv-CRM with mutated potential binding sites for the col upstream activators (indicated by Δ). (L) ΔHCEH denotes a col-Tv-CRM fragment with all potential binding sites mutated (Δ Hox, Cas, Exd, Hth). (M) Quantification of the β-gal levels in the NB5-6 shows that all col-Tv-CRM fragments with mutated binding sites for col upstream activators, show a significant decrease in activity compared to control levels. (*** p≤0.0001, ** p≤0.001, * p≤0.05, n≥30 NBs, Students t-test, +/- SEM). (N) Schematic representation of the col genetic locus together with the position of the col-Tv-CRM fragment. Color coded dots represent potential transcription factor binding sites (TFBS) found in the col-Tv-CRM fragment, together with the conversion pattern, which was used to mutated the potential binding sites. Chr2:attP40 denotes the landing sites at which all, col-CRM as well as col-Tv-CRM ΔTFBS constructs are landed in the fly genome. Genotypes: (A, G) col-Tv-CRM/lbe(K)-GFP. (B) col-Tv-CRM/lbe(K)-GFP; Antp12/Antp25. (C) col-Tv-CRM/lbe(K)-GFP; casΔ1/casΔ3. (D) col-Tv-CRM/lbe(K)-GFP; hthDf7637/hth5E04. (E) col-Tv-CRM/lbe(K)-GFP; lbe12C5/lbeDf. (H) col-Tv-CRM-ΔHox/lbe(K)-GFP. (I) col-Tv-CRM-Δcas/lbe(K)-GFP. (J) col-Tv-CRM-Δexd/lbe(K)-GFP. (K) col-Tv-CRM-Δhth/lbe(K)-GFP. (L) col-Tv-CRM-ΔHCEH/lbe(K)-GFP.
Fig 4
Fig 4. col-dAp enhancer analysis.
(A-D) T1-T3 region of the Drosophila VNC at St16, stained for Eya and GFP to show the activity of the col-dAp-CRM-GFP fragment under (A) control conditions and (B-D) in different mutant backgrounds for col upstream activators in NB4-3 i.e., Kr, pdm and grn. GFP reporter expression under control of the col-dAp-CRM shows reduced expression in all mutant backgrounds. The col-dAp-CRM reports in the dAp cells (white dashed circles), in the sibling cells to the dAp cells (yellow dashed circles) and in one additional cell posterior to dAp sibling cells (magenta dashed circles) are all located in the same plane. (E) Quantification of GFP positive dAp cells in control and mutant backgrounds shows a significant reduction of GFP positive dAp cell numbers in all mutants when compared to control (*** p≤0.0001, n = 10 embryos, Students t-test, +/- SEM). (F-I) Stain for Eya and GFP in whole VNCs at stage AFT to determine the activity of (F) wild type col-dAp-CRM and (G-I) col-dAp-CRMs mutated for potential TFBS for col-dAp upstream activators (indicated by Δ), in the dAp cells. col-dAp-CRMs mutated for potential (G) Kr and (H) Pdm/POU sites, show a loss of GFP signal in the dAp cells. (I) Mutation of potential Grn/GATA binding sites, significantly reduces the GFP signal in the dAp cell. (J) Quantification of GFP positive dAp cells in embryos carrying the col-dAp-CRM-ΔKr or col-dAp-CRM-ΔPOU/Pdm constructs, shows a significant loss of GFP positive dAp cells when compared to control (*** p≤0.0001, n = 10 embryos, Students t-test, +/- SEM). (K) Quantification of GFP levels in dAp cells in flies carrying the col-dAp-CRM-ΔGATA/Grn constructs shows that the levels are significantly reduced when compared to the control (*** p≤0.0001, n≥30 cells, Students t-test, +/- SEM). Schematic representation of the col locus together with the position of the col-dAp-CRM fragment. Color coded dots represent potential transcription factor binding sites (TFBS) found in the col-dAp-CRM fragment, together with the conversion pattern, which was used to mutated the potential binding sites. Chr3:attP3 denotes the landing sites at which all, col-dAp-CRM as well as col-dAp-CRM-ΔTFBS constructs are inserted in the fly genome. Genotypes: (A) col-dAp-CRM. (B) Kr1, KrCD/Kr1, KrCD; col-dAp-CRM/col-dAp-CRM. (C) Df(2L)ED773/ Df(2L)ED773; col-dAp-CRM/col-dAp-CRM (Df(2L)ED773 (removes both nub and Pdm2). (D) col-dAp-CRM/col-dAp-CRM; grn7L12/grnSPJ9. (F) col-dAp-CRM. (G) col-dAp-CRM-ΔKr. col-dAp-CRM-ΔPOU/Pdm. Col-dAp-CRM-ΔGrn/GATA.
Fig 5
Fig 5. apterous enhancer analysis.
(A-D) Whole Drosophila VNCs at stage AFT, stained for β-gal (reporter) and GFP (location) to show the activity of the apS2-CRM fragment under (A) control conditions and (B-D) in mutant backgrounds for transcription factors critical for ap activation i.e., Antp, lbe and col. Antp, lbe and col mutants result in loss of markers for the Ap cluster, therefore all experiments were performed with lbe(K)-GFP in the background, which allowed us to identify the NB5-6 lineage in T1-T3. (E) Quantification of β-gal positive Ap cluster cells in mutant background shows that all mutants reduce the enhancer activity significantly when compared to the control enhancer (*** p≤0.0001, n≥40 clusters, Students t-test, +/- SEM). (F) Quantification of β-gal positive dAp cells in the same mutants shows that Antp and col mutants significantly reduce the β-gal positive dAp cell numbers (*** p≤0.0001, n = 10 embryos, Students t-test, +/- SEM), whereas lbe mutants do not significantly reduce the β-gal positive dAp cell numbers. (G-J) Eya and β-gal staining of the shorter and Ap cell specific apSJ2-CRM-lacZ reporter construct and apSJ2-CRMs with mutated potential binding sites for (H) Hox (Antp, lbe), (I) Col and (J) Exd (indicated by Δ). (K) Quantification of β-gal levels in the Ap cluster cells, shows that mutation of potential TFBS, leads to a significant decrease of the apSJ2-CRM activity, when compared to control levels (*** p≤0.0001, ** p = 0.0002, n = 48 cells, Students t-test, +/- SEM). (L) Quantification of β-gal levels in the dAp cells, shows that the same mutations of potential TFBS, lead to a significant decrease of the apSJ2-CRM activity in dAp cells, when compared to control levels (*** p≤0.0001, n = 16 cells, Students t-test, +/- SEM). (N) Schematic representation of the ap locus together with the two enhancer fragments used. The longer apS2-CRM, was used for mutant background analysis and the shorter apSJ2-CRM, was used to generate mutated versions of the enhancer. Colored dots represent the potential TFBS in the apSJ2-CRM fragment together with the conversion pattern, used to mutate the indicated TBFS motifs. Genotypes: (A) apS2-CRM-lacZ. (B) apS2-CRM-lacZ/lbe(K)-GFP; Antp12/Antp25. (C) apS2-CRM-lacZ/lbe(K)-GFP; lbe12C5/lbeDf. (D) col1/col3; apS2-CRM-lacZ/lbe(K)-GFP. (G) apSJ2-CRM-lacZ. (H) apSJ2-CRM-ΔHox. (I) apSJ2-CRM-Δcol. (J) apSJ2-CRM-Δexd.
Fig 6
Fig 6. Nplp1 enhancer analysis.
(A-E) Drosophila VNCs at stage AFT showing the Nplp1-CRM-GFP reporter expression, stained for lbe(K)-lacZ/β-gal (location) and GFP (reporter) to show the activity of the Nplp1-CRM-GFP construct under (A) control conditions and (B-E) in different mutant backgrounds for transcription factors critical for Nplp1 activation i.e., col, ap, eya and dimm. Because the different upstream mutants result in loss of markers for the Ap cluster, all experiments were performed with the lbe(K)-lacZ construct in the background, which allows to identify the NB5-6 lineage in T1-T3. (F) Quantification of GFP positive Ap cluster cells in different mutant backgrounds shows that all mutants reduce the enhancer activity significantly when compared to the control enhancer (*** p≤0.0001, * p = 0.031; n≥40 clusters, Students t-test, +/- SEM). (G) Quantification of GFP positive dAp cells in different mutant backgrounds shows that all mutants reduce the GFP positive dAp cell numbers significantly (*** p≤0.0001, n = 10 embryos, Students t-test, +/- SEM). (H-K) Eya and GFP staining of the Nplp1-CRM construct with mutated potential binding sites for Hox (ap), Col and Dimm/E-box (indicated by Δ) at stage AFT. (L) Quantification of GFP levels in the Ap cluster cells, shows that single factor binding site mutation for Hox binding sites leads to a significant decrease of the Nplp1-CRM activity, when compared to control levels. Mutation of potential Col binding sites results in a slight but not significant increase in Nplp1-CRM activity (*** p≤0.0001, n≥36 cells, Students t-test, +/- SEM). (M) Quantification of GFP levels in the dAp cells, shows that single factor binding site mutation of potential Hox binding sites leads to a significant decrease of the Nplp1-CRM activity in dAp cells, when compared to control levels, while mutation of potential Col bindings sites resulted in a slight but non-significant increase in Nplp1-CRM activity (*** p≤0.0001, n≥ 30 cells, Students t-test, +/- SEM). (N) Quantification of GFP positive Ap cluster cell numbers shows that mutation of potential Dimm/E-box binding sites in the Nplp1-CRM, leads to significant reduction of GFP positive Ap cluster cells compared to control numbers (*** p≤0.0001, n≥40 clusters, Chi-square test, +/- SEM). (O) Quantification of GFP positive dAp cell numbers shows that mutation of potential Dimm/E-box binding sites in the Nplp1-CRM, leads to significant reduction of GFP positive dAp cells when compared to control numbers (*** p≤0.0001, n = 10 embryos, Student´s t-test, +/- SEM). (P) Schematic representation of the Nplp1 locus together with the enhancer-reporter construct. Colored dots represent the potential TFBS in the Nplp1-CRM fragment together with the conversion pattern, used to mutate the indicated TBFS motifs. Genotypes: (A) Nplp1-CRM-GFP/lbe(K)-lacZ. (B) col1/col3; Nplp1-CRM-GFP/lbe(K)-lacZ. (C) app44/app44; Nplp1-CRM-GFP/lbe(K)-lacZ. (D) eyaDf/eyaCli; Nplp1-CRM-GFP/lbe(K)-lacZ. (E) dimmrev4/dimmP1; Nplp1-CRM-GFP/lbe(K)-lacZ. (H) Nplp1-CRM-GFP. (I) Nplp1-CRM-ΔHox. (J) Nplp1-CRM-ΔCol. (K) Nplp1-CRM-ΔDimm/E-box.
Fig 7
Fig 7. The FFL enhancers can be activated by misexpression.
(A-H) Expression of the separate CRM-reporter constructs under control and misexpression conditions from elav-Gal4 at stage AFT. (A-B) Staining for Eya and β-gal of the apS2-CRM-lacZ transgene in (A) control and (B) in a UAS-col, UAS-lbe co-misexpression background, which results in broad activation of the apS2-CRM-reporter construct. (C-D) Staining for Eya and GFP of the eya-CRM-GFP transgene under (C) control condition and (D) in UAS-col, UAS-lbe co-misexpression background, which results in broad activation of the eya-CRM reporter construct. (E-F) Staining for Dimm and GFP of the dimm-CRM-GFP transgene under (E) control condition and (F) in UAS-col, UAS-ap, UAS-eya “dimm-cocktail” misexpression background, which results in broad activation of the dimm-CRM-GFP reporter construct. (G-H) Staining for Nplp1 and GFP of the Nplp1-CRM-GFP transgene under (G) control condition and (H) in UAS-col, UAS-ap, UAS-eya, UAS-dimm “Nplp1-cocktail misexpression background, which results in broad activation of the Nplp1-CRM-GFP reporter construct. Genotypes: (A) apS2-CRM-lacZ. (B) elav-Gal4/+;; apS2-CRM-lacZ/UAS-lbe, UAS-col. (C) eya-CRM-GFP. (D) elav-Gal4/+;; eya-CRM-GFP/UAS-lbe, UAS-col. (E) dimm-CRM-GFP. (F) elav-Gal4/+;UAS-ap/+; dimm-CRM-GFP/UAS-eya, UAS-col. (G) Nplp1-CRM-GFP. (H) elav-Gal4/+;UAS-ap, UAS-dimm/+; Nplp1-CRM-GFP/UAS-eya, UAS-col.
Fig 8
Fig 8. Model Cartoon.
Summary of the identified genetic and molecular pathways controlling specification of the Tv1 and dAp neurons. See text for details.

Similar articles

Cited by

References

    1. Allan DW, Thor S. Transcriptional selectors, masters, and combinatorial codes: regulatory principles of neural subtype specification. Wiley interdisciplinary reviews Developmental biology. 2015. Epub 2015/04/10. - PMC - PubMed
    1. Hobert O. Regulatory logic of neuronal diversity: terminal selector genes and selector motifs. Proceedings of the National Academy of Sciences of the United States of America. 2008;105(51):20067–71. Epub 2008/12/24. PubMed Central PMCID: PMC2629285. doi: 10.1073/pnas.0806070105 - DOI - PMC - PubMed
    1. Wenick AS, Hobert O. Genomic cis-regulatory architecture and trans-acting regulators of a single interneuron-specific gene battery in C. elegans. Developmental cell. 2004;6(6):757–70. Epub 2004/06/05. doi: 10.1016/j.devcel.2004.05.004 - DOI - PubMed
    1. Sharma K, Sheng HZ, Lettieri K, Li H, Karavanov A, Potter S, et al. LIM homeodomain factors Lhx3 and Lhx4 assign subtype identities for motor neurons. Cell. 1998;95(6):817–28. - PubMed
    1. Thor S, Andersson SG, Tomlinson A, Thomas JB. A LIM-homeodomain combinatorial code for motor-neuron pathway selection. Nature. 1999;397(6714):76–80. doi: 10.1038/16275 - DOI - PubMed

MeSH terms