. 2017 May 2;8(18):29625-29642.
doi: 10.18632/oncotarget.16377.

Interleukin-2-regulatory T cell axis critically regulates maintenance of hematopoietic stem cells

Affiliations

Interleukin-2-regulatory T cell axis critically regulates maintenance of hematopoietic stem cells

Sabrina Giampaolo et al. Oncotarget. .

Abstract

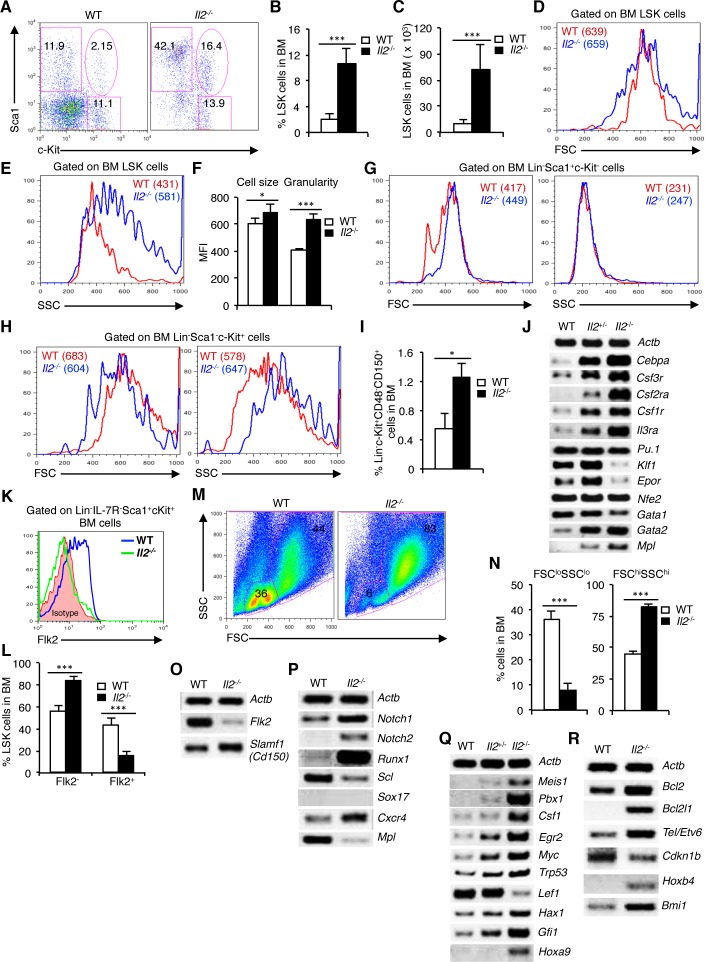
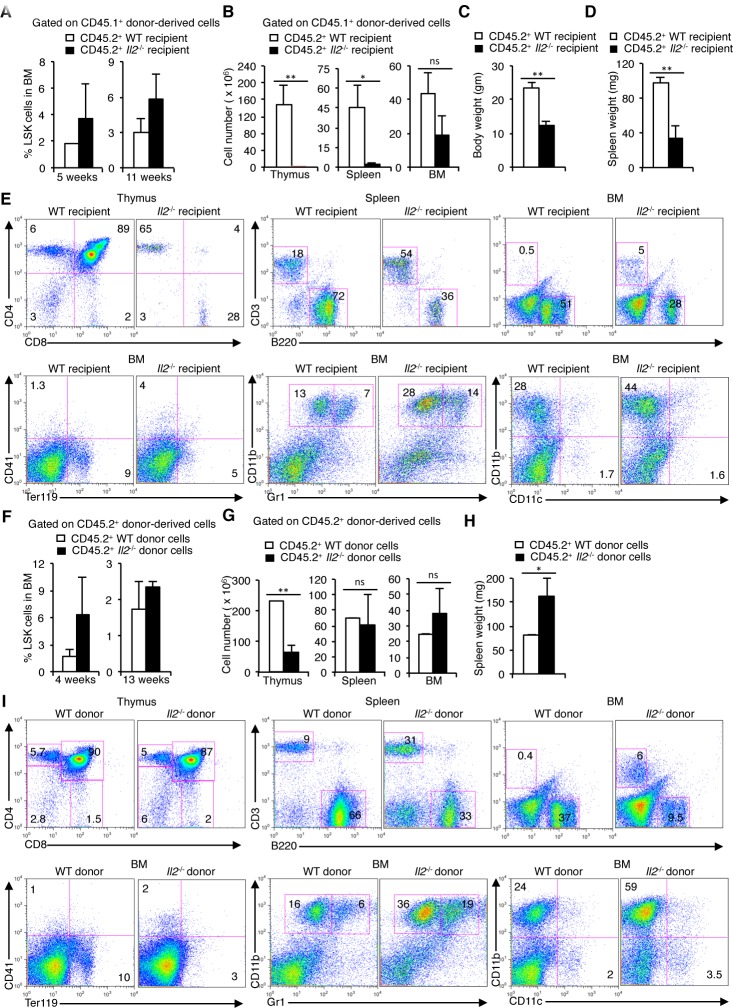
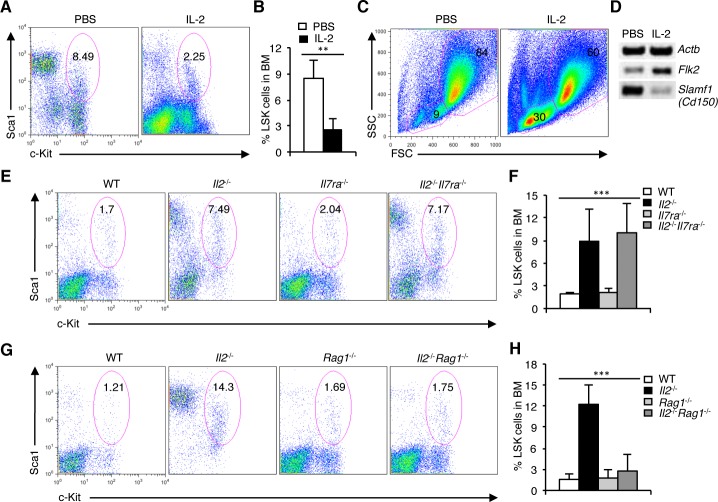
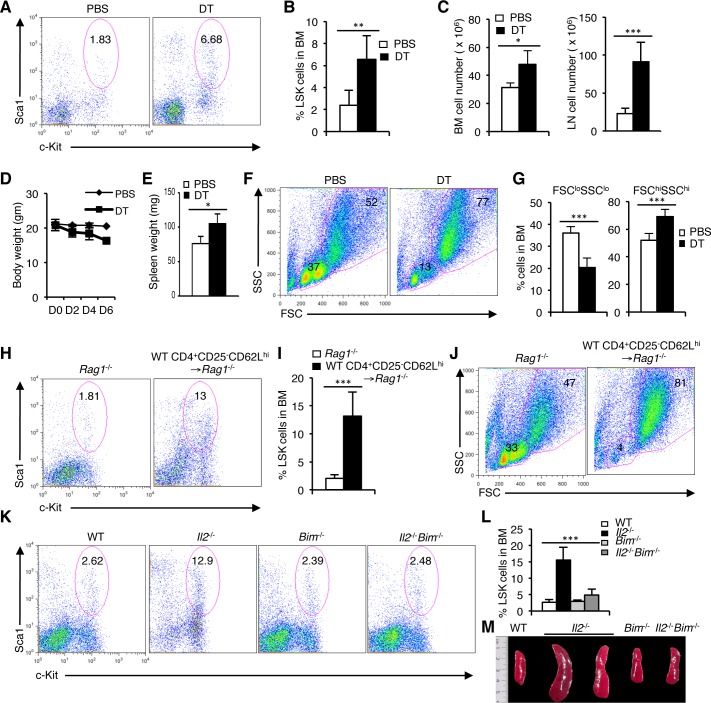
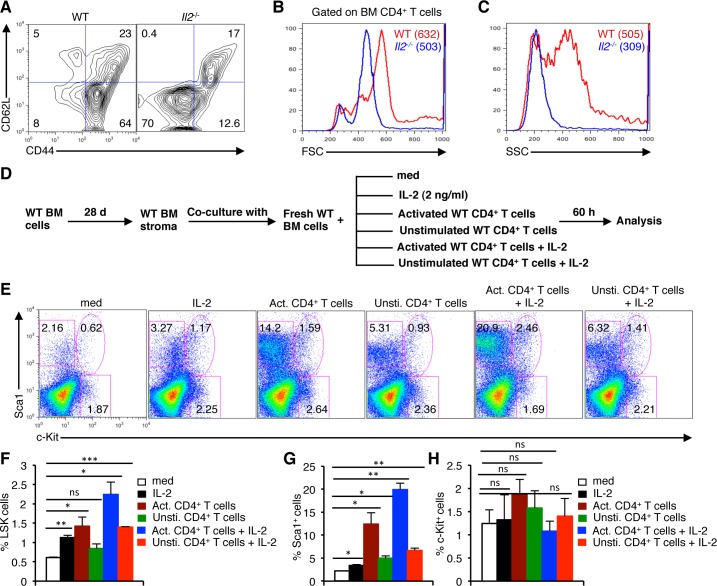
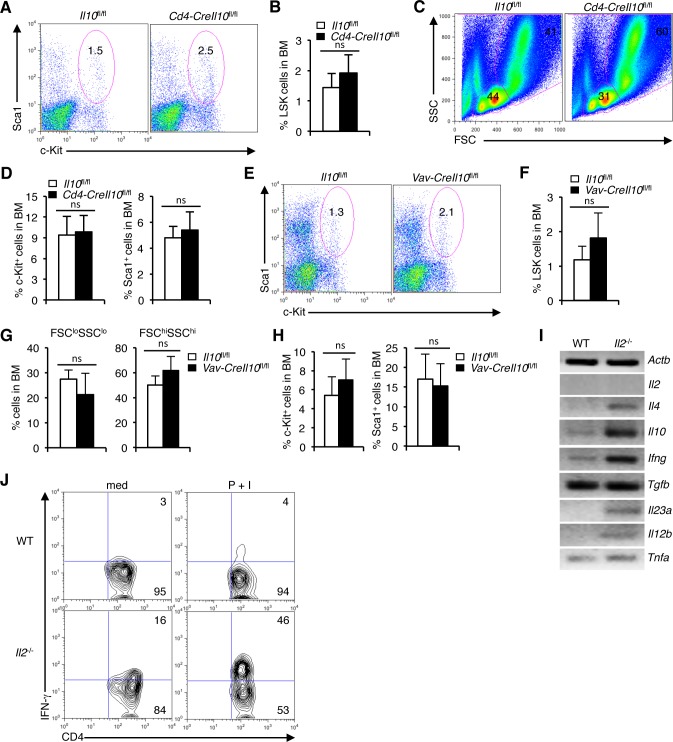
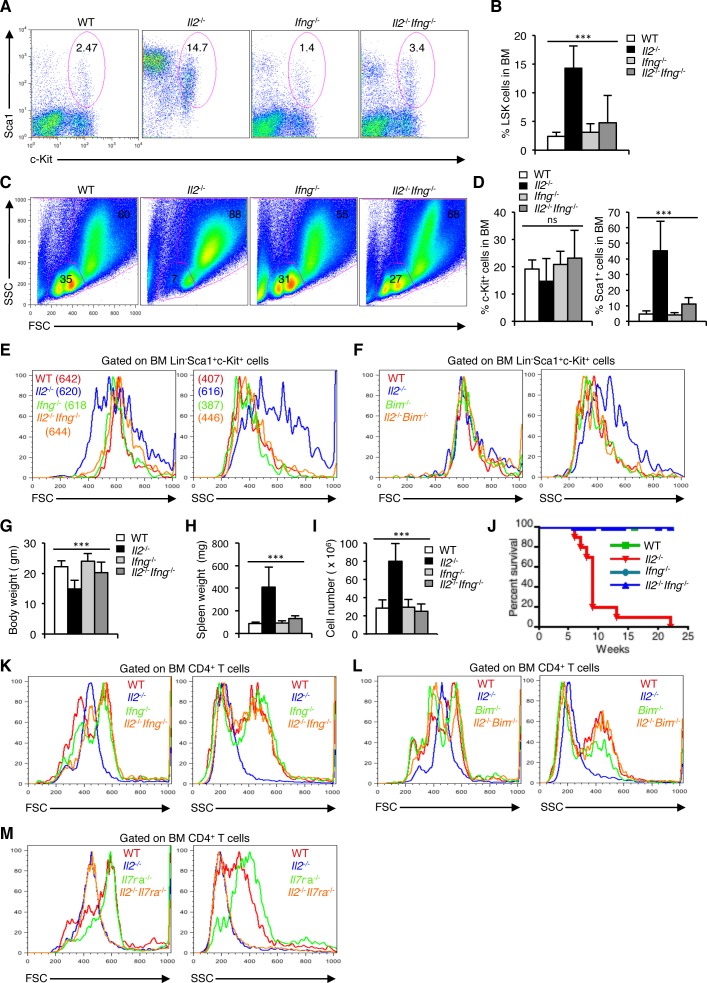
The role of IL-2 in HSC maintenance is unknown. Here we show that Il2-/- mice develop severe anomalies in HSC maintenance leading to defective hematopoiesis. Whereas, lack of IL-2 signaling was detrimental for lympho- and erythropoiesis, myelopoiesis was enhanced in Il2-/- mice. Investigation of the underlying mechanisms of dysregulated hematopoiesis in Il2-/- mice shows that the IL-2-Treg cell axis is indispensable for HSC maintenance and normal hematopoiesis. Lack of Treg activity resulted in increased IFN-γ production by activated T cells and an expansion of the HSCs in the bone marrow (BM). Though, restoring Treg population successfully rescued HSC maintenance in Il2-/- mice, preventing IFN-γ activity could do the same even in the absence of Treg cells. Our study suggests that equilibrium in IL-2 and IFN-γ activity is critical for steady state hematopoiesis, and in clinical conditions of BM failure, IL-2 or anti-IFN-γ treatment might help to restore hematopoiesis.

Keywords: IFN-γ; IL-10; IL-2; Immune response; Immunity; Immunology and Microbiology Section; Treg cells; hematopoietic stem cells.


Conflict of interest statement

CONFLICTS OF INTEREST

The authors declare that they have no financial or commercial conflict of interest.

Figures

Figure 1
Figure 1. Impaired maintenance of HSCs in Il2−/− mice BM
A. Flow cytometry analysis of BM cells for LSK population in WT and Il2−/− mice. B. Proportion of LSK cells in the BM of WT and Il2−/− mice (n = 20 per group). C. LSK cells distribution in absolute numbers in WT and Il2−/− mice (n = 20 per group). D. Cell size of WT and Il2−/− HSCs as reflected by their FSC distribution pattern. E. SSC distribution pattern of WT and Il2−/− HSCs. F. Mean cell size and granularity of WT and Il2−/− HSCs. G. FSC and SSC profiles of BM LinSca1+c-Kit cells from WT and Il2−/− mice. H. Profiles of WT and Il2−/− BM LinSca1c-Kit+ cells according to their FSC and SSC distribution pattern. I. Proportion of Linc-Kit+CD48CD150+ cell population in the BM from WT and Il2−/− mice (n = 5 per group). J. Myeloid, lymphoid and erythroid lineage-specific genes expression in WT, Il2+/− and Il2−/− mice. K. Flow cytometry revealing the distribution of LT-HSCs and ST-HSCs among LSK cells in indicated mice (n = 5 for WT and 4 for Il2−/− mice). L. Population distribution of LT- and ST-HSC in the BM of WT and Il2−/− mice based on Flk2 expression (n = 7 per group). M. Flow cytometry profiles of BM cells in WT and Il2−/− mice according to their FSC and SSC distribution pattern (n = 20 per group). N. Quantification of FSCloSSClo and FSChiSSChi cells in WT and Il2−/− mice. O. RT-PCR analysis of LT- and ST-HSC-specific genes expression in sorted LSK cells from WT and Il2−/− mice. P. Semi-quantitative RT-PCR on WT and Il2−/− LSK cells for critical genes involved in HSC maintenance. Q. Gene expression analysis of TFs and signaling molecules in LSK cells from WT, Il2+/− and Il2−/− mice. R. Cell survival and HSC proliferation-specific genes expression in LSK cells from WT, Il2+/− and Il2−/− mice. Numbers inside each dot plot represent percent respective population, and in histograms represent the mean fluorescence intensity (MFI). Data are representative of 2-5 independent experiments and shown as mean ± s.d., in (B, C & N) ***P < 0.0001, in (F) *P = 0.0389, ***P = 0.0001, in (I) *P = 0.0348, and in (L) ***P = 0.0002, unpaired t-test.
Figure 2
Figure 2. HSC maintenance in BM depends on IL-2 signaling
A. Enumeration of CD45.1+ donor-derived LSK cells distribution 5 and 11 weeks post-transfer in the BM of irradiated CD45.2+ WT or Il2−/− recipient mice. B. Number of CD45.1+ donor-derived cells in the thymus, spleen and BM of irradiated CD45.2+ WT or Il2−/− recipient mice 5 weeks after transfer. C. Evaluation of body weight, and D. spleen weight of the recipient mice 5 weeks after cell transfer. E. Flow cytometry profiles of the distribution of various donor-derived mature hematopoietic cell populations in the thymus, spleen and BM of recipient mice. Data are representative of two independent experiments (n = 4 per group/experiment). F. Distribution of CD45.2+ WT or Il2−/− donor-derived LSK cells distribution 4 and 13 weeks post-transfer in the BM of irradiated CD45.1+ WT recipient mice. G. Number of CD45.2+ WT or Il2−/− donor-derived cells in the Thymus, spleen and BM of irradiated CD45.1+ WT recipient mice 4 weeks after transfer. H. Spleen weight of the recipient mice 4 weeks after cell transfer. I. Flow cytometry profiles of the distribution of various CD45.2+ WT or Il2−/− donor-derived mature hematopoietic cell populations in the thymus, spleen and BM of CD45.1+ WT recipient mice. Data are representative of two independent experiments (n = 4 per group/experiment). Numbers inside each FACS plot represent percent respective population. Data are shown as mean ± s.d., in (B) **P = 0.0090, *P = 0.0176, (C) **P = 0.0034, (D) **P = 0.0096, (G) **P = 0.0028, (H) *P = 0.0198, and ns = not significant, unpaired t-test.
Figure 3
Figure 3. Defective HSC maintenance in Il2−/− mice is T cell-mediated
A. Distribution of LSK cells in the BM of PBS or IL-2 treated Il2−/− mice. B. Proportion of LSK cells in the BM of Il2−/− mice treated either with PBS or IL-2. C. FSC/SSC distribution of BM cells from PBS or IL-2 treated Il2−/− mice. D. RT-PCR analysis of Flk2 and Slamf1 expression in sorted BM LSK cells from Il2−/− mice treated either with PBS or IL-2. E. Flow cytometry analysis of LSK cells distribution in the BM of WT, Il2−/−, Il7ra−/− and Il2−/−Il7ra−/− mice. F. Quantification of the distribution of BM LSK population in indicated mice. G. Distribution of LSK cells in the BM of WT, Il2−/−, Rag1−/− and Il2−/−Rag1−/− mice. H. Proportion of LSK cells in BM cells from WT, Il2−/−, Rag1−/− and Il2−/−Rag1−/− mice. Numbers inside each FACS plot represent percent respective population. Data are representative of 3 independent experiments, (n = 4 per group) and shown as mean ± s.d., in (F) ***P = 0.0004 and (H) ***P < 0.0001, one-way ANOVA.
Figure 4
Figure 4. Treg cell activity is critical for steady state hematopoiesis
A. LSK cells distribution in the BM of DEREG mice treated with PBS or diphtheria toxin (DT). B. Quantification of the LSK population distribution in DEREG mice BM after PBS or DT treatment. C. Cellularity in the BM and LNs of DEREG mice following PBS or DT treatment. D. Evaluation of body weight following each PBS or DT injection to the DEREG mice. E. Spleen weight of DEREG mice treated with PBS or DT. F. FSC/SSC distribution of BM cells from PBS or DT treated DEREG mice. G. Evaluation of FSCloSSClo and FSChiSSChi BM cells in PBS or DT treated DEREG mice. H. Distribution of LSK population in the BM of Rag1−/− mice, 3 weeks after transfer of WT CD4+CD25CD62Lhi cells, compared to normal WT or Rag1−/− mice. I. Quantification of BM LSK cells in Rag1−/− mice, 3 weeks post-transfer of WT CD4+CD25CD62Lhi cells in comparison to control Rag1−/− mice. J. FSC/SSC distribution of BM cells from WT CD4+CD25CD62Lhi cells transferred Rag1−/− mice compared to control Rag1−/− mice. K. Flow cytometry profiles of LSK cells in BM of WT, Il2−/−, Bim−/− and Il2−/−Bim−/− mice. L. Quantification of the distribution of BM LSK population in indicated mice. M. Photograph of spleens from WT, Il2−/−, Bim−/− and Il2−/−Bim−/− mice. Numbers inside each FACS plot represent percent respective population. Data are shown as mean ± s.d., in (B) **P = 0.0043, (C) *P = 0.0113 and ***P = 0.0005, (E) *P = 0.01734, (G) ***P = 0.0003, ***P = 0.0008, (I) ***P = 0.0006, and in (L) ***P < 0.0001 unpaired t-test. Data are representative of 3 independent experiments, (n = 4 per group).
Figure 5
Figure 5. Activated T cells induce HSC defects in the BM
A. Distribution of CD4+ T cells in the BM of Il2−/− mice based on CD62L and CD44 expression compared to WT mice. B. Profiles of FSC distribution, and C. SSC distribution of the BM CD4+ T cells in WT and Il2−/− mice. D. Experimental plan to analyze the involvement of activated CD4+ T cells in BM HSC maintenance. E. Flow cytometry profiles showing the influence of IL-2, of naïve or activated CD4+ T cells on the maintenance of HSCs in the BM cells-stromal cells co-culture assays. F. Quantification of LSK cells in the respective BM cells-stromal cells co-culture assays as indicated. G. Distribution of BM LinSca1+, and H. Linc-Kit+ cells as evaluated from the BM cells-stromal cells co-culture assays in respective conditions as indicated. Numbers inside each dot plot represent percent respective population. Data are representative of 3 independent experiments, (n = 3 per group) and shown as mean ± s.d., in (F) **P = 0.0061, *P = 0.0185 or 0.0185 and ***P = 0.0002, (G) *P = 0.0135 or 0.0279 or 0.0143 and **P = 0.0029 or 0.0067, ns = not significant, one-way ANOVA.
Figure 6
Figure 6. Dysregulated hematopoiesis in Il2−/− mice is IL-10-independent
A. Flow cytometry revealing the distribution of LSK cells in Cd4-CreIl10fl/fl mice compared to control mice. B. Proportion of LSK cells in the BM of Cd4-CreIl10fl/fl and Il10fl/fl mice. C. Profiles of BM cells in Cd4-CreIl10fl/fl mice compared to control mice according to their FSC/SSC distribution pattern. D. Evaluation of c-Kit+ and Sca1+ cells distribution among lineage-negative BM cells in Cd4-CreIl10fl/fl and Il10fl/fl mice. E. BM LSK cells distribution in Vav-CreIl10fl/fl mice compared to littermate control mice. F. Analysis of the proportion of BM LSK cells in Vav-CreIl10fl/fl and Il10fl/fl mice. G. Evaluation of FSCloSSClo and FSChiSSChi cells in the BM of Vav-CreIl10fl/fl mice compared to Il10fl/fl mice. H. Proportion of c-Kit+ and Sca1+ cells distribution among lineage-negative BM cells in Vav-CreIl10fl/fl and Il10fl/fl mice. I. Semi-quantitative RT-PCR analysis of cytokine gene expression in Il2−/− T cells compared to WT cells. J. Flow cytometry analysis of IFN-γ production by unstimulated or P+I stimulated CD4+ T cells in WT and Il2−/− mice. Numbers inside each dot plot represent percent respective population and in histograms represent the MFI. Data are representative of 3 independent experiments, (n = 3 per group) and shown as mean ± s.d., ns = not significant, one-way ANOVA.
Figure 7
Figure 7. Enhanced IFN-γ activity leads to dysregulated hematopoiesis in Il2−/− mice
A. Distribution of LSK cells in BM from WT, Il2−/−, Ifng−/− and Il2−/−Ifng−/− mice. B. Quantification of BM LSK cells in Il2−/−Ifng−/− mice compared to WT, Il2−/−and Ifng−/− mice. C. Distribution of BM cells in indicated mice according to their FSC and SSC pattern. D. Evaluation of c-Kit+ and Sca1+ cells distribution among lineage-negative BM cells in Il2−/−Ifng−/− mice compared to littermate control mice. E. FSC and SSC patterns of Il2−/−Ifng−/− LSK cells compared to that of WT, Il2−/− and Ifng−/− cells. F. FSC and SSC patterns of Il2−/−Bim−/− LSK cells compared to that of WT, Il2−/− and Bim−/− cells. G. Body weight, H. spleen weight, and I. splenocytes number in Il2−/−Ifng−/− mice compared to WT, Il2−/−and Ifng−/− mice. J. Survival curve for Il2−/−Ifng−/− mice compared to WT, Il2−/−and Ifng−/− mice. K. Profile of Il2−/−Ifng−/− BM CD4+ T cells according to their FSC and SSC distribution pattern compared to that of littermate control mice. L. FSC and SSC distribution of Il2−/−Bim−/− BM CD4+ T cells compared to that of littermate control mice. M. Profile of Il2−/−Il7ra−/− BM CD4+ T cells according to their FSC and SSC distribution pattern compared to that of WT, Il2−/−and Il7ra−/− mice. Numbers inside each dot plot represent percent respective population and in histograms represent the MFI. Data are representative of 3 independent experiments, (n = 3 per group) and shown as mean ± s.d., in B, D, G, H & I ***P < 0.0001, ns = not significant, one-way ANOVA.

Similar articles

Cited by

References

    1. Morrison SJ, Scadden DT. The bone marrow niche for haematopoietic stem cells. Nature. 2014;505:327–334. - PMC - PubMed
    1. Anthony BA, Link DC. Regulation of hematopoietic stem cells by bone marrow stromal cells. Trends in immunology. 2014;35:32–37. - PMC - PubMed
    1. Coskun S, Chao H, Vasavada H, Heydari K, Gonzales N, Zhou X, de Crombrugghe B, Hirschi KK. Development of the fetal bone marrow niche and regulation of HSC quiescence and homing ability by emerging osteolineage cells. Cell reports. 2014;9:581–590. - PMC - PubMed
    1. Kumano K, Chiba S, Kunisato A, Sata M, Saito T, Nakagami-Yamaguchi E, Yamaguchi T, Masuda S, Shimizu K, Takahashi T, Ogawa S, Hamada Y, Hirai H. Notch1 but not Notch2 is essential for generating hematopoietic stem cells from endothelial cells. Immunity. 2003;18:699–711. - PubMed
    1. Varnum-Finney B, Halasz LM, Sun M, Gridley T, Radtke F, Bernstein ID. Notch2 governs the rate of generation of mouse long- and short-term repopulating stem cells. The Journal of clinical investigation. 2011;121:1207–1216. - PMC - PubMed

MeSH terms