

Tumor physiological changes during hypofractionated stereotactic body radiation therapy assessed using multi-parametric magnetic resonance imaging
- PMID: 28415581
- PMCID: PMC5514922
- DOI: 10.18632/oncotarget.16395
Tumor physiological changes during hypofractionated stereotactic body radiation therapy assessed using multi-parametric magnetic resonance imaging
Abstract
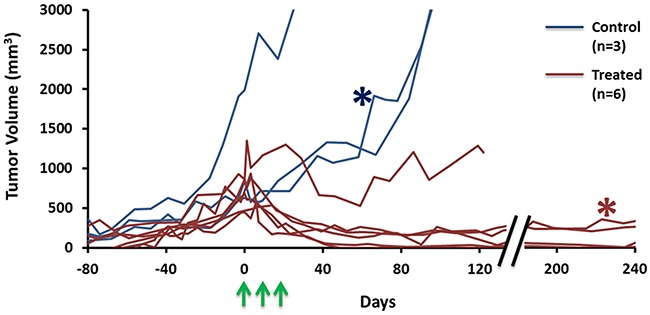
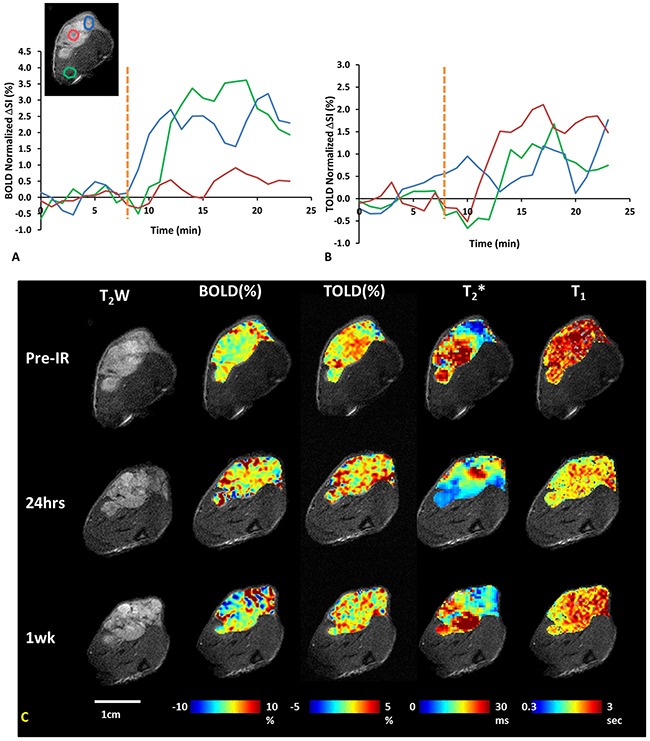
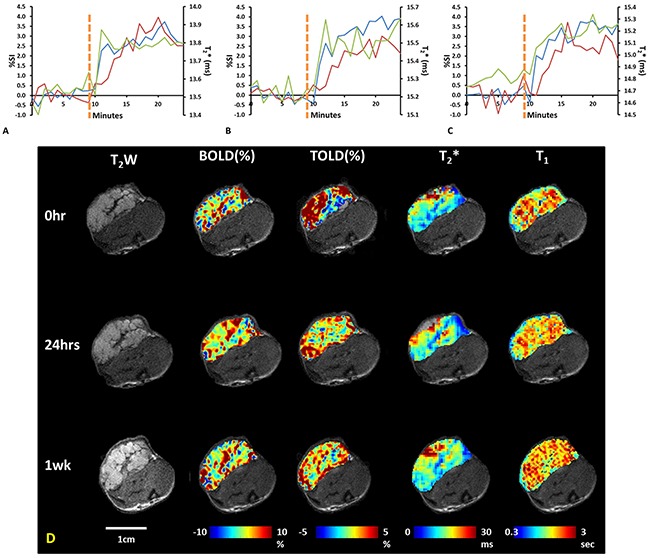
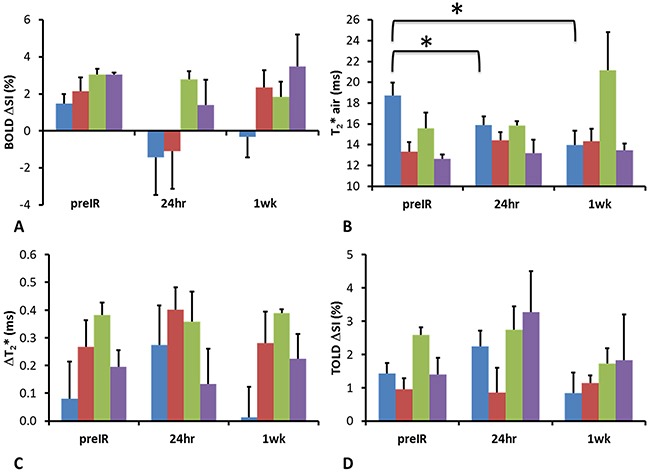
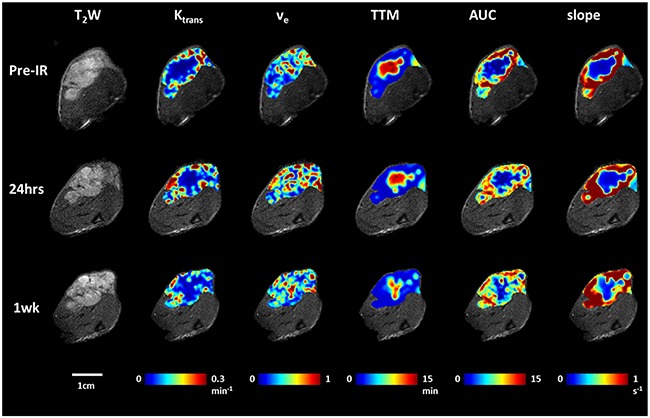
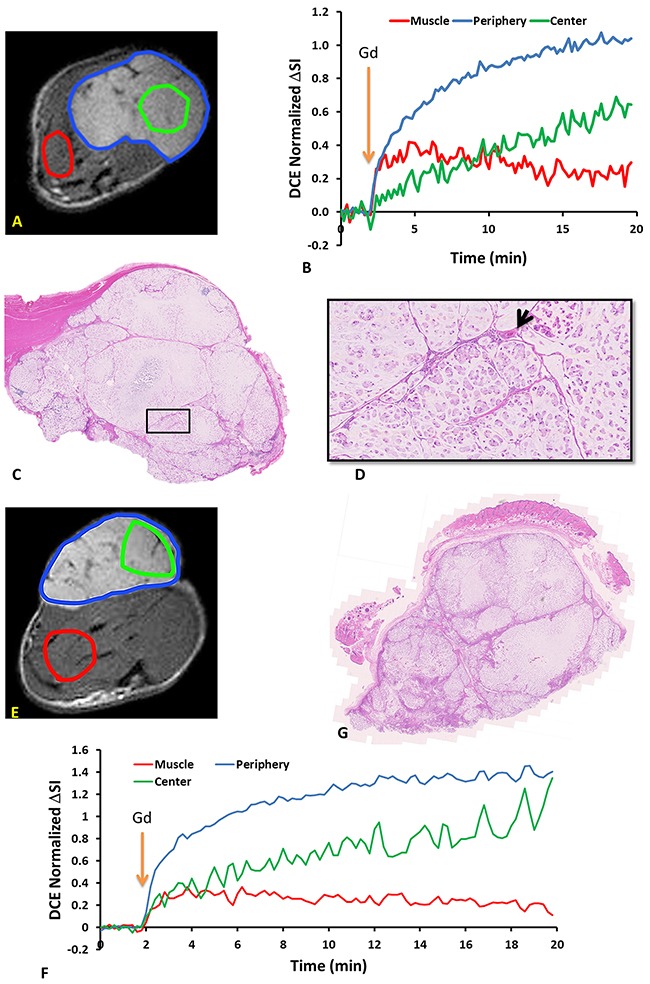
Radiation therapy is a primary treatment for non-resectable lung cancer and hypoxia is thought to influence tumor response. Hypoxia is expected to be particularly relevant to the evolving new radiation treatment scheme of hypofractionated stereotactic body radiation therapy (SBRT). As such, we sought to develop non-invasive tools to assess tumor pathophysiology and response to irradiation. We applied blood oxygen level dependent (BOLD) and tissue oxygen level dependent (TOLD) MRI, together with dynamic contrast enhanced (DCE) MRI to explore the longitudinal effects of SBRT on tumor oxygenation and vascular perfusion using A549 human lung cancer xenografts in a subcutaneous rat model. Intra-tumor heterogeneity was seen on multi-parametric maps, especially in BOLD, T2* and DCE. At baseline, most tumors showed a positive BOLD signal response (%ΔSI) and increased T2* in response to oxygen breathing challenge, indicating increased vascular oxygenation. Control tumors showed similar response 24 hours and 1 week later. Twenty-four hours after a single dose of 12 Gy, the irradiated tumors showed a significantly decreased T2* (-2.9±4.2 ms) and further decrease was observed (-4.0±6.0 ms) after 1 week, suggesting impaired vascular oxygenation. DCE revealed tumor heterogeneity, but showed minimal changes following irradiation. Rats were cured of the primary tumors by 3x12 Gy, providing long term survival, though with ultimate metastatic recurrence.
Keywords: blood oxygen level dependent (bold); dynamic contrast enhanced (dce); hypofractionated stereotactic body radiation therapy (sbrt); oxygen-sensitive mri; treatment response.
Conflict of interest statement
None.
Figures
Similar articles
-
Developing oxygen-enhanced magnetic resonance imaging as a prognostic biomarker of radiation response.Cancer Lett. 2016 Sep 28;380(1):69-77. doi: 10.1016/j.canlet.2016.06.003. Epub 2016 Jun 3. Cancer Lett. 2016. PMID: 27267808 Free PMC article.
-
Real-time Tumor Oxygenation Changes After Single High-dose Radiation Therapy in Orthotopic and Subcutaneous Lung Cancer in Mice: Clinical Implication for Stereotactic Ablative Radiation Therapy Schedule Optimization.Int J Radiat Oncol Biol Phys. 2016 Jul 1;95(3):1022-1031. doi: 10.1016/j.ijrobp.2016.01.064. Epub 2016 Feb 13. Int J Radiat Oncol Biol Phys. 2016. PMID: 27130790
-
Noninvasive monitoring of microvascular changes with partial irradiation using dynamic contrast-enhanced and blood oxygen level-dependent magnetic resonance imaging.Int J Radiat Oncol Biol Phys. 2013 Apr 1;85(5):1367-74. doi: 10.1016/j.ijrobp.2012.10.022. Epub 2012 Nov 27. Int J Radiat Oncol Biol Phys. 2013. PMID: 23195777
-
Biological Principles of Stereotactic Body Radiation Therapy (SBRT) and Stereotactic Radiation Surgery (SRS): Indirect Cell Death.Int J Radiat Oncol Biol Phys. 2021 May 1;110(1):21-34. doi: 10.1016/j.ijrobp.2019.02.047. Epub 2019 Mar 2. Int J Radiat Oncol Biol Phys. 2021. PMID: 30836165 Review.
-
Radiobiology of hypofractionated stereotactic radiotherapy: what are the optimal fractionation schedules?J Radiat Res. 2016 Aug;57 Suppl 1(Suppl 1):i76-i82. doi: 10.1093/jrr/rrw015. Epub 2016 Mar 22. J Radiat Res. 2016. PMID: 27006380 Free PMC article. Review.
Cited by
-
Examining correlations of oxygen sensitive MRI (BOLD/TOLD) with [18F]FMISO PET in rat prostate tumors.Am J Nucl Med Mol Imaging. 2019 Apr 15;9(2):156-167. eCollection 2019. Am J Nucl Med Mol Imaging. 2019. PMID: 31139498 Free PMC article.
-
Noninvasive optoacoustic microangiography reveals dose and size dependency of radiation-induced deep tumor vasculature remodeling.Neoplasia. 2022 Apr;26:100778. doi: 10.1016/j.neo.2022.100778. Epub 2022 Feb 24. Neoplasia. 2022. PMID: 35220045 Free PMC article.
-
Oxygen-Enhanced Optoacoustic Tomography Reveals the Effectiveness of Targeting Heme and Oxidative Phosphorylation at Normalizing Tumor Vascular Oxygenation.Cancer Res. 2020 Sep 1;80(17):3542-3555. doi: 10.1158/0008-5472.CAN-19-3247. Epub 2020 Jun 16. Cancer Res. 2020. PMID: 32546631 Free PMC article.
-
Anti-tumor efficacy of CKD-516 in combination with radiation in xenograft mouse model of lung squamous cell carcinoma.BMC Cancer. 2020 Nov 3;20(1):1057. doi: 10.1186/s12885-020-07566-x. BMC Cancer. 2020. PMID: 33143663 Free PMC article.
-
Multi-parametric MRI (mpMRI) for treatment response assessment of radiation therapy.Med Phys. 2022 Apr;49(4):2794-2819. doi: 10.1002/mp.15130. Epub 2021 Aug 10. Med Phys. 2022. PMID: 34374098 Free PMC article.
References
-
- Siegel R, Ma J, Zou Z, Jemal A. Cancer statistics, 2014. CA Cancer J Clin. 2014;64:9–29. - PubMed
-
- Travis WD, Brambilla E, Muller-Hermelink HK, Harris CC. Albany, NY: World Health Organization (WHO); 2004. Pathology and genetics of tumours of the lung, pleura, thymus and heart.
-
- Scott WJ, Howington J, Feigenberg S, Movsas B, Pisters K. Treatment of non-small cell lung cancer stage i and stage ii: ACCP evidence-based clinical practice guidelines (2nd edition) Chest. 2007;132:234S–242S. - PubMed
-
- Qiao X, Tullgren O, Lax I, Sirzén F, Lewensohn R. The role of radiotherapy in treatment of stage I non-small cell lung cancer. Lung Cancer. 2003;41:1–11. - PubMed
-
- Onishi H, Araki T, Shirato H, Nagata Y, Hiraoka M, Gomi K, Yamashita T, Niibe Y, Karasawa K, Hayakawa K, Takai Y, Kimura T, Hirokawa Y, et al. Stereotactic hypofractionated high-dose irradiation for stage I nonsmall cell lung carcinoma. Cancer. 2004;101:1623–1631. - PubMed
MeSH terms
Grants and funding
LinkOut - more resources
Full Text Sources
Other Literature Sources
Medical
Research Materials
