. 2017 May 16;8(20):32856-32863.
doi: 10.18632/oncotarget.16459.

A(H1N1)pdm09 influenza infection: vaccine inefficiency

Affiliations

A(H1N1)pdm09 influenza infection: vaccine inefficiency

Nehemya Friedman et al. Oncotarget. .

Abstract

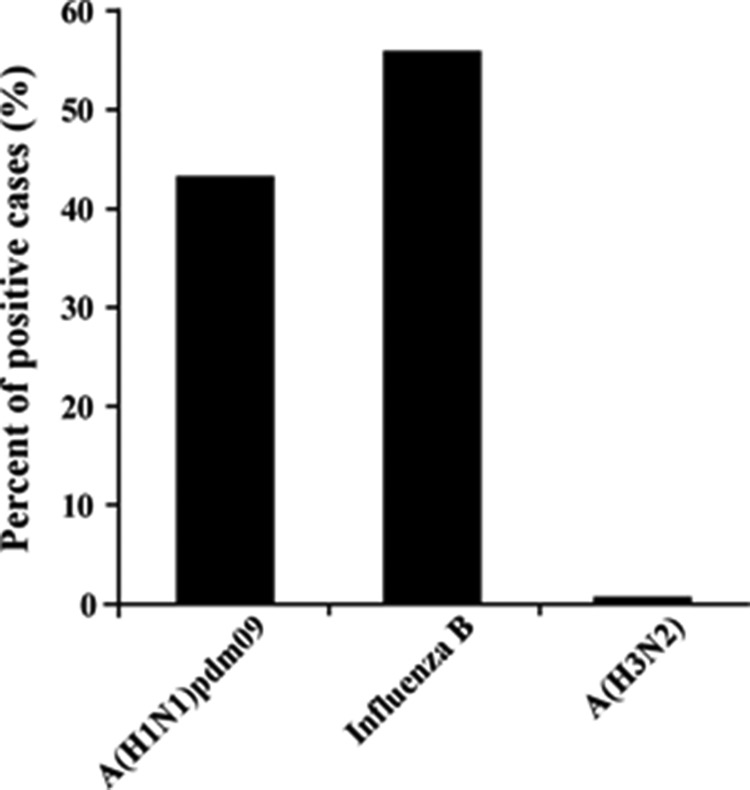
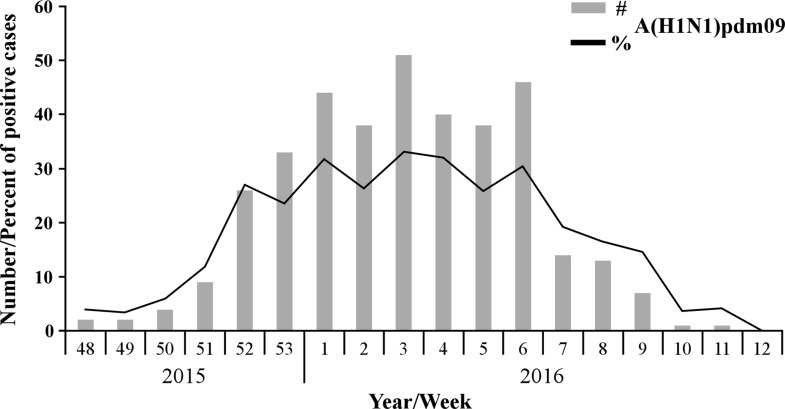
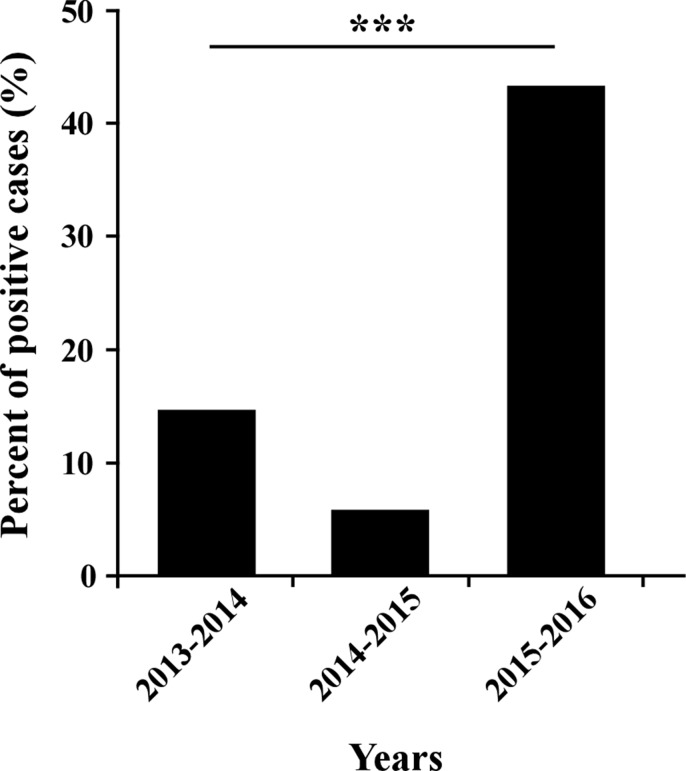
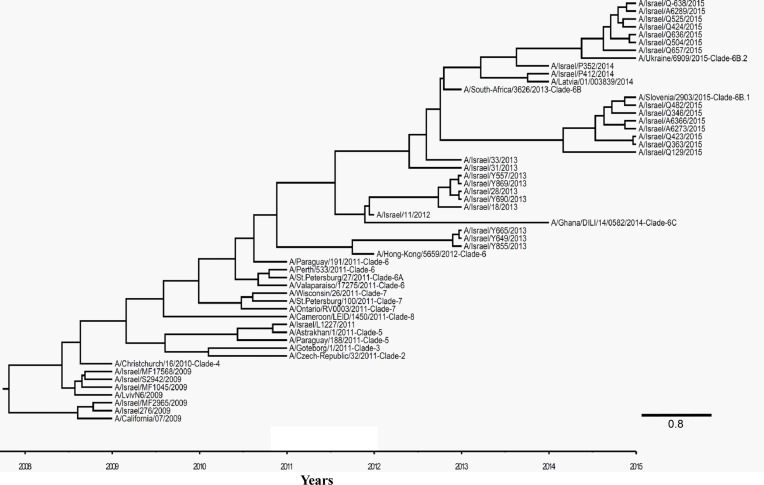
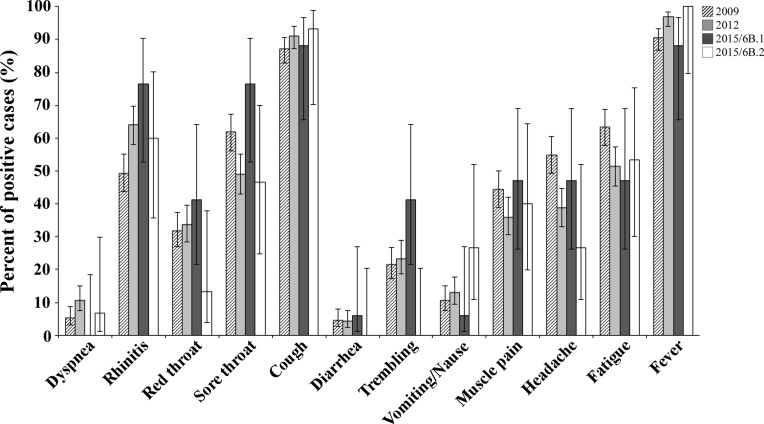
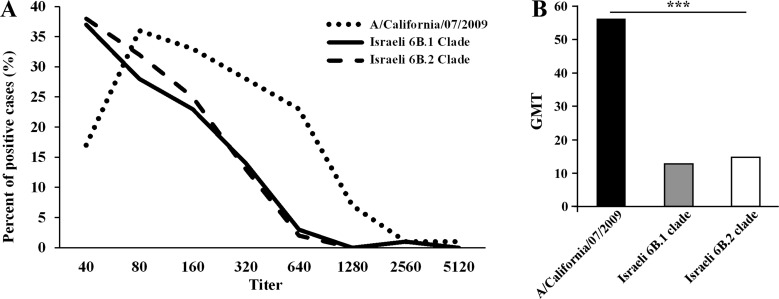
The last influenza pandemic, caused by the swine A(H1N1)pdm09 influenza virus, began in North America at 2009. Since then, the World Health Organization (WHO) recommended integration of the swine-based virus A/California/07/2009 strain in yearly vaccinations. Yet, infections with A(H1N1)pdm09 have continued in subsequent years. The reasons for this are currently unknown. During the 2015-2016 influenza season, we noted an increased prevalence of A(H1N1)pdm09 influenza virus infection in Israel. Our phylogenetic analysis indicated that the circulating A(H1N1)pdm09 strains belonged to 6B.1 and 6B.2 clades and differed from the vaccinating strain, with approximately 18 amino acid differences found between the circulating strains and the immunizing A/California/07/2009 strain. Hemmaglutination inhibition (HI) assays demonstrated higher antibodies titer against the A/California/07/2009 vaccinating strain as compared to the circulating Israeli strains. We thus suggest that the current vaccination was not sufficiently effective and propose inclusion of the current circulating A(H1N1)pdm09 influenza viruses in the annual vaccine composition.

Keywords: Clade 6B; H1N1; influenza A; vaccine.


Conflict of interest statement

CONFLICTS OF INTEREST

None.

Figures

Figure 1
Figure 1. Percentages of influenza viruses
Distribution of influenza viruses strains (X axis) among 1917 influenza-positive cases in 2015–2016 winter season.
Figure 2
Figure 2. Distribution of A(H1N1)pdm09 infection in the 2015–2016 winter season
Number (#) and percent (%) of A(H1N1)pdm09-positive cases among 1917 samples collected during the 2015–2016 winter influenza season, starting from the 48th week of 2015 until the 12th week of 2016.
Figure 3
Figure 3. Percent of A(H1N1)pdm09 infection over the years
The annual percent of patients infected with the A(H1N1)pdm09 virus in winter seasons 2013–2014 (14.71% of 503 positives for Influenza), 2014–2015 (5.81% of 327) and 2016 (43.01% of 865). *** indicates P < 0.0001 using the chi-square test.
Figure 4
Figure 4. Phylogenetic tree of A(H1N1)pdm09 viruses
Bayesian maximum-clade-credibility time-scaled phylogenetic tree (BEAST), generated using 54 A(H1N1)pdm09 Influenza HA gene, obtained from reference genes and patient samples collected between 2009 and 2016 in Israel. Alignment was observed for 1035 base pairs of all the genes in the phylogenetic tree. Clade number is indicated next to the reference viruses. Scale bar display time in years.
Figure 5
Figure 5. Three dimensional presentation of HA protein of circulating 6B clade Israeli viruses
HA gene sequences of A/Israel/Q363/2015 (clade 6B.1) and A/Israel/A6289/2015 (clade B.2) translated using ExPASy translate tool and their 3D structure predicted using SWISS-MODLE server. The tertiary structure designed in PyMOL. Mutations which define 6B.1 (yellow) or 6B.2 clade (black) are marked in arrow.
Figure 6
Figure 6. Clinical characteristics of patients infected with 6B clade A(H1N1)pdm09 viruses
A summary of the clinical symptoms of Israeli patients infected in 2015–2016with A(H1N1)pdm09 virus belonging to the 6B.1 or 6B.2 clade.
Figure 7
Figure 7. Antibodies against 6B clade antigens were not dominant in 2014
The presence of antibodies against A/California/07/2009, Israeli 6B.1 and 6B.2 antigens was detected using the HI test. The figure shows the distribution of the positive cases by antibody titer (A) and their geometric mean (B). *** indicates P < 0.0001 using the Kruskal-Wallis test.

References

    1. Thompson WW, Shay DK, Weintraub E, Brammer L, Bridges CB, Cox NJ, Fukuda K. Influenza-associated hospitalizations in the United States. JAMA. 2004;292:1333–1340. - PubMed
    1. Taubenberger JK, Kash JC. Influenza virus evolution, host adaptation, and pandemic formation. Cell Host Microbe. 2010;7:440–451. - PMC - PubMed
    1. Jagger BW, Wise HM, Kash JC, Walters KA, Wills NM, Xiao YL, Dunfee RL, Schwartzman LM, Ozinsky A, Bell GL, Dalton RM, Lo A, Efstathiou S, et al. An overlapping protein-coding region in influenza A virus segment 3 modulates the host response. Science. 2012;337:199–204. - PMC - PubMed
    1. Rossman JS, Lamb RA. Influenza virus assembly and budding. Virology. 2011;411:229–236. - PMC - PubMed
    1. Nayak DP, Hui EK, Barman S. Assembly and budding of influenza virus. Virus Res. 2004;106:147–165. - PMC - PubMed

MeSH terms