

Identification of DNA-PKcs as a primary resistance factor of TIC10 in hepatocellular carcinoma cells
- PMID: 28415690
- PMCID: PMC5438657
- DOI: 10.18632/oncotarget.16073
Identification of DNA-PKcs as a primary resistance factor of TIC10 in hepatocellular carcinoma cells
Abstract
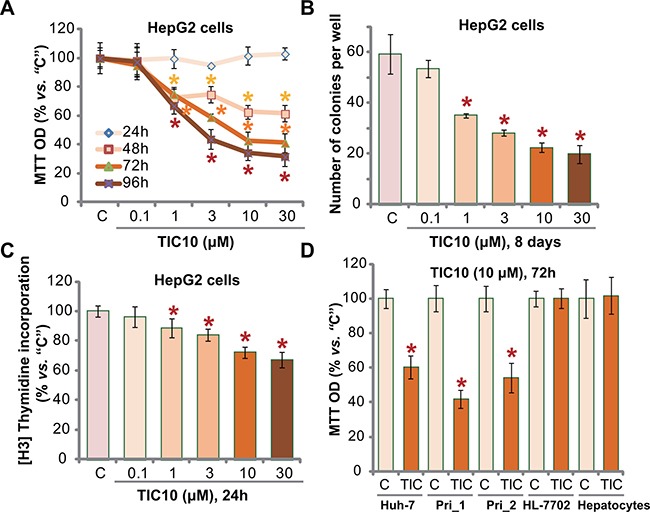
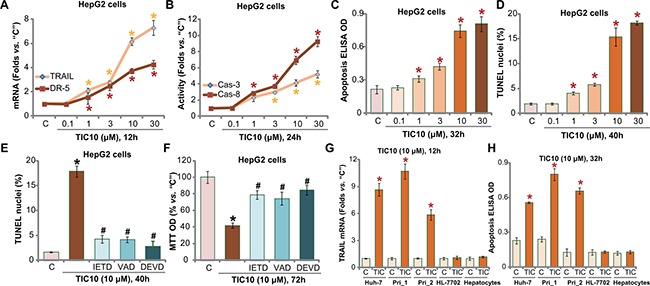
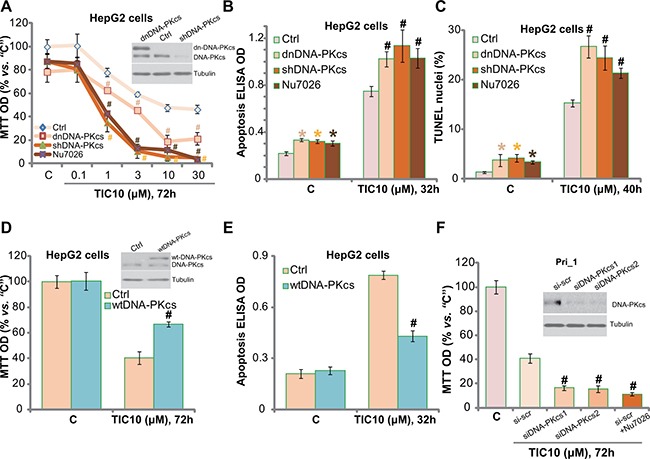
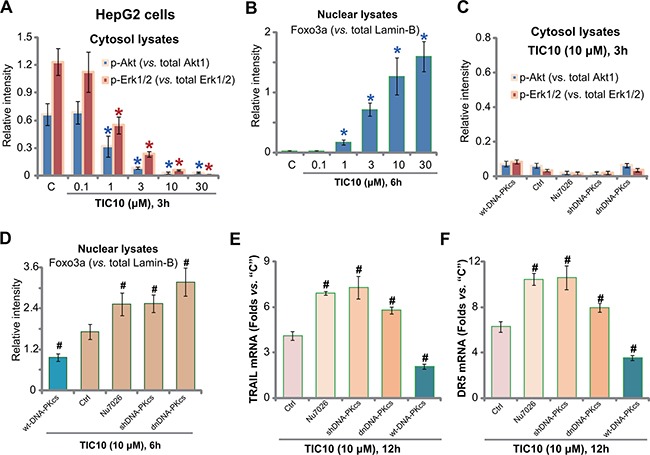
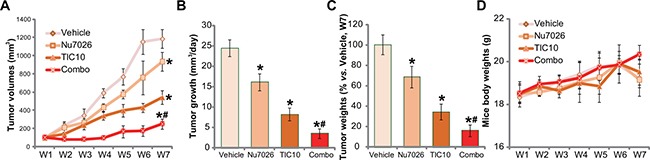
The current study tested the anti-hepatocellular carcinoma (HCC) cell activity of TIC10, a first-in-class small-molecule tumor necrosis (TNF)-related apoptosis-inducing ligand (TRAIL) inducer. TIC10 exerted potent anti-proliferative and pro-apoptotic actions in primary and established human HCC cells. TIC10 blocked Akt-Erk activation, leading to Foxo3a nuclear translocation, as well as TRAIL and death receptor-5 (DR5) transcription in HCC cells. We propose that DNA-PKcs is a major resistance factor of TIC10 possibly via inhibiting Foxo3a nuclear translocation. DNA-PKcs inhibition, knockdown or mutation facilitated TIC10-induced Foxo3a nuclear translocation, TRAIL/DR5 expression and cell apoptosis. Reversely, exogenous DNA-PKcs over-expression inhibited above actions by TIC10. In vivo, oral administration of TIC10 significantly inhibited HepG2 tumor growth in nude mice, which was further potentiated with Nu7026 co-administration. Thus, TIC10 shows promising anti-HCC activity, alone or together with DNA-PKcs inhibitors.
Keywords: DNA-PKcs; TIC10; TRAIL and chemosensitization; hepatocellular carcinoma (HCC).
Conflict of interest statement
The authors have no conflicts of interest.
Figures
Similar articles
-
Small-Molecule ONC201/TIC10 Targets Chemotherapy-Resistant Colorectal Cancer Stem-like Cells in an Akt/Foxo3a/TRAIL-Dependent Manner.Cancer Res. 2015 Apr 1;75(7):1423-32. doi: 10.1158/0008-5472.CAN-13-3451. Epub 2015 Feb 20. Cancer Res. 2015. PMID: 25712124 Free PMC article.
-
Dual inactivation of Akt and ERK by TIC10 signals Foxo3a nuclear translocation, TRAIL gene induction, and potent antitumor effects.Sci Transl Med. 2013 Feb 6;5(171):171ra17. doi: 10.1126/scitranslmed.3004828. Sci Transl Med. 2013. PMID: 23390247 Free PMC article.
-
Identification of TRAIL-inducing compounds highlights small molecule ONC201/TIC10 as a unique anti-cancer agent that activates the TRAIL pathway.Mol Cancer. 2015 May 1;14:99. doi: 10.1186/s12943-015-0346-9. Mol Cancer. 2015. PMID: 25927855 Free PMC article.
-
DNA-PKcs: A promising therapeutic target in human hepatocellular carcinoma?DNA Repair (Amst). 2016 Nov;47:12-20. doi: 10.1016/j.dnarep.2016.10.004. Epub 2016 Oct 15. DNA Repair (Amst). 2016. PMID: 27789167 Review.
-
Hepatocellular carcinoma: targeting of oncogenic signaling networks in TRAIL resistant cancer cells.Mol Biol Rep. 2014 Oct;41(10):6909-17. doi: 10.1007/s11033-014-3577-8. Epub 2014 Jul 19. Mol Biol Rep. 2014. PMID: 25037270 Review.
Cited by
-
An mTOR and DNA-PK dual inhibitor CC-115 hinders non-small cell lung cancer cell growth.Cell Death Discov. 2022 Jun 18;8(1):293. doi: 10.1038/s41420-022-01082-6. Cell Death Discov. 2022. PMID: 35717530 Free PMC article.
-
Development and Evolution of DNA-Dependent Protein Kinase Inhibitors toward Cancer Therapy.Int J Mol Sci. 2022 Apr 12;23(8):4264. doi: 10.3390/ijms23084264. Int J Mol Sci. 2022. PMID: 35457081 Free PMC article. Review.
-
Therapeutic targeting of TRAIL death receptors.Biochem Soc Trans. 2023 Feb 27;51(1):57-70. doi: 10.1042/BST20220098. Biochem Soc Trans. 2023. PMID: 36629496 Free PMC article. Review.
-
The mitochondrial protease ClpP is a druggable target that controls VSMC phenotype by a SIRT1-dependent mechanism.Redox Biol. 2024 Jul;73:103203. doi: 10.1016/j.redox.2024.103203. Epub 2024 May 21. Redox Biol. 2024. PMID: 38823208 Free PMC article.
-
Beyond DNA Repair: DNA-PKcs in Tumor Metastasis, Metabolism and Immunity.Cancers (Basel). 2020 Nov 16;12(11):3389. doi: 10.3390/cancers12113389. Cancers (Basel). 2020. PMID: 33207636 Free PMC article. Review.
References
-
- Siegel R, Ma J, Zou Z, Jemal A. Cancer statistics, 2014. CA Cancer J Clin. 2014;64:9–29. - PubMed
-
- Cheng L, Chen YZ, Peng Y, Yi N, Gu XS, Jin Y, Bai XM. Ceramide production mediates cinobufotalin-induced growth inhibition and apoptosis in cultured hepatocellular carcinoma cells. Tumour Biol. 2015;36:5763–5771. - PubMed
MeSH terms
Substances
LinkOut - more resources
Full Text Sources
Other Literature Sources
Medical
Research Materials
Miscellaneous
