. 2017 May 30;8(22):35804-35823.
doi: 10.18632/oncotarget.16208.

Binding of galectin-1 to integrin β1 potentiates drug resistance by promoting survivin expression in breast cancer cells

Affiliations

Binding of galectin-1 to integrin β1 potentiates drug resistance by promoting survivin expression in breast cancer cells

KeeSoo Nam et al. Oncotarget. .

Abstract

Galectin-1 is a β-galactoside binding protein secreted by many types of aggressive cancer cells. Although many studies have focused on the role of galectin-1 in cancer progression, relatively little attention has been paid to galectin-1 as an extracellular therapeutic target. To elucidate the molecular mechanisms underlying galectin-1-mediated cancer progression, we established galectin-1 knock-down cells via retroviral delivery of short hairpin RNA (shRNA) against galectin-1 in two triple-negative breast cancer (TNBC) cell lines, MDA-MB-231 and Hs578T. Ablation of galectin-1 expression decreased cell proliferation, migration, invasion, and doxorubicin resistance. We found that these effects were caused by decreased galectin-1-integrin β1 interactions and suppression of the downstream focal adhesion kinase (FAK)/c-Src pathway. We also found that silencing of galectin-1 inhibited extracellular signal-regulated kinase (ERK)/signal transducer and activator of transcription 3 (STAT3) signaling, thereby down-regulating survivin expression. This finding implicates STAT3 as a transcription factor for survivin. Finally, rescue of endogenous galectin-1 knock-down and recombinant galectin-1 treatment both recovered signaling through the FAK/c-Src/ERK/STAT3/survivin pathway. Taken together, these results suggest that extracellular galectin-1 contributes to cancer progression and doxorubicin resistance in TNBC cells. These effects appear to be mediated by galectin-1-induced up-regulation of the integrin β1/FAK/c-Src/ERK/STAT3/survivin pathway. Our results imply that extracellular galectin-1 has potential as a therapeutic target for triple-negative breast cancer.

Keywords: STAT3; drug resistance; galectin-1; integrin β1; survivin.


Conflict of interest statement

CONFLICTS OF INTEREST

The authors declare no conflicts of interest.

Figures

Figure 1
Figure 1. Galectin-1 is overexpressed in specimens from patients with triple negative breast cancer and ablation of galectin-1 decreases secretion and cell surface level of galectin-1
(A) Galectin-1 protein expression was analyzed in the human breast cancer cell lines MDA-MB-231, Hs578T, BT474, T47D, and MCF7 by western blotting. (B) The efficiency of galectin-1 silencing with different human galectin-1-targeting sequences was confirmed by western blot analysis (MDA-MB-231, Gal-1 sh1 and Gal-1 sh2; Hs578T, Gal-1 sh1 and Gal-1 sh2). Scrambled shRNA was also used as a control (MDA-MB-231 Cont sh and Hs578T Cont sh). (C) Ablation of galectin-1 secretion into culture medium was detected by TCA/acetone precipitation of proteins. Equal protein loading of each lane was confirmed by Ponceau staining. (D) Silencing of cell surface galectin-1 was confirmed by biotinylation assays. Cells were incubated with 0.5 mg/ml EZ-Link NHS-SS-Biotin for 30 min at 4°C. The biotinylated proteins were captured with streptavidin and analyzed by western blotting using anti-galectin-1 antibody. ERK was used as an endogenous negative control. (E) Galectin-1 knock-down was confirmed by flow cytometry cell surface labeling experiments with anti-galectin-1 antibody. Experiments were performed in triplicate, and a representative histogram is shown. (F) Western blot analysis showing the expression levels of galectin-1 and survivin in lysates of primary tumor specimens from patients with breast cancer (n = 24). Galectin-1 and survivin expression were significantly up-regulated in patients with TNBC compared to patients with non-TNBC. Error bars represent means ± SD of all experiments (*p < 0.05).
Figure 2
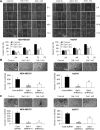
Figure 2. Effect of galectin-1 silencing on migration and invasion of human breast cancer cells
(A) For the wound healing assay, cells were seeded at a density of 3 × 10⁵ cells/well in 6-well plates to achieve 95% confluence. A vertical or horizontal wound was created using a 10 ml pipette tip, after which the wounded cells were washed three times with PBS and FBS-free DMEM. Over 72 h, the wounded areas were photographed at the designated times to assess wound closure. Assays were carried out in triplicate. Error bars represent means ± SD of all experiments. p values (bar vs bar, left panel) : p = 0.003 (1 vs 2), p = 0.004 (1 vs 3), p = 0.002 (4 vs 5), p = 0.003 (4 vs 6), p = 0.0001 (7 vs 8), p = 0.002 (7 vs 9). p values (bar vs bar, right panel) : p = 0.04 (4 vs 5), p = 0.04 (4 vs 6), p = 0.0005 (7 vs 8), p = 0.0004 (7 vs 9). Scale bar = 200 μm. (B) For the transwell migration or (C) invasion assay, cells were seeded in 24-well transwell plates and incubated for 18 h in medium containing 0.5% FBS. For the invasion assay, the invasion rate was measured using transwell plates in which the upper chamber was filled with matrigel. Cells were stained with crystal violet dye (top) and counted using a light microscope (bottom). Error bars represent means ± SD of all experiments. p values (bar vs bar, B-left panel) : p = 0.0008 (1 vs 2), p = 0.02 (1 vs 3). p values (bar vs bar, B-right panel) : p = 0.0002 (1 vs 2), p = 0.006 (1 vs 3). p values (bar vs bar, C-left panel) : p = 0.0001 (1 vs 2), p = 0.0004 (1 vs 3). p values (bar vs bar, C-right panel) : p = 0.0004 (1 vs 2), p = 0.004 (1 vs 3). Scale bar = 200 μm.
Figure 3
Figure 3. Silencing of galectin-1 decreases doxorubicin resistance of human breast cancer cells
(A) Cells were seeded at a density of 3 × 10³ cells/well in 96-well plates and treated with the indicated concentration of doxorubicin for 48 h. Viability was then assessed by the MTT assay. The results were expressed as the mean ± SD. p values (bar vs bar, left panel) : p = 0.004 (7 vs 8), p = 0.002 (7 vs 9), p = 0.009 (10 vs 11), p = 0.0001 (10 vs 12), p = 0.0004 (13 vs 14), p = 0.0006 (13 vs 15), p = 2.6E-05 (16 vs 17), p = 7.44E-08 (16 vs 18). p values (bar vs bar, right panel) : p = 0.005 (7 vs 8), p = 6.28E-07 (7 vs 9), p = 4.22E-06 (10 vs 11), p = 2.25E-09 (10 vs 12), p = 0.0001 (13 vs 14), p = 0.0001 (13 vs 15), p = 2.52E-10 (16 vs 17), p = 8.12E-13 (16 vs 18). (B) Proliferation of galectin-1 knock-down (MDA-MB-231, Gal-1 sh1 and Gal-1 sh2; Hs578T Gal-1 sh1 and Gal-1 sh2) cells and control (MDA-MB-231 Cont sh and Hs578T Cont sh) cells upon treatment with 0.1 μM of doxorubicin. Cells were seeded at a density of 2×10⁴ cells/well in 12-well plates and counted with a hemocytometer for 5 days. Medium containing fresh doxorubicin was replenished every 2 days. The results were expressed as the mean ± SD. p values (control vs doxorubicin, left panel) : p = 1.98E-08 (Cont sh), p = 1.98E-08 (Gal-1 sh1), p = 3.48E-06 (Gal-1 sh2). p values (control vs doxorubicin, right panel) : p = 5.7E-07 (Cont sh), p = 1.12E-07 (Gal-1 sh1), p = 5.70E-07 (Gal-1 sh2) (C) Cell cycle analysis of galectin-1 knock-down (MDA-MB-231, Gal-1 sh1 and Gal-1 sh2; Hs578T, Gal-1 sh1 and Gal-1 sh2) cells and control (MDA-MB-231 Cont sh and Hs578T Cont sh) cells upon treatment with doxorubicin. Cells were seeded at a density of 1 × 10⁶ cells in 100-mm dishes. Cells were treated with 0.5 μM doxorubicin for 48 h, fixed in methanol, and incubated in PBS containing 50 μg/ml propidium iodide (PI) and 1 mg/ml RNase. Cell cycle analysis was performed by flow cytometry. The results were expressed as the mean ± SD. p values (upper-left panel) : p = 0.006 (control, Cont sh vs Gal-1 sh1, S phase), p = 0.003 (control, Cont sh vs Gal-1 sh2, S phase), p = 0.004 (control, Cont sh vs Gal-1 sh2, G1 phase), p = 0.004 (doxorubicin, Cont sh vs Gal-1 sh1, G1 phase), p = 0.001 (doxorubicin, Cont sh vs Gal-1 sh1, G0 phase), p = 0.03 (doxorubicin, Cont sh vs Gal-1 sh2, G2/M phase), p = 0.004 (doxorubicin, Cont sh vs Gal-1 sh2, G0 phase). p values (bar vs bar, upper-right panel) : p = 0.009 (1 vs 4), p = 0.0007 (2 vs 5), p = 0.001 (3 vs 6), p = 0.004 (4 vs 5), p = 0.01 (4 vs 6). p values (lower-left panel) : p = 0.03 (control, Cont sh vs Gal-1 sh1, G2/M phase), p = 0.008 (control, Cont sh vs Gal-1 sh1, S phase), p = 0.004 (control, Cont sh vs Gal-1 sh2, S phase), p = 0.01 (control, Cont sh vs Gal-1 sh2, G1 phase), p = 9.39E-05 (doxorubicin, Cont sh vs Gal-1 sh1, G2/M phase), p = 1.5E-05 (doxorubicin, Cont sh vs Gal-1 sh1, G0 phase), p = 2.5E-05 (doxorubicin, Cont sh vs Gal-1 sh2, G2/M phase), p = 2.3E-06 (doxorubicin, Cont sh vs Gal-1 sh2, G0 phase). p values (bar vs bar, upper-right panel) : p = 3.04E-0.5 (1 vs 4), p = 1.58E-06 (2 vs 5), p = 5.66E-07 (3 vs 6), p = 2.08E-05 (4 vs 5), p = 2.01E-06 (4 vs 6).
Figure 4
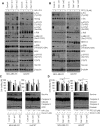
Figure 4. Ablation of galectin-1 blocks doxorubicin-induced survivin expression
(A) Galectin-1 knock-down (MDA-MB-231, Gal-1 sh1 and Gal-1 sh2; Hs578T, Gal-1 sh1 and Gal-1 sh2) cells and control (MDA-MB-231 Cont sh and Hs578T Cont sh) cells were treated with 1 μM doxorubicin for 24 h. Cells were then harvested and analyzed by western blotting using antibodies specific for survivin, caspase-3, and β-tubulin. (B) qRT-PCR analysis of survivin mRNA levels in control shRNA and galectin-1 shRNA cells. qRT-PCR values were normalized to that of GAPDH mRNA. The results were expressed as the mean ± SD. p values (bar vs bar, left panel) : p = 0.02 (1 vs 2), p = 0.002 (3 vs 4), p = 0.007 (5 vs 6), p = 0.04 (1 vs 3), p = 0.01 (1 vs 5), p = 0.03 (2 vs 4), p = 0.01 (2 vs 6). p values (bar vs bar, right panel) : p = 0.005 (1 vs 2), p = 4.74E-06 (3 vs 4), p = 9.02E-05 (5 vs 6), p = 0.0004 (1 vs 3), p = 1.42E-05 (1 vs 5), p = 0.0002 (2 vs 4), p = 0.002 (2 vs 6). (C) At 24 h after cell seeding, control shRNA (MDA-MB-231 Cont sh and Hs578T Cont sh) cells were treated with doxorubicin (1 μM) and/or anti-galectin-1 antibodies (Gal-1 ab; 2 μg/ml). After 48 h, cell lysates were analyzed by western blotting and (D) qRT-PCR. qRT-PCR values were normalized to that of GAPDH mRNA. The results were expressed as the mean ± SD. p values (bar vs bar, left panel) : p = 0.0001 (1 vs 2), p = 8.43E-05 (2 vs 4), p = 0.002 (1 vs 3), p = 2.03E-05 (3 vs 4). p values (bar vs bar, right panel) : p = 0.0002 (1 vs 2), p = 6.26E-05 (2 vs 4), p = 0.0001 (1 vs 3), p = 0.002 (3 vs 4). (E) Galectin-1 knock-down (MDA-MB-231, Gal-1 sh1 and Gal-1 sh2; Hs578T, Gal-1 sh1 and Gal-1 sh2) cells were treated with doxorubicin (1 μM) and/or 300 ng/ml recombinant human galectin-1 (rhGal-1) and then incubated for 48 h. Cell lysates were then analyzed by western blotting and (F) qRT-PCR. qRT-PCR values were normalized to that of GAPDH mRNA. Error bars represent means ± SD of all experiments. p values (bar vs bar, left panel) : p = 0.0003 (1 vs 2), p = 0.0001 (1 vs 3), p = 4.24E-05 (3 vs 4), p = 0.0002 (3 vs 5), p = 2.25E-05 (5 vs 6), p = 5.22E-05 (4 vs 6), p = 2.02E-05 (1 vs 7), p = 5.26E-05 (7 vs 8), p = 0.005 (7 vs 9), p = 0.03 (9 vs 10), p = 0.0006 (8 vs 10). p values (bar vs bar, right panel) : p = 0.0002 (1 vs 2), p = 6.78E-05 (1 vs 3), p = 5.24E-05 (3 vs 4), p = 0.0002 (3 vs 5), p = 2.03E-05 (5 vs 6), p = 3.4E-06 (4 vs 6), p = 0.0003 (1 vs 7), p = 0.0002 (7 vs 8), p = 9.69E-05 (7 vs 9), p = 6.39E-06 (9 vs 10), p = 0.0002 (8 vs 10). (G) At 24 h after seeding, BT474, MCF7, and KPL4 wild-type cells were treated with doxorubicin (0.5 μM) and/or recombinant human galectin-1 (rhGal-1; 300 ng/ml) for 48 h. Cell lysates were then analyzed by western blotting with the indicated antibodies and (H) qRT-PCR. qRT-PCR values were normalized to that of GAPDH mRNA. The results were expressed as the mean ± SD. p values (bar vs bar, BT474) : p = 0.002 (1 vs 2), p = 6.43E-05 (2 vs 4), p = 0.002 (1 vs 3), p = 0.001 (3 vs 4). p values (bar vs bar, MCF7) : p = 7.44E-05 (1 vs 2), p = 0.007 (2 vs 4), p = 0.001 (1 vs 3), p = 0.01 (3 vs 4). p values (bar vs bar, KPL4) : p = 7.12E-06 (1 vs 2), p = 0.0001 (2 vs 4), p = 0.0002 (1 vs 3), p = 0.006 (3 vs 4).
Figure 5
Figure 5. Galectin-1 drives survivin expression through the ERK/STAT3 pathway in human breast cancer cells
(A) Effect of STAT3 signaling on survivin expression. Cells were seeded in a 100-mm dish at a density of 1 × 10⁶ cells and subjected to subcellular fractionation. The nuclear fraction was analyzed by western blotting using antibodies against β-tubulin as a cytosolic marker and c-Jun as a nuclear marker. (B, C) Effect of galectin-1 on survivin expression. Control shRNA (MDA-MB-231 Cont sh and Hs578T Cont sh) cells were treated with anti-galectin-1 antibodies (Gal-1 ab; 2 μg/ml), and (C) recombinant human galectin-1 (rhGal-1; 300 ng/ml) for 48 h. Nuclear fractions were assessed by western blotting. (D) Galectin-1 knock-down (MDA-MB-231, Gal-1 sh1 and Gal-1 sh2; Hs578T, Gal-1 sh1 and Gal-1 sh2) cells and control (MDA-MB-231 Cont sh and Hs578T Cont sh) cells were treated with the STAT3 inhibitor S3I-201 (50 μM) and subsequently analyzed by western blotting. (E) Effect of STAT3 signaling on doxorubicin-induced apoptosis. Cells were treated with doxorubicin (1 μM) and/or S3I-201 (50 μM) for 24 h and subjected to MTT assays and western blot analysis with the indicated antibodies. Error bars represent means ± SD of all experiments. p values (bar vs bar, left panel) : p = 5.95E-05 (1 vs 2), p = 1.04E-05 (1 vs 3), p = 3.29E-06 (1 vs 4), p = 6.74E-07 (1 vs 5), p = 8.8E-09 (5 vs 6), p = 2.25E-07 (5 vs 7), p = 2.24E-10 (7 vs 8), p = 1.42E-07 (6 vs 8), p = 2.89E-05 (1 vs 9), p = 1.59E-05 (9 vs 10), p = 0.004 (9 vs 11), p = 1.36E-07 (11 vs 12), p = 1.01E-09 (4 vs 8), p = 3.4E-10 (10 vs 12), p = 3.76E-09 (4 vs 12). p values (bar vs bar, right panel) : p = 4.75E-05 (1 vs 4), p = 3.83E-09 (1 vs 5), p = 2.53E-09 (5 vs 6), p = 4.29E-09 (5 vs 7), p = 2.16E-09 (7 vs 8), p = 2.23E-05 (6 vs 8), p = 8.63E-05 (1 vs 9), p = 2.65E-06 (9 vs 10), p = 1.46E-06 (9 vs 11). p = 1.35E-07 (11 vs 12), p = 3.38E-09 (4 vs 8), p = 3.71E-07 (10 vs 12), p = 1.34E-09 (4 vs 12). (F) Control and galectin-1 knock-down cells were treated with U0126 (10 μM) for 24 h and subsequently analyzed by western blotting. (G) Effect of the ERK pathway on doxorubicin-induced apoptosis. Control and galectin-1 knock-down cells were treated with doxorubicin (1 μM) and/or U0126 (10 μM) for 24. MTT assays and western blotting were then performed. Error bars represent means ± SD of all experiments. p values (bar vs bar, left panel) : p = 6.22E-05 (1 vs 4), p = 1.8E-05 (1 vs 5), p = 7.92E-08 (5 vs 6), p = 9.23E-06 (5 vs 7), p = 0.001 (7 vs 8), p = 6.3E-06 (6 vs 8), p = 2.11E-05 (1 vs 9), p = 0.0005 (9 vs 10), p = 9.14E-05 (9 vs 11). p = 2.71E-05 (11 vs 12), p = 4.73E-07 (4 vs 8), p = 0.0004 (10 vs 12), p = 2.34E-07 (4 vs 12). p values (bar vs bar, right panel) : p = 2.94E-05 (1 vs 4), p = 2.08E-06 (1 vs 5), p = 0.0004 (5 vs 6), p = 8.5E-05 (5 vs 7), p = 8.1E-06 (7 vs 8), p = 8.1E-06 (6 vs 8), p = 3.04E-06 (1 vs 9), p = 0.001 (9 vs 10), p = 0.006 (9 vs 11). p = 4.89E-08 (11 vs 12), p = 1.48E-10 (4 vs 8), p = 2.51E-08 (10 vs 12), p = 1.18E-10 (4 vs 12).
Figure 6
Figure 6. Galectin-1 ablation attenuates survivin expression via the c-Src/ERK/STAT3 signaling pathway
(A) Cells were seeded at a density of 1 × 10⁶ cells in 100-mm dishes. After seeding, the cells were transfected with a construct driving the expression of HA-tagged c-Src or (B) treated with PP2 (10 μM) and subsequently analyzed by western blotting. (C, D) Effect of c-Src signaling on doxorubicin-induced apoptosis. Cells were seeded in a 100-mm dish at a density of 1 × 10⁶ cells. At 24 h after cell seeding, (C) cells were transfected with a construct driving the expression of HA-tagged c-Src, incubated for 48 h, and analyzed by the MTT assay and western blotting. Cells were then treated with doxorubicin (1 μM) for 24 h. Error bars represent means ± SD of all experiments. p values (bar vs bar, left panel) : p = 0.0008 (1 vs 5), p = 9.15E-05 (5 vs 6), p = 0.03 (5 vs 7), p = 2.57E-08 (6 vs 8), p = 2.93E-06 (1 vs 9), p = 2.15E-07 (9 vs 10), p = 0.0001 (9 vs 11), p = 1.23E-09 (10 vs 12). p values (bar vs bar, right panel) : p = 0.003 (1 vs 3), p = 0.03 (1 vs 5), p = 6.34E-06 (5 vs 6), p = 0.0002 (5 vs 7), p = 1.79E-06 (6 vs 8), p = 0.007 (1 vs 9), p = 1.65E-07 (9 vs 10), p = 7.69E-07 (9 vs 11), p = 7.27E-10 (10 vs 12). (D) Cells were treated with doxorubicin (0.5 μM) and/or PP2(10 μM) for 24 h, after which they were analyzed by the MTT assay and western blotting. Error bars represent means ± SD of all experiments. p values (bar vs bar, left panel) : p = 7.93E-05 (1 vs 4), p = 0.0001 (1 vs 5), p = 6.73E-06 (5 vs 6), p = 0.001 (5 vs 7), p = 0.002 (7 vs 8), p = 7.59E-05 (6 vs 8), p = = 3.03E-05 (1 vs 9), p = 0.0002 (9 vs 10), p = 0.0002 (9 vs 11), p = 0.03 (11 vs 12), p = 5.85E-06 (4 vs 8), p = 0.003 (10 vs 12), p = 1.36E-05 (4 vs 12). p values (bar vs bar, right panel) : p = 0.01 (1 vs 3), p = 0.002 (1 vs 4), p = 8.34E-07 (1 vs 5), p = 0.0007 (5 vs 6), p = 0.03 (5 vs 7), p = 0.0001 (7 vs 8), p = 7.61E-09 (6 vs 8), p = 4.58E-07 (1 vs 9), p = 0.002 (9 vs 10), p = 0.01 (9 vs 11). p = 4.89E-09 (11 vs 12), p = 6.76E-10 (4 vs 8), p = 8.43E-09 (10 vs 12), p = 4.45E-10 (4 vs 12).
Figure 7
Figure 7. Extracellular galectin-1 up-regulates the FAK/c-Src/ERK/STAT3/survivin pathway by directly interacting with integrin β1
(A) Assessment of galectin-1 binding to integrin β1. Cells were seeded in 100-mm dishes at a density of 1 × 10⁶cells. Cells were then incubated with 1 mM BS3 for 20 min to cross-link galectin-1 to cell surface proteins. Lysates were immunoprecipitated with anti-galectin-1 antibody and analyzed by western blotting with anti-integrin β1 antibody. (B) At 24 h after cell seeding, control shRNA (MDA-MB-231 Cont sh and Hs578T Cont sh) cells were treated with anti-galectin-1 antibodies (Gal-1 ab; 2 μg/ml) and further incubated for 48 h. Treated cells were then incubated with BS3. Next, cell lysates were immunoprecipitated with anti-galectin-1 antibody and analyzed by western blotting with anti-integrin β1 antibody. (C) Cells were seeded in 100-mm dishes at a density of 1 × 10⁶ cells. Galectin-1 knock-down (MDA-MB-231, Gal-1 sh1 and Gal-1 sh2; Hs578T, Gal-1 sh1 and Gal-1 sh2) cells were then treated with recombinant human galectin-1 (rhGal-1; 300 ng/ml) for 48 h. Next, cell lysates were immunoprecipitated with anti-galectin-1 antibody and analyzed by western blotting with anti-integrin β1 antibody. (D) Effect of integrin β1 on the FAK/c-Src/ERK/STAT3/survivin pathway. Control shRNA (MDA-MB-231 Cont sh and Hs578T Cont sh) cells were transfected with integrin β1-targeting siRNA for 48 h and analyzed by western blotting and (E) qRT-PCR. qRT-PCR values were normalized to that of GAPDH mRNA. The results were expressed as the mean ± SD. p values (bar vs bar, left panel) : p = 0.003 (1 vs 2), p = 0.0008 (1 vs 3), p = 0.0007 (1 vs 4). p values (bar vs bar, right panel) : p = 0.003 (1 vs 2), p = 0.0002 (1 vs 3), p = 5.69E-05 (1 vs 4). (F) Effect of integrin β1 on doxorubicin-induced apoptosis. Cells were transfected with integrin β1-targeting siRNA for 48 h and then subjected to MTT assays and western blot analysis with the indicated antibodies. Cells were then treated with 1 μM doxorubicin for 24 h. Error bars represent means ± SD of all experiments. p values (bar vs bar, left panel) : p = 8.1E-05 (1 vs 3), p = 2.79E-10 (3 vs 4), p = 9.39E-11 (2 vs 4), p = 1.56E-05 (1 vs 5), p = 1.02E-10 (5 vs 6), p = 1.85E-09 (5 vs 7), p = 1.76E-07 (7 vs 8), p = 6.64E-09 (6 vs 8), p = 6.06E-05 (1 vs 9), p = 4.85E-09 (9 vs 10), p = 3.3E-10 (9 vs 11), p = 1.35E-08 (11 vs 12), p = 2.28E-11 (10 vs 12). p values (bar vs bar, right panel) : p = 0.001 (1 vs 3), p = 4.86E-06 (3 vs 4), p = 1.97E-11 (2 vs 4), p = 7.66E-05 (1 vs 5), p = 7.22E-10 (5 vs 6), p = 5.52E-05 (5 vs 7), p = 5.98E-13 (7 vs 8), p = 4.43E-05 (6 vs 8), p = 1.24E-05 (1 vs 9), p = 1.96E-07 (9 vs 10), p = 6.78E-07 (9 vs 11), p = 3.99E-11 (11 vs 12), p = 8.92E-09 (10 vs 12).
Figure 8
Figure 8. Rescue of galectin-1 knock-down restores FAK/c-Src/ERK/STAT3/survivin signaling
(A) Effect of galectin-1 on the FAK/c-Src/ERK/STAT3/survivin pathway. Cells were seeded in 100-mm dishes at a density of 1 × 10⁶ cells. Galectin-1 knock-down (MDA-MB-231, Gal-1 sh1 and Gal-1 sh2; Hs578T, Gal-1 sh1 and Gal-1 sh2) cells and BT474 wild-type cells were treated with recombinant human galectin-1 (rhGal-1; 300 ng/ml) for 48 h and analyzed by western blotting. (B) At 24 h after cell seeding, control shRNA (MDA-MB-231 Cont sh and Hs578T Cont sh) cells were treated with anti-galectin-1 antibodies (Gal-1 ab; 2 μg/ml) and incubated for a further 48 h. The cells were then analyzed by western blotting with the indicated antibodies. (C) The pBabe-puro-myc/his-shRNA resistant galectin-1 construct was transfected into MDA-MB-231 Gal-1 sh1 and Hs578T Gal-1 sh1 cells. Cell lysates were then subjected to western blot analysis.

Similar articles

Cited by

References

    1. Foulkes WD, Smith IE, Reis-Filho JS. Triple-negative breast cancer. N Engl J Med. 2010;363:1938–48. doi: 10.1056/NEJMra1001389. - DOI - PubMed
    1. Carey LA, Perou CM, Livasy CA, Dressler LG, Cowan D, Conway K, Karaca G, Troester MA, Tse CK, Edmiston S, Deming SL, Geradts J, Cheang MC, et al. Race, breast cancer subtypes, and survival in the Carolina Breast Cancer Study. JAMA. 2006;295:2492–502. doi: 10.1001/jama.295.21.2492. - DOI - PubMed
    1. Liedtke C, Mazouni C, Hess KR, Andre F, Tordai A, Mejia JA, Symmans WF, Gonzalez-Angulo AM, Hennessy B, Green M, Cristofanilli M, Hortobagyi GN, Pusztai L. Response to neoadjuvant therapy and long-term survival in patients with triple-negative breast cancer. J Clin Oncol. 2008;26:1275–81. doi: 10.1200/JCO.2007.14.4147. - DOI - PubMed
    1. Barondes SH, Castronovo V, Cooper DN, Cummings RD, Drickamer K, Feizi T, Gitt MA, Hirabayashi J, Hughes C, Kasai K, et al. Galectins: a family of animal beta-galactoside-binding lectins. Cell. 1994;76:597–8. doi. - PubMed
    1. Liu FT, Rabinovich GA. Galectins as modulators of tumour progression. Nat Rev Cancer. 2005;5:29–41. doi: 10.1038/nrc1527. - DOI - PubMed

MeSH terms