

Targeting protein homeostasis with nelfinavir/salinomycin dual therapy effectively induces death of mTORC1 hyperactive cells
- PMID: 28415776
- PMCID: PMC5564719
- DOI: 10.18632/oncotarget.16232
Targeting protein homeostasis with nelfinavir/salinomycin dual therapy effectively induces death of mTORC1 hyperactive cells
Abstract
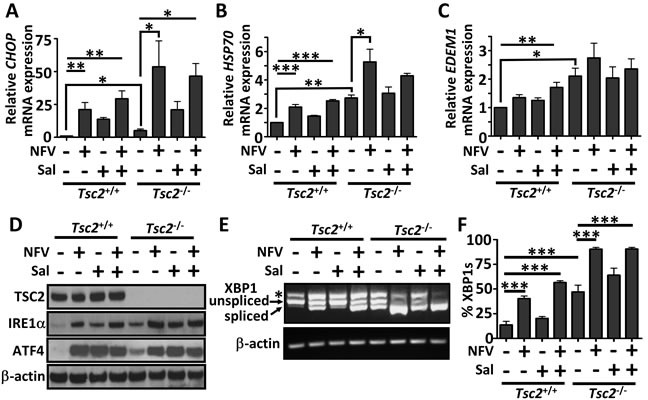
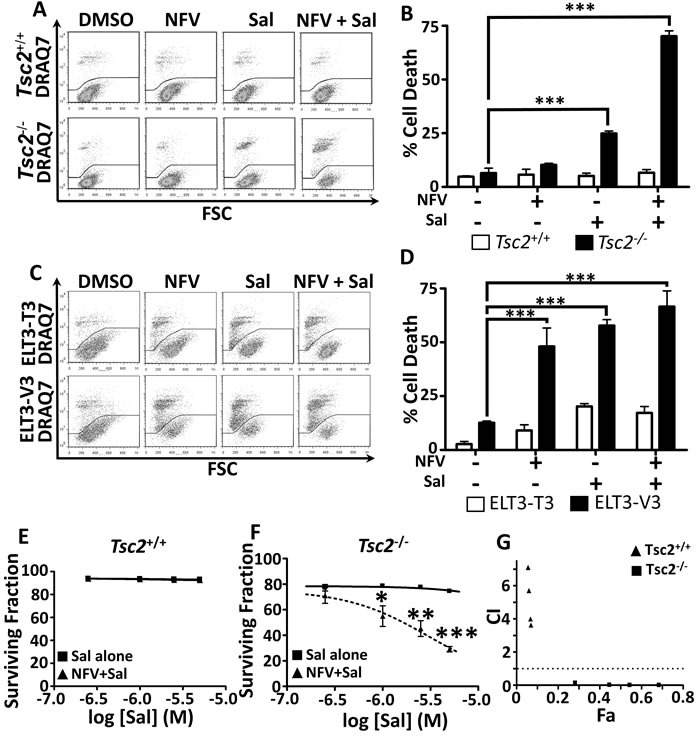
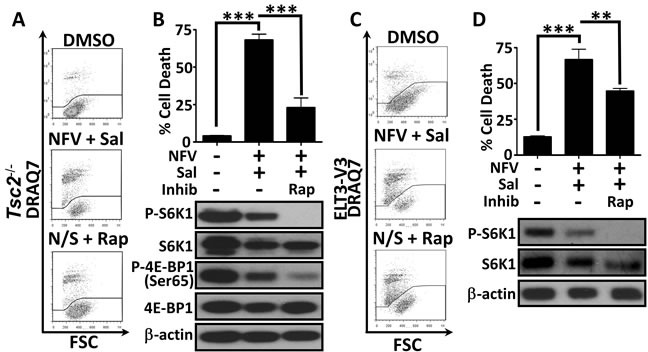
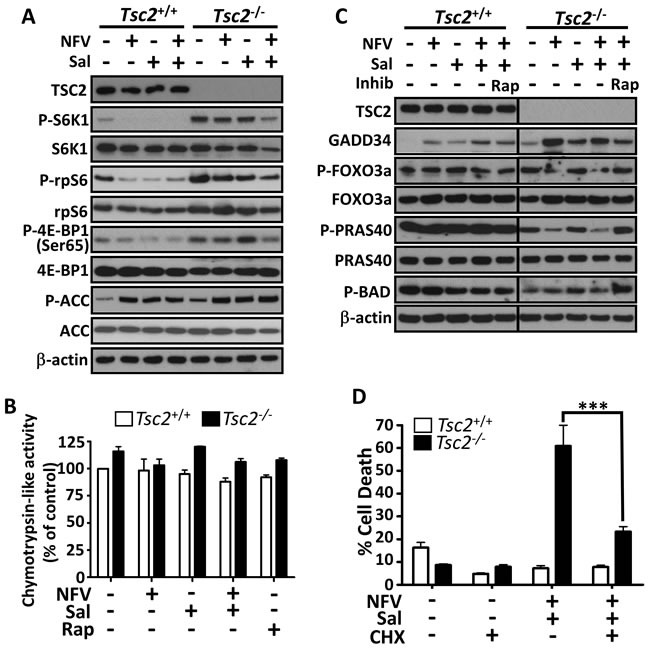
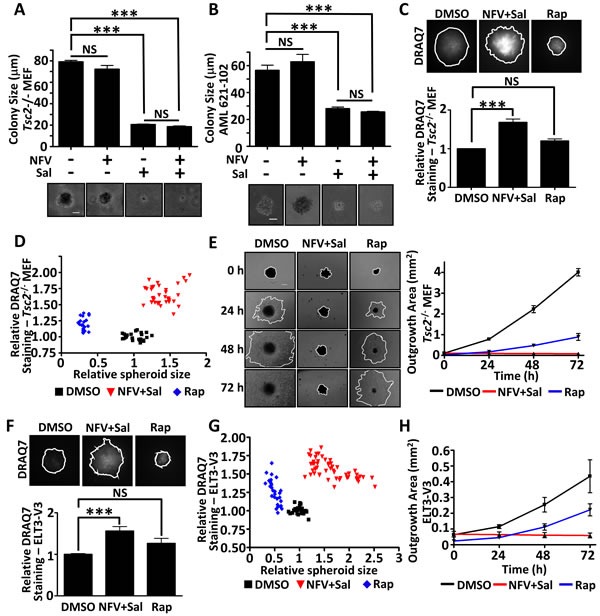
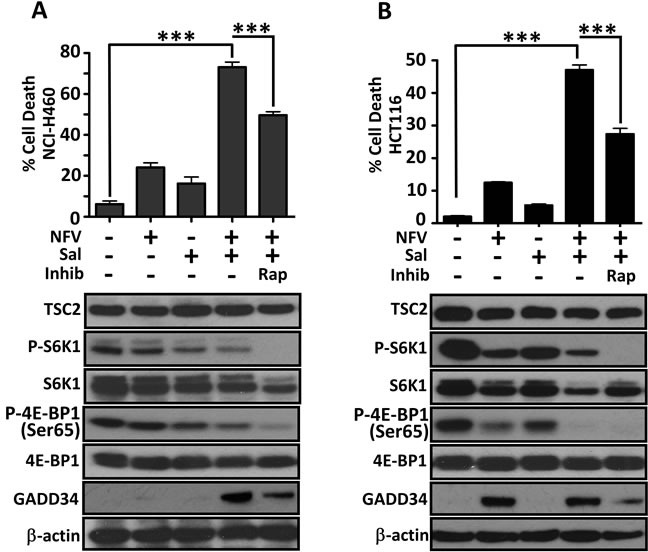
Uncontrolled cell growth in Tuberous Sclerosis Complex occurs due to inappropriate activation of mechanistic (mammalian) target of rapamycin complex 1 (mTORC1). The current therapy, rapamycin, produced promising clinical trial results, but patient tumours regrow if treatment is discontinued, revealing rapamycin has cytostatic properties rather than a cytotoxic effect. Taking advantage of the enhanced levels of endoplasmic reticulum (ER) stress present in TSC2-null cells, we investigated drug combinations producing a cytotoxic response. We found a nelfinavir and salinomycin combination specifically killed TSC2-deficient, mTORC1 hyperactive cells. Cytotoxicity was rescued by reducing protein synthesis, either through mTORC1 inhibition or cycloheximide treatment. This indicates that the drug combination targets the cells by tipping the protein homeostasis balance of the already metabolically stressed TSC2-deficient cells in favour of cell death. Furthermore, this drug combination also inhibited tumour formation in TSC2-deficient cell models and caused tumour spheroid death in 3D culture. Importantly, the 3D assay could differentiate the cytostatic agent, rapamycin, from the cytotoxic nelfinavir/salinomycin combination. Sporadic cancer cell lines with hyperactive mTORC1 signalling were also susceptible to this nelfinavir/salinomycin drug combination. This work indicates that the protein homeostasis pathway is an attractive therapeutic target in both Tuberous Sclerosis Complex and mTORC1-driven sporadic cancers.
Keywords: TSC; cell death; mTORC1; nelfinavir; therapy.
Conflict of interest statement
RJE is non-executive director of Biostatus Ltd, the vendor of DRAQ7.
Figures
Similar articles
-
Energy Stress-Mediated Cytotoxicity in Tuberous Sclerosis Complex 2-Deficient Cells with Nelfinavir and Mefloquine Treatment.Cancers (Basel). 2018 Oct 10;10(10):375. doi: 10.3390/cancers10100375. Cancers (Basel). 2018. PMID: 30308940 Free PMC article.
-
Loss of tuberous sclerosis complex 2 sensitizes tumors to nelfinavir-bortezomib therapy to intensify endoplasmic reticulum stress-induced cell death.Oncogene. 2018 Nov;37(45):5913-5925. doi: 10.1038/s41388-018-0381-2. Epub 2018 Jul 6. Oncogene. 2018. PMID: 29980790
-
Endoplasmic reticulum stress and cell death in mTORC1-overactive cells is induced by nelfinavir and enhanced by chloroquine.Mol Oncol. 2015 Mar;9(3):675-88. doi: 10.1016/j.molonc.2014.11.005. Epub 2014 Nov 22. Mol Oncol. 2015. PMID: 25498902 Free PMC article.
-
Tuberous sclerosis--A model for tumour growth.Semin Cell Dev Biol. 2016 Apr;52:3-11. doi: 10.1016/j.semcdb.2016.01.025. Epub 2016 Jan 24. Semin Cell Dev Biol. 2016. PMID: 26816112 Review.
-
mTORC1 senses stresses: Coupling stress to proteostasis.Bioessays. 2017 May;39(5):10.1002/bies.201600268. doi: 10.1002/bies.201600268. Epub 2017 Mar 15. Bioessays. 2017. PMID: 28295473 Free PMC article. Review.
Cited by
-
Energy Stress-Mediated Cytotoxicity in Tuberous Sclerosis Complex 2-Deficient Cells with Nelfinavir and Mefloquine Treatment.Cancers (Basel). 2018 Oct 10;10(10):375. doi: 10.3390/cancers10100375. Cancers (Basel). 2018. PMID: 30308940 Free PMC article.
-
Drug Inhibition of Redox Factor-1 Restores Hypoxia-Driven Changes in Tuberous Sclerosis Complex 2 Deficient Cells.Cancers (Basel). 2022 Dec 15;14(24):6195. doi: 10.3390/cancers14246195. Cancers (Basel). 2022. PMID: 36551683 Free PMC article.
-
Oncogenic KRAS creates an aspartate metabolism signature in colorectal cancer cells.FEBS J. 2021 Dec;288(23):6683-6699. doi: 10.1111/febs.16111. Epub 2021 Jul 27. FEBS J. 2021. PMID: 34227245 Free PMC article.
-
Nelfinavir Induces Cytotoxicity towards High-Grade Serous Ovarian Cancer Cells, Involving Induction of the Unfolded Protein Response, Modulation of Protein Synthesis, DNA Damage, Lysosomal Impairment, and Potentiation of Toxicity Caused by Proteasome Inhibition.Cancers (Basel). 2021 Dec 26;14(1):99. doi: 10.3390/cancers14010099. Cancers (Basel). 2021. PMID: 35008264 Free PMC article.
-
The Anti-Cancer Properties of the HIV Protease Inhibitor Nelfinavir.Cancers (Basel). 2020 Nov 19;12(11):3437. doi: 10.3390/cancers12113437. Cancers (Basel). 2020. PMID: 33228205 Free PMC article. Review.
References
-
- Rojo F, Najera L, Lirola J, Jiménez J, Guzmán M, Sabadell MD, Baselga J, Ramon y Cajal S. 4E-binding protein 1, a cell signaling hallmark in breast cancer that correlates with pathologic grade and prognosis. Clin Cancer Res. 2007;13:81–89. - PubMed
-
- Kremer CL, Klein RR, Mendelson J, Browne W, Samadzedeh LK, Vanpatten K, Highstrom L, Pestano GA, Nagle RB. Expression of mTOR signaling pathway markers in prostate cancer progression. Prostate. 2006;66:1203–12. - PubMed
-
- Guo Y, Chekaluk Y, Zhang J, Du J, Gray NS, Wu CL, Kwiatkowski DJ. TSC1 involvement in bladder cancer: diverse effects and therapeutic implications. J Pathol. 2013;230:17–27. - PubMed
MeSH terms
Substances
LinkOut - more resources
Full Text Sources
Other Literature Sources
