

MicroRNAs of the mir-17~92 cluster regulate multiple aspects of pancreatic tumor development and progression
- PMID: 28415794
- PMCID: PMC5482626
- DOI: 10.18632/oncotarget.16277
MicroRNAs of the mir-17~92 cluster regulate multiple aspects of pancreatic tumor development and progression
Abstract
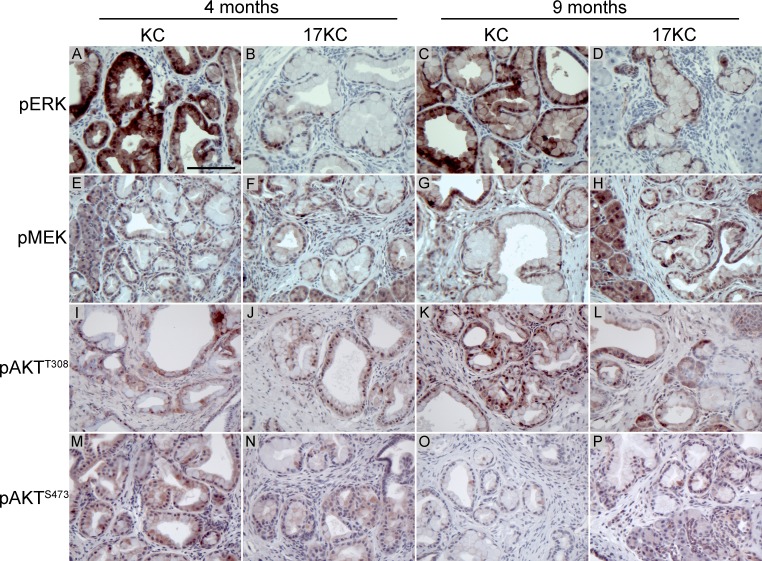
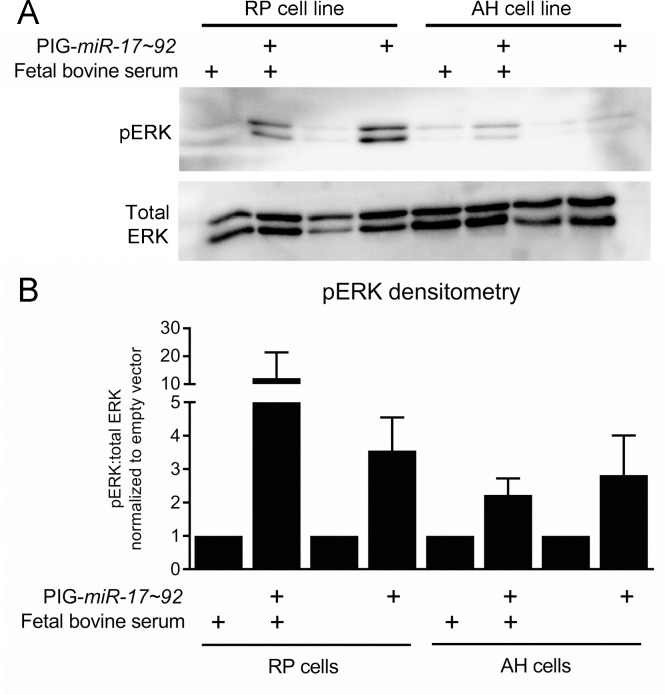
Pancreatic ductal adenocarcinoma (PDAC) is a lethal malignancy characterized by resistance to currently employed chemotherapeutic approaches. Members of the mir-17~92 cluster of microRNAs (miRNAs) are upregulated in PDAC, but the precise roles of these miRNAs in PDAC are unknown. Using genetically engineered mouse models, we show that loss of mir-17~92 reduces ERK pathway activation downstream of mutant KRAS and promotes the regression of KRASG12D-driven precursor pancreatic intraepithelial neoplasias (PanINs) and their replacement by normal exocrine tissue. In a PDAC model driven by concomitant KRASG12D expression and Trp53 heterozygosity, mir-17~92 deficiency extended the survival of mice that lacked distant metastasis. Moreover, mir-17~92-deficient PDAC cell lines display reduced invasion activity in transwell assays, form fewer invadopodia rosettes than mir-17~92-competent cell lines and are less able to degrade extracellular matrix. Specific inhibition of miR-19 family miRNAs with antagomirs recapitulates these phenotypes, suggesting that miR-19 family miRNAs are important mediators of PDAC cell invasion. Together these data demonstrate an oncogenic role for mir-17~92 at multiple stages of pancreatic tumorigenesis and progression; specifically, they link this miRNA cluster to ERK pathway activation and precursor lesion maintenance in vivo and identify a novel role for miR-19 family miRNAs in promoting cancer cell invasion.
Keywords: PanIN; invasion; mir-17~92; pancreatic cancer; regression.
Conflict of interest statement
The authors report no conflicts of interest.
Figures


Similar articles
-
Downregulated miR-98-5p promotes PDAC proliferation and metastasis by reversely regulating MAP4K4.J Exp Clin Cancer Res. 2018 Jul 3;37(1):130. doi: 10.1186/s13046-018-0807-2. J Exp Clin Cancer Res. 2018. PMID: 29970191 Free PMC article.
-
MicroRNA-323-3p inhibits cell invasion and metastasis in pancreatic ductal adenocarcinoma via direct suppression of SMAD2 and SMAD3.Oncotarget. 2016 Mar 22;7(12):14912-24. doi: 10.18632/oncotarget.7482. Oncotarget. 2016. PMID: 26908446 Free PMC article.
-
Macrophage-derived exosomal microRNA-501-3p promotes progression of pancreatic ductal adenocarcinoma through the TGFBR3-mediated TGF-β signaling pathway.J Exp Clin Cancer Res. 2019 Jul 15;38(1):310. doi: 10.1186/s13046-019-1313-x. J Exp Clin Cancer Res. 2019. PMID: 31307515 Free PMC article.
-
MicroRNA in pancreatic cancer.J Hum Genet. 2017 Jan;62(1):33-40. doi: 10.1038/jhg.2016.59. Epub 2016 Jun 2. J Hum Genet. 2017. PMID: 27251005 Review.
-
Pancreatic Ductal Adenocarcinoma: MicroRNAs Affecting Tumor Growth and Metastasis in Preclinical In Vivo Models.Cancer Genomics Proteomics. 2019 Nov-Dec;16(6):451-464. doi: 10.21873/cgp.20149. Cancer Genomics Proteomics. 2019. PMID: 31659100 Free PMC article. Review.
Cited by
-
A Comprehensive Molecular Characterization of the Pancreatic Neuroendocrine Tumor Cell Lines BON-1 and QGP-1.Cancers (Basel). 2020 Mar 14;12(3):691. doi: 10.3390/cancers12030691. Cancers (Basel). 2020. PMID: 32183367 Free PMC article.
-
A two-microRNA signature as a diagnostic and prognostic marker of pancreatic adenocarcinoma.Cancer Manag Res. 2018 Jun 13;10:1507-1515. doi: 10.2147/CMAR.S158712. eCollection 2018. Cancer Manag Res. 2018. PMID: 29942152 Free PMC article.
-
MiR-106a-5p inhibits the cell migration and invasion of renal cell carcinoma through targeting PAK5.Cell Death Dis. 2017 Oct 26;8(10):e3155. doi: 10.1038/cddis.2017.561. Cell Death Dis. 2017. PMID: 29072688 Free PMC article.
-
The Emerging Role of miRNAs for the Radiation Treatment of Pancreatic Cancer.Cancers (Basel). 2020 Dec 9;12(12):3703. doi: 10.3390/cancers12123703. Cancers (Basel). 2020. PMID: 33317198 Free PMC article.
-
MIR17HG-miR-18a/19a axis, regulated by interferon regulatory factor-1, promotes gastric cancer metastasis via Wnt/β-catenin signalling.Cell Death Dis. 2019 Jun 11;10(6):454. doi: 10.1038/s41419-019-1685-z. Cell Death Dis. 2019. PMID: 31186404 Free PMC article.
References
-
- Alexakis N, Halloran C, Raraty M, Ghaneh P, Sutton R, Neoptolemos JP. Current standards of surgery for pancreatic cancer. Br J Surg. 2004;91:1410–1427. - PubMed
-
- Howlader N, Noone A, Krapcho M, Garshell J, Miller D, Altekruse S, Kosary C, Yu M, Ruhl J, Tatalovich Z, Mariotto A, Lewis D, Chen H, et al. SEER Cancer Statistics Review, 1975–2011. National Cancer Institute; Bethesda, MD: http://seer.cancer.gov/csr/1975_2011/, based on November 2013 SEER data submission, posted to the SEER web site, April 2014.
MeSH terms
Substances
Grants and funding
LinkOut - more resources
Full Text Sources
Other Literature Sources
Medical
Research Materials
Miscellaneous
