

Impact of the MDM2 splice-variants MDM2-A, MDM2-B and MDM2-C on cytotoxic stress response in breast cancer cells
- PMID: 28415963
- PMCID: PMC5393014
- DOI: 10.1186/s12860-017-0134-z
Impact of the MDM2 splice-variants MDM2-A, MDM2-B and MDM2-C on cytotoxic stress response in breast cancer cells
Abstract
Background: The murine double minute 2 (MDM2) is an oncogene and a negative regulator of the tumor suppressor protein p53. MDM2 is known to be amplified in numerous human cancers, and upregulation of MDM2 is considered to be an alternative mechanism of p53 inactivation. The presence of many splice variants of MDM2 has been observed in both normal tissues and malignant cells; however their impact and functional properties in response to chemotherapy treatment are not fully understood. Here, we investigate the biological effects of three widely expressed alternatively spliced variants of MDM2; MDM2-A, MDM2-B and MDM2-C, both in unstressed MCF-7 breast cancer cells and in cells subjected to chemotherapy. We assessed protein stability, subcellular localization and induction of downstream genes known to be regulated by the MDM2-network, as well as impact on cellular endpoints, such as apoptosis, cell cycle arrest and senescence.
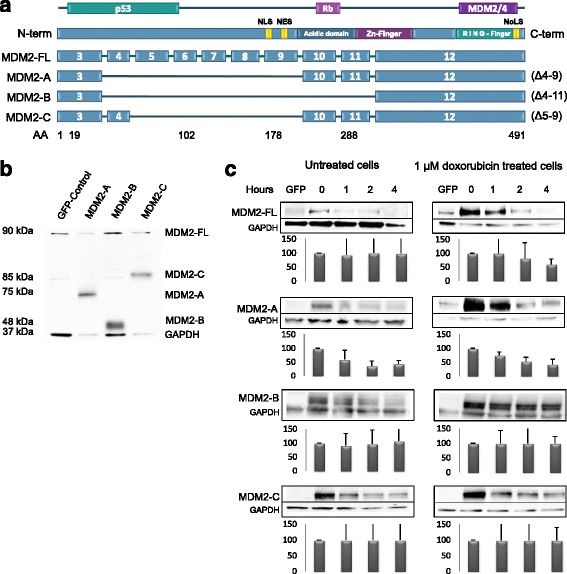
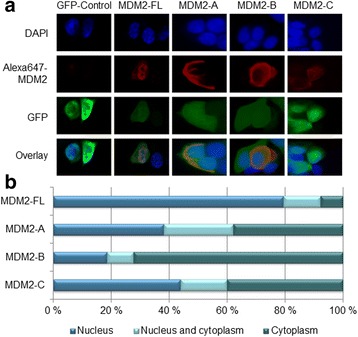
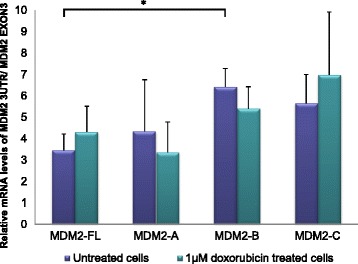
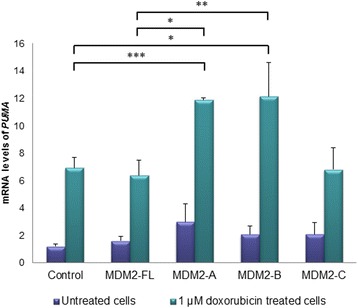
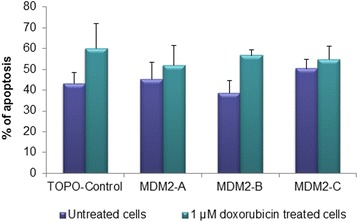
Results: We found both the splice variants MDM2-B and -C, to have a much longer half-life than MDM2 full-length (FL) protein after chemotherapy treatment indicating that, under stressed conditions, the regulation of degradation of these two variants differs from that of MDM2-FL. Interestingly, we observed all three splice variants to deviate from MDM2-FL protein with respect to subcellular distribution. Furthermore, while MDM2-A and -B induced the expression of the pro-apoptotic gene PUMA, this effect did not manifest in an increased level of apoptosis.
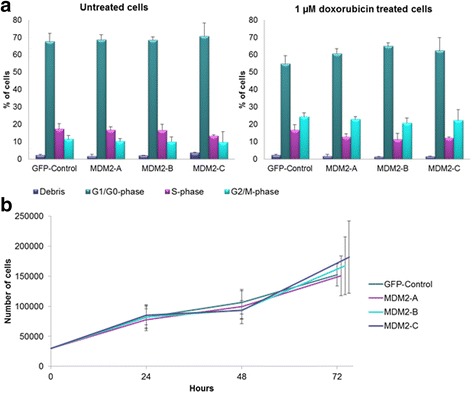
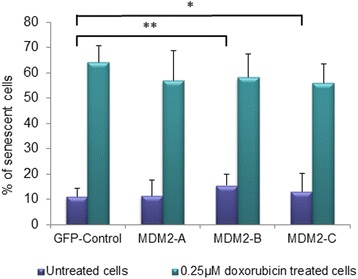
Conclusion: Although MDM2-B induced slight changes in the cell cycle profile, overall, we found the impact of the three MDM2 splice variants on potential cellular endpoints upon doxorubicin treatment to be limited.
Keywords: Breast cancer; Doxorubicin; MDM2; MDM2 splice variants; MDM2-A; MDM2-B; MDM2-C.
Figures
Similar articles
-
Induction of p53 expression and apoptosis by a recombinant dual-target MDM2/MDMX inhibitory protein in wild-type p53 breast cancer cells.Int J Oncol. 2013 Dec;43(6):1935-42. doi: 10.3892/ijo.2013.2138. Epub 2013 Oct 14. Int J Oncol. 2013. PMID: 24126697
-
A tryptophanol-derived oxazolopiperidone lactam is cytotoxic against tumors via inhibition of p53 interaction with murine double minute proteins.Pharmacol Res. 2015 May-Jun;95-96:42-52. doi: 10.1016/j.phrs.2015.03.006. Epub 2015 Mar 23. Pharmacol Res. 2015. PMID: 25814188
-
Spiro-oxindole derivative 5-chloro-4',5'-diphenyl-3'-(4-(2-(piperidin-1-yl) ethoxy) benzoyl) spiro[indoline-3,2'-pyrrolidin]-2-one triggers apoptosis in breast cancer cells via restoration of p53 function.Int J Biochem Cell Biol. 2016 Jan;70:105-17. doi: 10.1016/j.biocel.2015.11.003. Epub 2015 Nov 7. Int J Biochem Cell Biol. 2016. PMID: 26556313
-
[Any way you splice it: Mdm2 at the crossroads of tumor surveillance].Ai Zheng. 2008 Sep;27(9):993-7. Ai Zheng. 2008. PMID: 18799043 Review. Chinese.
-
MDM2 splice variants and their therapeutic implications.Curr Cancer Drug Targets. 2005 Feb;5(1):21-6. doi: 10.2174/1568009053332654. Curr Cancer Drug Targets. 2005. PMID: 15720186 Review.
Cited by
-
The Role of MDM2 in Promoting Genome Stability versus Instability.Int J Mol Sci. 2017 Oct 23;18(10):2216. doi: 10.3390/ijms18102216. Int J Mol Sci. 2017. PMID: 29065514 Free PMC article. Review.
-
Advancements in MDM2 inhibition: Clinical and pre-clinical investigations of combination therapeutic regimens.Saudi Pharm J. 2023 Oct;31(10):101790. doi: 10.1016/j.jsps.2023.101790. Epub 2023 Sep 16. Saudi Pharm J. 2023. PMID: 37818252 Free PMC article. Review.
-
HER2 Antibody-Drug Conjugates Are Active against Desmoplastic Small Round Cell Tumor.Clin Cancer Res. 2024 Oct 15;30(20):4701-4713. doi: 10.1158/1078-0432.CCR-24-1835. Clin Cancer Res. 2024. PMID: 39120576 Free PMC article.
-
Oncogenic Functions of Alternatively Spliced MDM2-ALT2 Isoform in Retroperitoneal Liposarcoma.Int J Mol Sci. 2024 Dec 17;25(24):13516. doi: 10.3390/ijms252413516. Int J Mol Sci. 2024. PMID: 39769278 Free PMC article.
-
Genotoxic stress causes the accumulation of DNA-dependent protein kinase catalytic subunit phosphorylated at serine 2056 at nuclear speckles and alters pre-mRNA alternative splicing.FEBS Open Bio. 2018 Dec 28;9(2):304-314. doi: 10.1002/2211-5463.12569. eCollection 2019 Feb. FEBS Open Bio. 2018. PMID: 30761255 Free PMC article.
References
Publication types
MeSH terms
Substances
LinkOut - more resources
Full Text Sources
Other Literature Sources
Research Materials
Miscellaneous
