Birth by caesarean section and school performance in Swedish adolescents- a population-based study
- PMID: 28415966
- PMCID: PMC5392943
- DOI: 10.1186/s12884-017-1304-x
Birth by caesarean section and school performance in Swedish adolescents- a population-based study
Abstract
Background: Our objective was to assess the impact of obstetric mode of delivery, and in particular birth by Caesarean section (CS), on school performance in adolescents using a large, population-based cohort.
Methods: We extracted data from the Swedish Medical Birth Register and National School Register. We included all live singleton births in Sweden from 1982-1995 (n = 1,489,925). School grades were reported on a scale from 0 to 320, scores less than 160 (i.e. "pass") were considered to be "poor school performance." Mode of delivery was categorised as: unassisted vaginal delivery (VD), assisted VD, elective CS and emergency CS. We measured the association between mode of delivery and "poor school performance" using logistic regression. We then used quantile regression to assess the association between mode of delivery and school performance across the distribution of scores. We adjusted for maternal age, parity, small and large for gestational age, gestational age, maternal country of birth, maternal depression, non-affective disorder or bipolar disorder, parental income at time of birth, and parental social welfare at time of birth. We also conducted sensitivity analyses to investigate the association further.
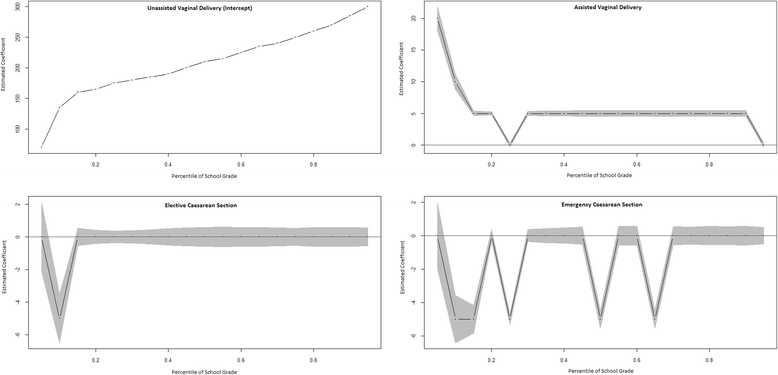
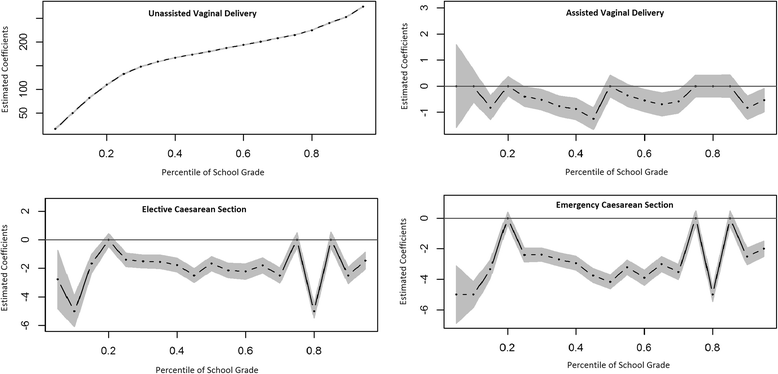
Results: With logistic regression analysis, the adjusted odds ratio (aOR) of assisted VD and poor school performance, compared to unassisted VD, was 1.06 (95% CI: 1.03-1.08). For elective CS it was 1.06 (95% CI:1.03-1.09) and for emergency CS it was 1.12 (95% CI: 1.09-1.15). With quantile regression, assisted VD showed little difference in scores, when compared to unassisted VD, at any point across the distribution. Elective CS was associated with a 1-3 point decrease in scores, and emergency CS was associated with a 2-5 point decrease in scores.
Conclusion: A slight association was found between birth by CS and school performance. However, the effect was quite small and given the complex nature of the relationship, should be interpreted with caution.
Keywords: Caesarean section: School performance; Cohort study; Quantile regression.
Figures


Similar articles
-
Association Between Obstetric Mode of Delivery and Autism Spectrum Disorder: A Population-Based Sibling Design Study.JAMA Psychiatry. 2015 Sep;72(9):935-42. doi: 10.1001/jamapsychiatry.2015.0846. JAMA Psychiatry. 2015. PMID: 26107922
-
Obstetric mode of delivery and attention-deficit/hyperactivity disorder: a sibling-matched study.Int J Epidemiol. 2016 Apr;45(2):532-42. doi: 10.1093/ije/dyw001. Epub 2016 Apr 10. Int J Epidemiol. 2016. PMID: 27063604
-
Birth by Caesarean Section and the Risk of Adult Psychosis: A Population-Based Cohort Study.Schizophr Bull. 2016 May;42(3):633-41. doi: 10.1093/schbul/sbv152. Epub 2015 Nov 27. Schizophr Bull. 2016. PMID: 26615187 Free PMC article.
-
Reported outcomes for planned caesarean section versus planned vaginal delivery: A systematic review.Eur J Obstet Gynecol Reprod Biol. 2021 Jan;256:101-108. doi: 10.1016/j.ejogrb.2020.10.057. Epub 2020 Nov 4. Eur J Obstet Gynecol Reprod Biol. 2021. PMID: 33197678
-
Association of cesarean section with asthma in children/adolescents: a systematic review and meta-analysis based on cohort studies.BMC Pediatr. 2023 Nov 16;23(1):571. doi: 10.1186/s12887-023-04396-1. BMC Pediatr. 2023. PMID: 37974127 Free PMC article.
Cited by
-
The association of cesarean section with overweight and neurodevelopment of Chinese children aged 1-5 months.Front Pediatr. 2022 Aug 23;10:940422. doi: 10.3389/fped.2022.940422. eCollection 2022. Front Pediatr. 2022. PMID: 36081630 Free PMC article.
-
The association of birth by caesarean section and cognitive outcomes in offspring: a systematic review.Soc Psychiatry Psychiatr Epidemiol. 2021 Apr;56(4):533-545. doi: 10.1007/s00127-020-02008-2. Epub 2021 Jan 3. Soc Psychiatry Psychiatr Epidemiol. 2021. PMID: 33388795
-
Association of birth by cesarean section with academic performance and intelligence in youth: A cohort study.Acta Obstet Gynecol Scand. 2023 May;102(5):532-540. doi: 10.1111/aogs.14535. Epub 2023 Mar 22. Acta Obstet Gynecol Scand. 2023. PMID: 36946073 Free PMC article.
-
Are there adverse outcomes for child health and development following caesarean section delivery? Can we justify using elective caesarean section to prevent obstetric pelvic floor damage?Int Urogynecol J. 2021 Jul;32(7):1963-1969. doi: 10.1007/s00192-021-04781-3. Epub 2021 Apr 20. Int Urogynecol J. 2021. PMID: 33877375 Review.
-
Early-life oxytocin attenuates the social deficits induced by caesarean-section delivery in the mouse.Neuropsychopharmacology. 2021 Oct;46(11):1958-1968. doi: 10.1038/s41386-021-01040-3. Epub 2021 May 26. Neuropsychopharmacology. 2021. PMID: 34040156 Free PMC article.
References
-
- Vogel JP, Betrán AP, Vindevoghel N, Souza JP, Torloni MR, Zhang J, et al. Use of the Robson classification to assess caesarean section trends in 21 countries: a secondary analysis of two WHO multicountry surveys. Lancet Glob Health. 2015;3(5):e260–e70. doi: 10.1016/S2214-109X(15)70094-X. - DOI - PubMed
Publication types
MeSH terms
LinkOut - more resources
Full Text Sources
Other Literature Sources
Medical

