. 2017 May 3;94(3):581-594.e5.
doi: 10.1016/j.neuron.2017.03.043. Epub 2017 Apr 13.

Blood-Brain Barrier Permeability Is Regulated by Lipid Transport-Dependent Suppression of Caveolae-Mediated Transcytosis

Affiliations

Blood-Brain Barrier Permeability Is Regulated by Lipid Transport-Dependent Suppression of Caveolae-Mediated Transcytosis

Benjamin J Andreone et al. Neuron. .

Abstract

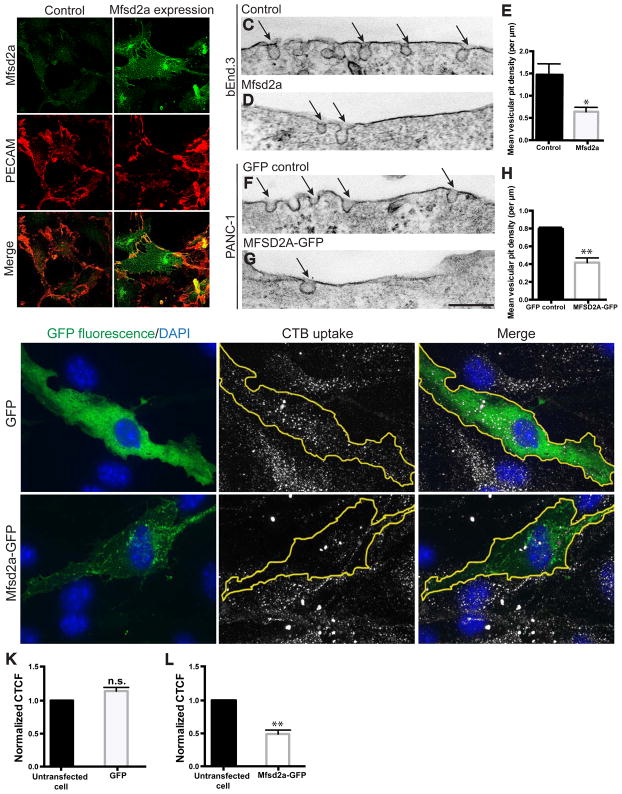
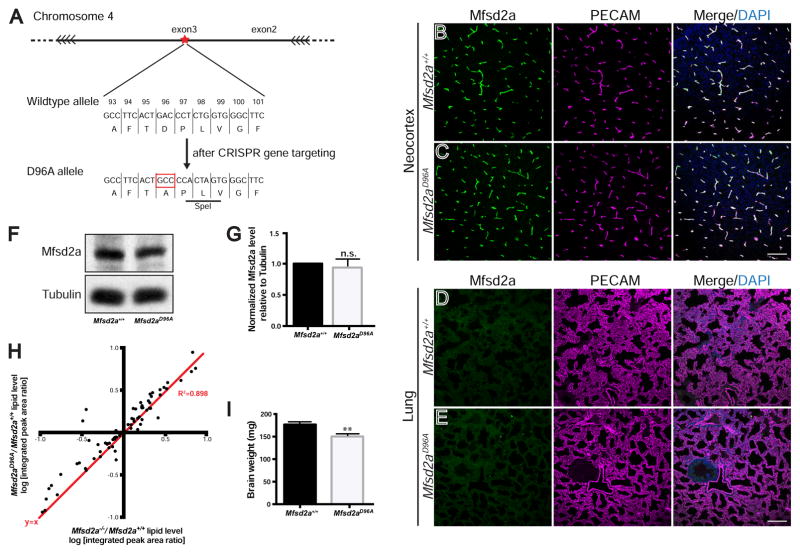
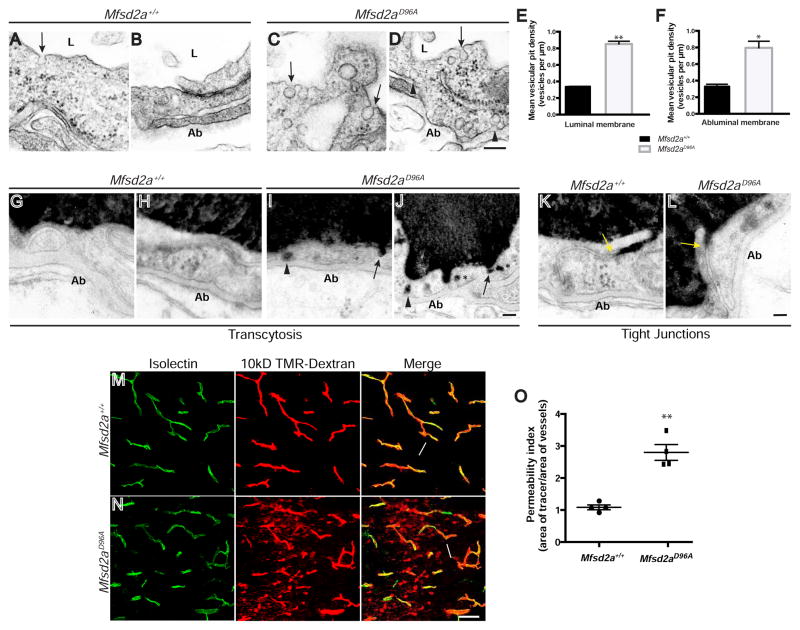
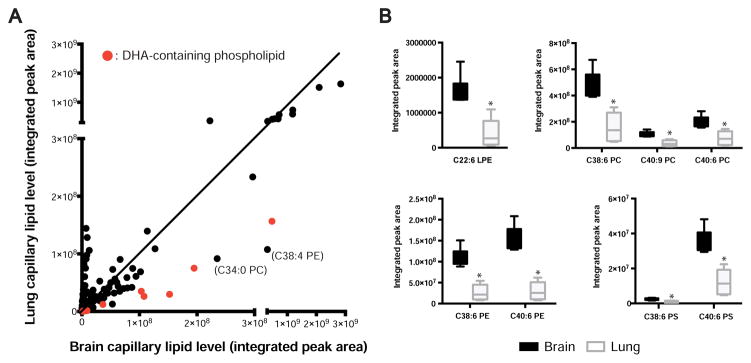
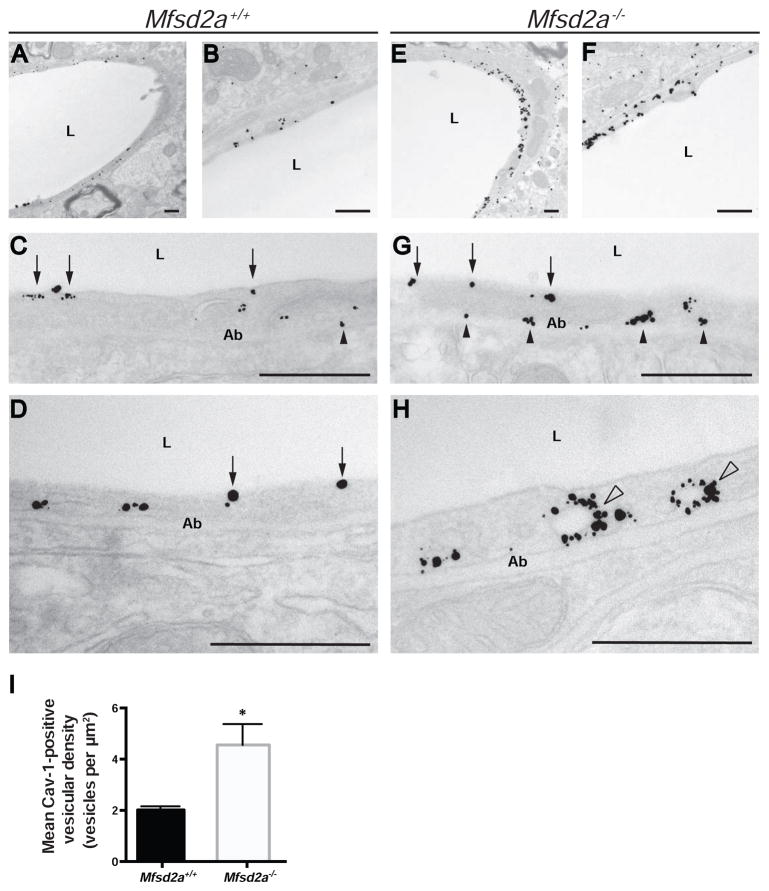
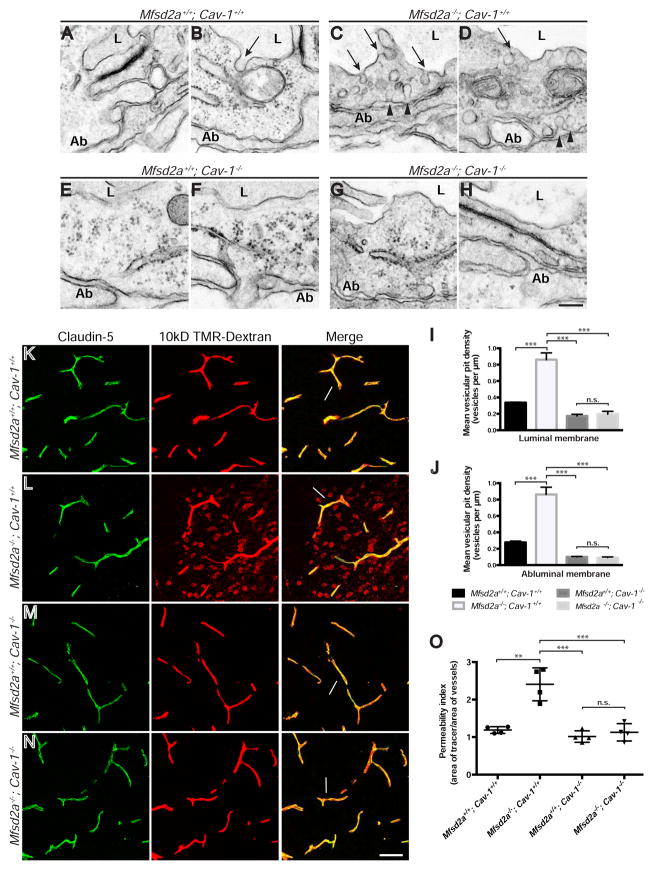
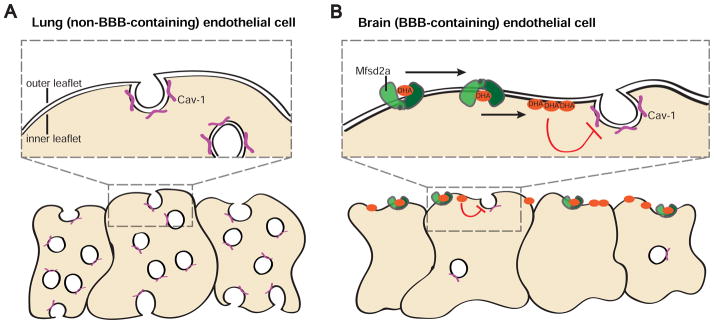
The blood-brain barrier (BBB) provides a constant homeostatic brain environment that is essential for proper neural function. An unusually low rate of vesicular transport (transcytosis) has been identified as one of the two unique properties of CNS endothelial cells, relative to peripheral endothelial cells, that maintain the restrictive quality of the BBB. However, it is not known how this low rate of transcytosis is achieved. Here we provide a mechanism whereby the regulation of CNS endothelial cell lipid composition specifically inhibits the caveolae-mediated transcytotic route readily used in the periphery. An unbiased lipidomic analysis reveals significant differences in endothelial cell lipid signatures from the CNS and periphery, which underlie a suppression of caveolae vesicle formation and trafficking in brain endothelial cells. Furthermore, lipids transported by Mfsd2a establish a unique lipid environment that inhibits caveolae vesicle formation in CNS endothelial cells to suppress transcytosis and ensure BBB integrity.

Keywords: CNS endothelial cells; Cav-1; DHA; Mfsd2a; blood vessels; blood-brain barrier; caveolae; lipid transport; lipidomic mass spectrometry; transcytosis.


Figures

Figure 1
Figure 1. Mfsd2a expression suppresses plasma membrane vesicular pit formation and cargo uptake in multiple cell types. See also Table S4
(A–B) Expression of Mfsd2a via lentivirus infection in bEnd.3 cells, in which endogenous Mfsd2a expression was not detectable. Mfsd2a (green) in bEnd.3 cells displays cell surface localization and co-localization with PECAM (red), a cell surface marker (arrows). Scale bar, 50 μm. (C–H) Electron microscopy images showing the apical plasma membrane of bEnd.3 cells expressing mouse Mfsd2a (D) or PANC-1 cells expressing human MFSD2A-GFP (G). Mfsd2a-expressing cells show reduced vesicular pit density (arrows) in both cell types, compared to mock infected control bEnd.3 cells (C) or PANC-1 cells expressing GFP alone (F). n = 3, 25 image profiles from at least 15 cells per experiment. Scale bar, 150 nm. (I–J) Mfsd2a-expressing cells exhibit reduced cholera toxin subunit-B (CTB) uptake. Uptake of CTB (gray; middle panels) in bEnd.3 cells expressing either soluble GFP (I) or Mfsd2a-GFP (J) (green, GFP fluorescence; blue, DAPI; lefts panels.). Scale bar, 20 μm. (K–L) CTB uptake quantified as corrected total cell fluorescence (CTCF) per transfected cell compared to CTCF of at least 2 untransfected cells per image. n = 4, at least 15 transfected cells per experiment. All data are mean ± s.e.m.; n.s., not significant, * P < 0.05, ** P < 0.01 (Student’s t-test).
Figure 2
Figure 2. A novel Mfsd2aD96A mouse abolishes the lipid transport function of Mfsd2a and displays microcephaly. See also Figures S1 and S2; Tables S1 and S2
(A) Gene targeting strategy for the generation of Mfsd2aD96A mice. Magnified view of the genomic region that contains residue D96 in exon 3 of Mfsd2a. CRISPR/cas9 genome editing introduces the D96A point mutation (red box), as well as two additional silent mutations in codons 97/98 that generate a SpeI restriction site (black underline) for screening purposes. For additional details, see STAR methods. (B–C) Immunostaining at P4 of Mfsd2a protein (green) reveals vascular expression (purple, PECAM) in the neocortex of both Mfsd2a+/+ control (B) and Mfsd2aD96A mutants (C). n = 3 animals per genotype. Scale bar, 100 μm. (D–E) Immunostaining at P4 reveals absence of Mfsd2a protein expression in non-BBB-containing lung vasculature (purple, PECAM) of both Mfsd2a+/+ control (D) and Mfsd2aD96A mutants (E). n = 3 animals per genotype. Scale bar, 100 μm. (F) Western blot from P4 brain lysate of Mfsd2aD96A mutants and littermate Mfsd2a+/+ controls. (G) Quantification shows equal Mfsd2a protein levels between Mfsd2aD96A mutants and littermate Mfsd2a+/+ controls. Tubulin (loading control). n = 3 littermate pairs per genotype. Data are mean ± s.e.m.; n.s., not significant (Student’s t-test). (H) The lipid profile of Mfsd2aD96A mutant brains closely mimics that of Mfsd2a−/− mutant brains at P4. Dot plot representation of Mfsd2a−/−/Mfsd2a+/+ log-ratio (x-axis), compared to Mfsd2aD96A/Mfsd2a+/+ log-ratio (y-axis) of phospholipid levels measured by mass spectrometry. Each dot represents a single lipids species; red line: y=x; R2 = 0.898. Mfsd2aD96A experiment: n = 6 animals per genotype; Mfsd2a−/− experiment: n = 4 animals per genotype. (I) Mfsd2aD96A mutants exhibit microcephaly. Quantification of brain weight at P4. n = 5 animals per genotype. Data are mean ± s.e.m.; ** P < 0.01 (Student’s t-test).
Figure 3
Figure 3. The lipid transport function of Mfsd2a is required for the suppression of transcytosis and maintenance of BBB integrity in vivo. See also Figures S3 and S6; Table S4
(A–D) Increased vesicular density in CNS endothelial cells of Mfsd2aD96A mutants (C–D) compared to their littermate controls (A–B). Electron microscopy analysis at P4 reveals increased number of vesicles in Mfsd2aD96A mutants along the luminal (arrows) and abluminal (Ab; black arrowheads) plasma membranes. Scale bar, 150 nm. (E–F) Quantification of vesicular density along the luminal (E) and abluminal (F) plasma membranes. n = 3 animals per condition, 20 capillary cross-sections per animal. (G–J) Increased transcytosis is evident in CNS endothelial cells of HRP-injected Mfsd2aD96A mutants at P90. HRP tracer (black) is confined with the vessel lumen (L) of littermate control animals (G–H). Tracer-filled vesicles are observed invaginating from the luminal plasma membrane (arrows), within the cytoplasm (asterisks), and along to abluminal plasma membrane (arrowheads) in Mfsd2aD96A mutants (I–J). n = 3 animals per condition. Scale bar, 100 nm. (K–L) Tight junctions are functional in CNS endothelial cells of HRP-injected Mfsd2aD96A mutants. HRP tracer fills the vessel lumen (L) and enters intercellular clefts but is sharply halted at tight junction “kissing points” (yellow arrows) in both Mfsd2aD96A mutants (L) and Mfsd2a+/+ littermate control animals (K) at P90. n = 3 animals per condition. Scale bar, 100 nm. (M–N) Mfsd2aD96A mutants display BBB leakage. 10kD TMR-dextran tracer (red) is completely confined within vessels (green, Isolectin B4 (IB4)) (arrows) in Mfsd2a+/+ littermate control animals (M) at P4. Tracer-filled parenchyma cells (arrowheads) surround vessels in the brain of Mfsd2aD96A mutants (N). Scale bar, 50 μm. (O) Permeability index of tracer leakage in brain, as quantified by area of tracer divided by area of vessels per image (value = 1 signifying no leakage). n = 4 animals per genotype. All data are mean ± s.e.m.; * P < 0.05, ** P < 0.01 (Student’s t-test).
Figure 4
Figure 4. Lipidomic profiling of brain versus lung capillaries reveals different lipid signatures, including changes in DHA-containing phospholipid species. See also Figures S4 and S5; Table S3
(A) Dot plot representation of lipidomic profiling of brain versus lung capillaries from P4 wild-type mice. Dots represent average lipid level in the brain (x-axis) and lung (y-axis) for each metabolite tested, expressed as mass spectrometry integrated peak area. Red dots indicate DHA-containing phospholipid species. (B) DHA-containing phospholipid levels are increased in brain capillaries. Lipidomic analysis of DHA-containing phospholipid species from brain and lung capillaries of P4 wild-type mice. Value for each species is normalized to internal standard and expressed as integrated mass spectrometry peak area. (LPE, lyso-phosphatidylethanolamine; PC, phosphatidylcholine; PE, phosphatidylethanolamine; PS, phosphatidylserine). * P < 0.004 (Student’s t-test, with Bonferroni correction for multiple comparisons). For all data, n = 6 groups per organ, 8 animals pooled per group.
Figure 5
Figure 5. Mfsd2a−/− mice display an increased number of Cav-1-positive vesicles in CNS endothelial cells. See also Table S4
(A–H) Cav-1 immunoreactivity in CNS endothelial cells of Mfsd2a+/+ and Mfsd2a−/− mice under electron microscopy. Electron microscopy analysis with immuno-gold labeling of Cav-1 protein in CNS endothelial cells of Mfsd2a+/+ (A–D) and Mfsd2a−/− mice (E–H) at P90. Gold particles (black puncta) are visualized along the luminal (arrows) and abluminal (Ab; black arrowheads) plasma membranes, as well as within the cytoplasm. Cytoplasmic particles are seen associated with vesicular structures (white arrowheads). All scale bars, 500 nm. (I) Quantification of Cav-1-positive vesicles in Mfsd2a+/+ and Mfsd2a−/− mice. n = 3 animals per genotype, 10 capillary cross-sections per animal. Data are mean ± s.e.m.; * P < 0.05 (Student’s t-test).
Figure 6
Figure 6. Genetic inhibition of the caveolae pathway rescues both the increased vesicular density and BBB leakage phenotypes of Mfsd2a−/− mice. See also Figures S3, S6, and S7; Table S4
(A–H) Genetic inhibition of the caveolae pathway rescues increased vesicular density in Mfsd2a−/− animals. Electron microscopy examination of BBB integrity in Mfsd2a+/+; Cav-1+/+ (A–B), Mfsd2a−/−; Cav-1+/+ (C–D), Mfsd2a+/+; Cav-1−/− (E–F), and Mfsd2a−/−; Cav-1−/− (G–H) mice at P5. Increased vesicular pit density in Mfsd2a−/−; Cav-1+/+ single mutant CNS endothelial cells is observed along the luminal (arrows) and abluminal (Ab; arrowheads) plasma membranes. Mfsd2a+/+; Cav-1+/+ wild-type, Mfsd2a+/+; Cav-1−/− single mutant and Mfsd2a−/−; Cav-1−/− double mutant cells exhibited very few vesicles. Scale bar, 150 nm. (I–J) Quantification of vesicular pit density at the luminal (I) and abluminal (J) plasma membranes. n = 4 animals per genotype, 20 capillary cross-sections per animal. (K–N) Genetic inhibition of the caveolae pathway rescues BBB leakage defects in Mfsd2a−/− animals. 10kD-dextran tracer (red) was injected into the circulation of Mfsd2a+/+; Cav-1+/+ (K), Mfsd2a−/−; Cav-1+/+ (L), Mfsd2a+/+; Cav-1−/− (M), and Mfsd2a−/−; Cav-1−/− (N) mice at P5. Tracer diffuses into the brain parenchyma in Mfsd2a−/−; Cav-1+/+ single mutants (L), with tracer-filled parenchyma cells (arrowheads) surrounding vessels (green, Claudin-5). Tracer is confined to the vasculature (arrows) in all other tested genotypes. Scale bar, 50 μm. (O) Permeability index of tracer leakage in brain, as quantified by area of tracer divided by area of vessels per image (value = 1 signifying no leakage). n = 4 animals per genotype. All data are mean ± s.e.m.; n.s., not significant, ** P < 0.01, *** P < 0.001 (one-way ANOVA, post-hoc Tukey test).
Figure 7
Figure 7. Genetic inhibition of the caveolae pathway fails to rescue the microcephaly defect seen in Mfsd2a−/− mice
Quantification of brain weight at P90. n = 5 animals per genotype. Data are mean ± s.e.m.; n.s., not significant, *** P < 0.001 (one-way ANOVA, post-hoc Tukey test).
Figure 8
Figure 8. Model for the suppression of caveolae-mediated transcytosis via regulated membrane lipid composition at the BBB
(A) Non-BBB containing lung endothelial cells do not express Mfsd2a, display low levels of DHA, and display high levels of transcytotic caveolae vesicles, characterized by the presence of Cav-1 coat protein (purple). (B) BBB-containing brain endothelial cells express Mfsd2a (green). Mfsd2a acts as a lipid flippase, transporting phospholipids, including DHA-containing species (orange), from the outer to inner plasma membrane leaflet. The increased levels of DHA, and presumably other lipid changes, alter the plasma membrane composition such that caveolae vesicles are unable to form and act as transcytotic carriers. Thus, brain endothelial cells display low levels of caveolae vesicles. This suppression of caveolae formation and trafficking subsequently ensures BBB integrity under normal conditions.

Similar articles

Cited by

References

    1. Aird WC. Phenotypic heterogeneity of the endothelium: I. Structure, function, and mechanisms. Circulation research. 2007;100:158–173. - PubMed
    1. Alakbarzade V, Hameed A, Quek DQ, Chioza BA, Baple EL, Cazenave-Gassiot A, Nguyen LN, Wenk MR, Ahmad AQ, Sreekantan-Nair A, et al. A partially inactivating mutation in the sodium-dependent lysophosphatidylcholine transporter MFSD2A causes a non-lethal microcephaly syndrome. Nat Genet. 2015;47:814–817. - PubMed
    1. Andreone BJ, Lacoste B, Gu C. Neuronal and vascular interactions. Annu Rev Neurosci. 2015;38:25–46. - PMC - PubMed
    1. Armulik A, Genove G, Mae M, Nisancioglu MH, Wallgard E, Niaudet C, He L, Norlin J, Lindblom P, Strittmatter K, et al. Pericytes regulate the blood-brain barrier. Nature. 2010;468:557–561. - PubMed
    1. Bastiani M, Parton RG. Caveolae at a glance. Journal of cell science. 2010;123:3831–3836. - PubMed

MeSH terms