. 2017 May 8;27(9):1278-1287.
doi: 10.1016/j.cub.2017.03.022. Epub 2017 Apr 13.

Invariance of Initiation Mass and Predictability of Cell Size in Escherichia coli

Affiliations

Invariance of Initiation Mass and Predictability of Cell Size in Escherichia coli

Fangwei Si et al. Curr Biol. .

Abstract

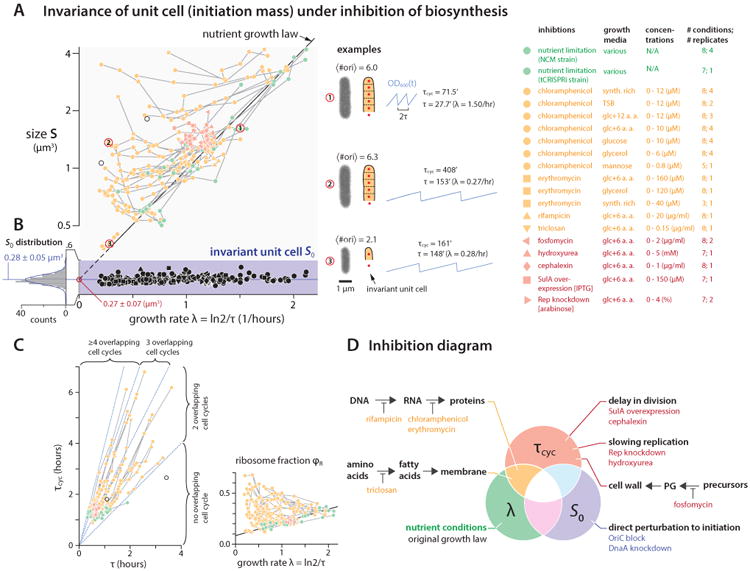
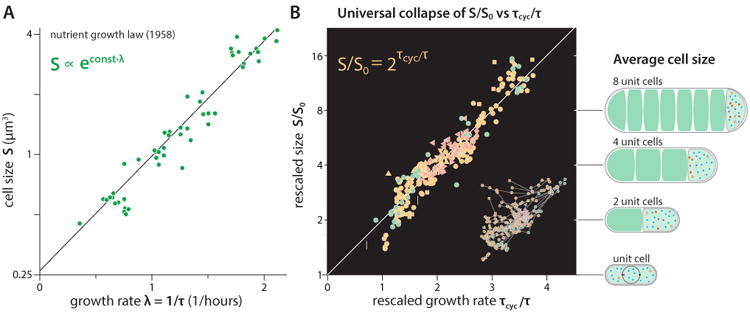
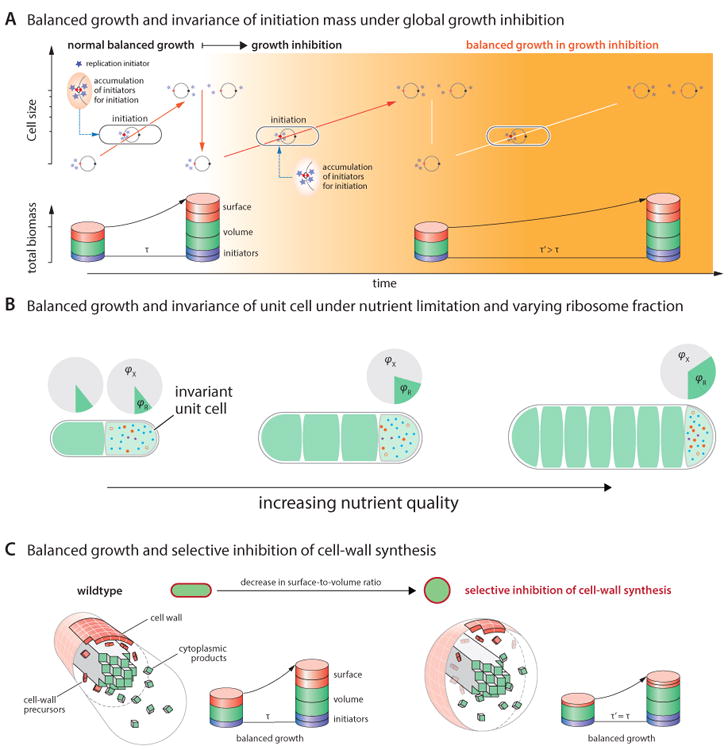
It is generally assumed that the allocation and synthesis of total cellular resources in microorganisms are uniquely determined by the growth conditions. Adaptation to a new physiological state leads to a change in cell size via reallocation of cellular resources. However, it has not been understood how cell size is coordinated with biosynthesis and robustly adapts to physiological states. We show that cell size in Escherichia coli can be predicted for any steady-state condition by projecting all biosynthesis into three measurable variables representing replication initiation, replication-division cycle, and the global biosynthesis rate. These variables can be decoupled by selectively controlling their respective core biosynthesis using CRISPR interference and antibiotics, verifying our predictions that different physiological states can result in the same cell size. We performed extensive growth inhibition experiments, and we discovered that cell size at replication initiation per origin, namely the initiation mass or unit cell, is remarkably invariant under perturbations targeting transcription, translation, ribosome content, replication kinetics, fatty acid and cell wall synthesis, cell division, and cell shape. Based on this invariance and balanced resource allocation, we explain why the total cell size is the sum of all unit cells. These results provide an overarching framework with quantitative predictive power over cell size in bacteria.

Keywords: CRISPR interference; bacterial physiology; cell cycle; cell size control; growth law; initiation mass.


Figures

Figure 1
Figure 1. Cell cycle model and the general growth law
(A) Top: Replication of a circular chromosome from a single replication origin: non-overlapping vs. overlapping cell cycles. Bottom: Schematics to define τcyc and τ with overlapping cell cycles. (B) Left: The general growth law states that cell size is the sum of all unit cells, each unit cell containing the minimal resource for self-replication from a single replication origin. Right: If S0, τcyc, and τ can vary freely and independently, there would exist an infinite number of different physiological states for the same cell size. (C) Left: Multiplex turbidostat ensures steady-state growth with automatic dilution at a pre-defined value of OD600, from which doubling time is calculated. Samples taken from each growth condition are used for imaging and cell size measurement (number of imaged cells is on the order of 104; see detailed sample size in Supplemental Information). Right: Under nutrient limitation, τcyc, τC and S0 remain constant. The ribosome fraction φR is measured from the same sample and shows linear increase. Symbol shapes reflect biological replicates and the colors represent different nutrient conditions. Please also see Figures S1, S6 and S7.
Figure 2
Figure 2. Thymine limitation alters cell cycle duration and cell size without changing the initiation mass
(A) Left: Thymine limitation reduces the nucleotide pool and replication slows consequently. Middle: τcyc increases in thymine limitation while τ remains unchanged, increasing the number of overlapping cell cycles. Chromosome schematics and cell images with foci qualitatively show increasing number of ori's as a result of multifork replication. Odd number of foci in some cell images are possibly due to cohesion and/or stochasticity in replication initiation [26]. Right: Cell size increases exponentially with τcyc in thymine limitation, as predicted by Eq. 1 (solid line, no free parameters). The empty symbols are the cell size per ori (S0), and the thickness of the grey band denotes ±SD. Symbol shapes reflect biological replicates and the symbol colors indicate the level of thymine limitation. (B) Explanation of increasing cell size in thymine limitation. Thymine limitation is applied at the beginning of the second generation, and replication slows. Initiation-competent initiators accumulate at the same rate as the growth rate λ and trigger initiation at a critical number per ori (four in this illustration). An extra round of replication is initiated during transition as cell division is delayed due to slowed replication. Cell size reaches new steady state in the third generation. Bottom panel shows constant rate of accumulation of initiation-competent replication initiators. Please also see Figure S2.
Figure 3
Figure 3. Decoupling of τcyc, S0 and λ by selective inhibition of biosynthesis using tunable CRISPR interference
(A) In the tCRISPRi strain, dCas9 is induced from an engineered PBAD promoter in a dose-dependent manner by arabinose, repressing the targeted gene with the help of specific sgRNA. Constitutive YFP is knocked down to demonstrate the tunability of the system. Figures are adapted from [20]. (B) Example images from tCRISPRi DnaA-expressing strain. The co-transcriptional reporter msfGFP level decreases as DnaA is knocked down. (C) Top: τcyc can be decoupled from S0 and λ by three orthogonal methods: slowing replication (Rep knockdown; circles, left), cell division (SulA over-expression; triangles, middle), or changing cell shape (MreB knockdown; squares, right). The symbol colors represent the degree of knockdown or overexpression (same for Figures 3D and 3E). Bottom: Cell size increases exponentially as predicted by the general growth law (solid line, no adjustable parameters; same for Figures 3D and 3E). The unit cell size S0 remains unchanged (open symbols). Grey band indicates average S0 from no-induction controls and its thickness indicates ±SD. (D) Top: The unit cell size S0 can be decoupled from τcyc and λ using two orthogonal methods: repression of DnaA (filled circles, left) or sequestration of oriC (filled triangles, right). Bottom: Cell size increases following the general growth law. The solid line is Eq. 1 with constant λ. The dashed line is Eq. 1, assuming a linear dependence of λ on S0 (fitted separately) to account for the slight decrease in growth rate in the S0 vs. λ data. Grey band indicates average S0 from no-induction controls and its thickness indicates ±SD. (E) Top: Decoupling λ from τcyc and S0 by nutrient limitation. Bottom: The nutrient growth law, namely the exponential dependence of the average size on λ, is a special case of Eq. 1, where S0 and τcyc are constant. The growth rate can be expressed in terms of the active ribosome fraction φR,a. The unit cell size S0 is constant over all growth rates. Grey band indicates the average S0 with thickness indicating ±SD. Please also see Figure S3.
Figure 4
Figure 4. Invariance of unit cell under extensive growth inhibition
(A) Cell size versus growth rate extensively deviates from the nutrient growth law (see legend to the right for experimental conditions). Numbered circles show three exemplary data points. The two empty circles represent pooled single-cell data from [6]. Coloring reflects which core biosynthetic process is perturbed (same for Figures 4C and 4D). (B) The initiation mass or unit cell size S0 remains invariant despite extensive changes in average size and growth rate. The distribution of S0 is well fitted by Gaussian, and its average (0.28 ± 0.05 μm3) coincides with the y-intercept of the nutrient growth law (0.27 ± 0.07 μm3). (C) Left: The measured τcyc vs. τ shows a linear relationship under growth inhibition. Right: The ribosome fraction φR increases when the growth rate decreases by growth inhibition. Empty circles represent pooled single-cell data from [6]. (D) An “inhibition diagram” mapping perturbations to the three core biosynthetic processes underlying the general growth law. Please also see Figures S2 and S4.
Figure 5
Figure 5. From the nutrient growth law (1958) to the general growth law
(A) The nutrient growth law by Schaechter, Maaløe, and Kjeldgaard (1958) [1] prescribes an exponential relationship between average cell size S and growth rate λ under nutrient limitation. Data points are taken from this study. (B) The general growth law extends the nutrient growth law. Not only λ but also S0 and τcyc are experimental variables. All raw data from Figure 4 (inset) collapse onto a single master curve after rescaling, demonstrating the predictive power of the general growth law and the origin of the nutrient growth law. Empty circles (with arrows) represent the average of pooled single-cell data from [6]. The cell diagrams on the right illustrate that the average cell size is the sum of all unit cells. Please also see Figure S5.
Figure 6
Figure 6. Invariance of initiation mass and resource allocation explain cell size in balanced growth
(A) Inhibition of global biosynthesis decreases the synthesis rate of all intracellular components by the same degree, without changing their concentrations or the cell cycle dynamics. Therefore, the initiation mass remains invariant. (B) In nutrient limitation, ribosome fraction changes linearly with respect to growth rate. However, the initiation mass remains invariant due to a constant fraction of “initiator” sector, independent of changes in the rest of proteome fraction. Under nutrient limitation, ribosome fraction increases with the growth rate, causing an increase in cell size. (C) Inhibition of cell-wall synthesis rebalances the ratio of available materials for surface growth and volume growth. Cells must reduce their surface-to-volume ratio to accommodate more volumetric biomass per unit surface area, and thus become more round. The cell size changes due to a new steady-state value of τcyc in the general growth law, without changing S0 or λ.

Comment in

Similar articles

Cited by

References

    1. Schaechter M, Maaløe O, Kjeldgaard NO. Dependency on medium and temperature of cell size and chemical composition during balanced growth of Salmonella typhimurium. Microbiology. 1958;19:592–606. - PubMed
    1. Hill NS, Kadoya R, Chattoraj DK, Levin PA. Cell size and the initiation of DNA replication in bacteria. PLoS Genet. 2012;8:e1002549. - PMC - PubMed
    1. Campos M, Surovtsev IV, Kato S, Paintdakhi A, Beltran B, Ebmeier SE, Jacobs-Wagner C. A Constant Size Extension Drives Bacterial Cell Size Homeostasis. Cell. 2014;159:1433–1446. - PMC - PubMed
    1. Basan M, Zhu M, Dai X, Warren M, Sévin D, Wang YP, Hwa T. Inflating bacterial cells by increased protein synthesis. Mol Syst Biol. 2015;11:836. - PMC - PubMed
    1. Kennard AS, Osella M, Javer A, Grilli J, Nghe P, Tans SJ, Cicuta P Cosentino Lagomarsino, M. Individuality and universality in the growth-division laws of single E. coli cells. Phys Rev E. 2016;93:12408. - PubMed

MeSH terms

Substances