. 2017 Jun 6;25(6):1282-1293.e7.
doi: 10.1016/j.cmet.2016.12.018. Epub 2017 Apr 13.

Foxp3 Reprograms T Cell Metabolism to Function in Low-Glucose, High-Lactate Environments

Affiliations

Foxp3 Reprograms T Cell Metabolism to Function in Low-Glucose, High-Lactate Environments

Alessia Angelin et al. Cell Metab. .

Abstract

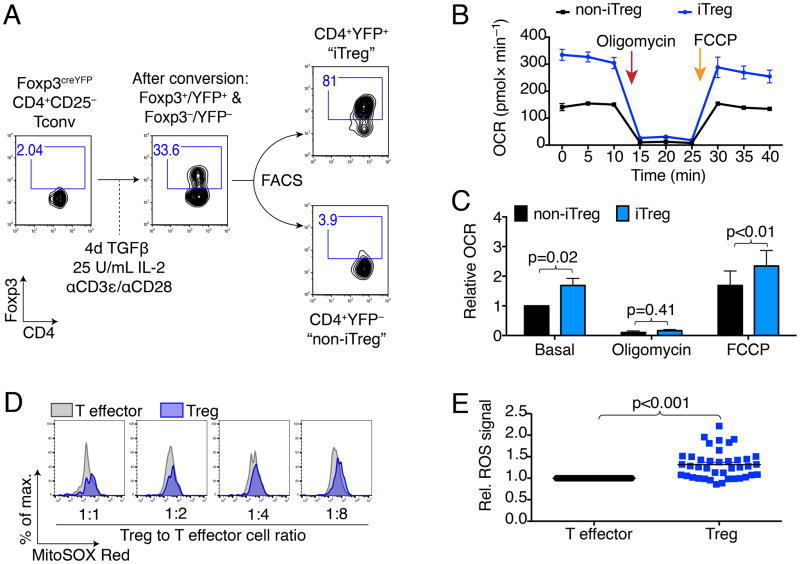
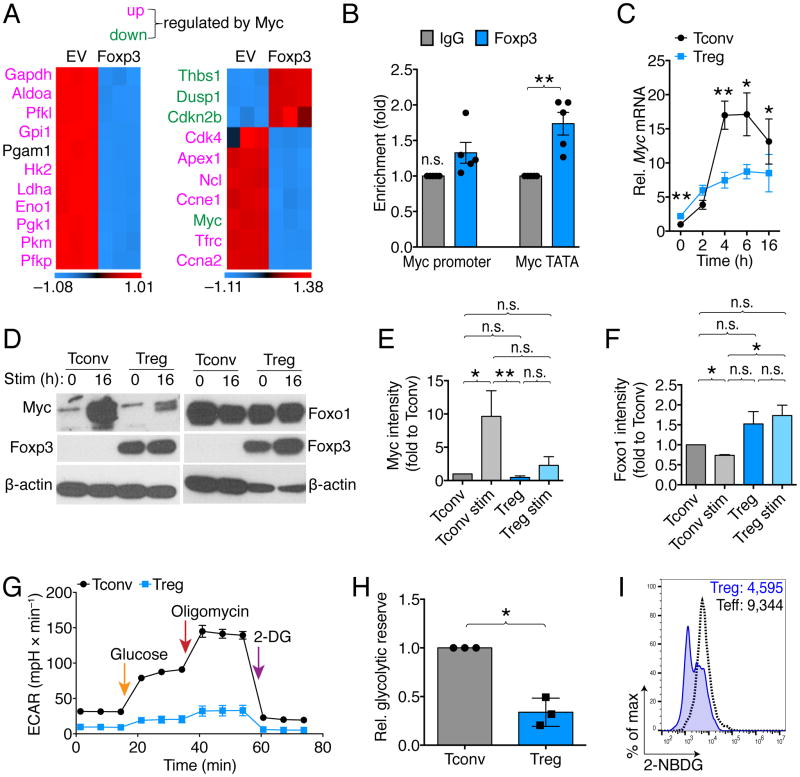
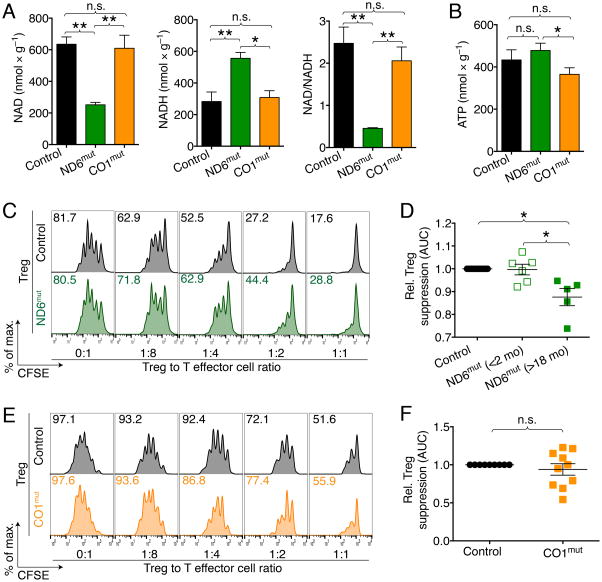
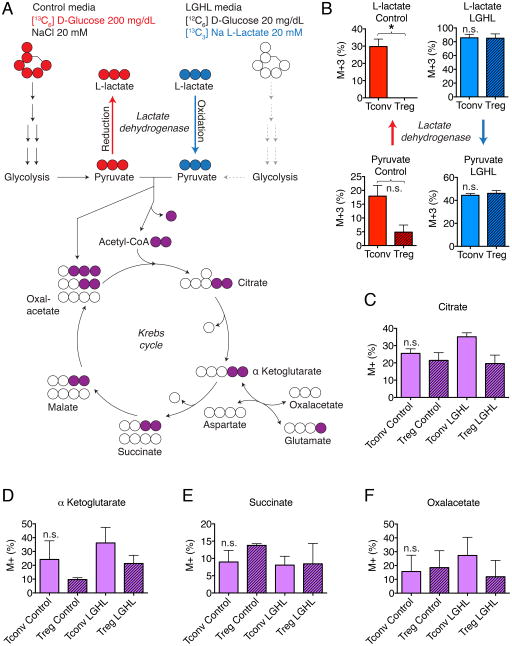
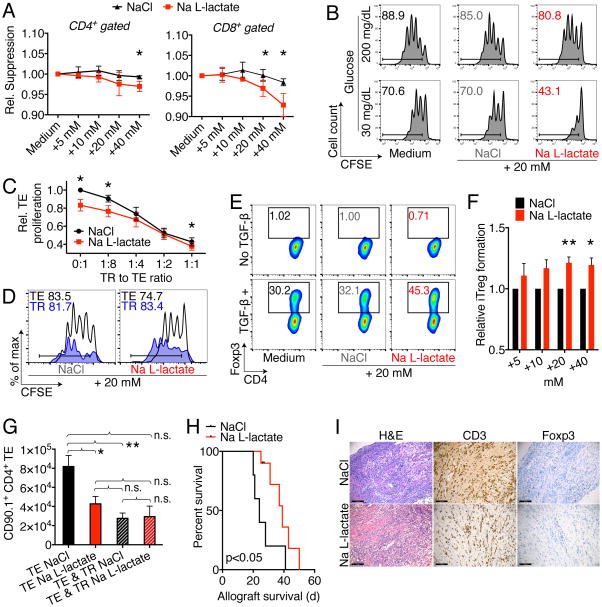
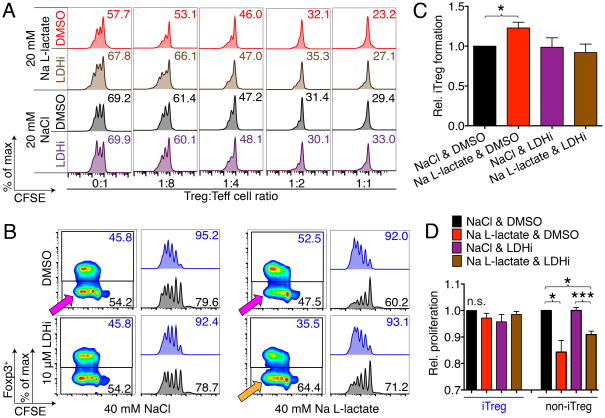
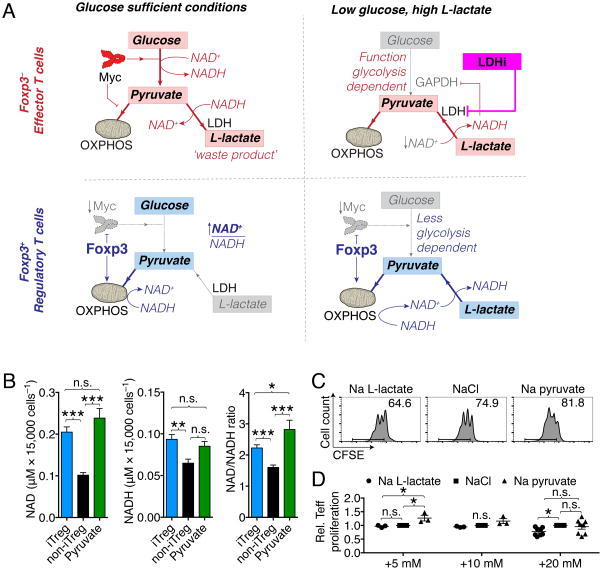
Immune cells function in diverse metabolic environments. Tissues with low glucose and high lactate concentrations, such as the intestinal tract or ischemic tissues, frequently require immune responses to be more pro-tolerant, avoiding unwanted reactions against self-antigens or commensal bacteria. T-regulatory cells (Tregs) maintain peripheral tolerance, but how Tregs function in low-glucose, lactate-rich environments is unknown. We report that the Treg transcription factor Foxp3 reprograms T cell metabolism by suppressing Myc and glycolysis, enhancing oxidative phosphorylation, and increasing nicotinamide adenine dinucleotide oxidation. These adaptations allow Tregs a metabolic advantage in low-glucose, lactate-rich environments; they resist lactate-mediated suppression of T cell function and proliferation. This metabolic phenotype may explain how Tregs promote peripheral immune tolerance during tissue injury but also how cancer cells evade immune destruction in the tumor microenvironment. Understanding Treg metabolism may therefore lead to novel approaches for selective immune modulation in cancer and autoimmune diseases.

Keywords: T cell metabolism; immune regulation; immunometabolism.


Figures

Figure 1
Figure 1. Expression of Foxp3 induces oxidative phosphorylation
(A) Induced Treg (iTreg) model: Conventional T cells (CD4+CD25, Tconv) were isolated from Foxp3YFPcre mice (Rubtsov et al., 2008), co-stimulated, and cultured under polarizing conditions to form iTreg, and then separated by fluorescence-activated cell sorting (FACS) into CD4+YPF+ “iTreg” and CD4+YFP “non-iTreg”. Foxp3 and CD4 purity was assessed by flow cytometry. (B, C) Seahorse oxygen consumption rate (OCR) measurement using sorted iTreg and non-iTreg. (B) After obtaining basal respiration, the cells were subjected to 1.25 μM oligomycin, which inhibits ATP synthase and limits mitochondrial OCR. Subsequently, FCCP (cyanide-4-(trifluoromethoxy)phenylhydrazone) was added (0.5 μM), which uncouples mitochondrial respiration and maximizes OCR. (B) Representative OCR with iTreg exhibiting higher oxygen consumption than non-iTreg. (C) Pooled data from eight independent experiments (paired Student t-test), data shown after antimycin A correction. (D, E) Foxp3YFPcre Tregs and C57BL/6 T effector cells were stimulated with anti-CD3ε mAb and with irradiated CD90.2 antigen presenting cells. ROS production was measured after three days by superoxide sensitive fluorescence. Percentage of maximum (% of max) shows normalization of overlaid data and represents number of cells in each bin divided by the number of cells in the bin that contains the largest number of cells. (D) Foxp3YFP+ Treg had persistently increased ROS production than T effector cells from the same well. (E) Data pooled form three independent experiments with 40 observations, paired Student t-test. *, **, and *** indicates p<0.05, p<0.01, and p<0.001, respectively. Error bars indicate SEM.
Figure 2
Figure 2. Foxp3 suppresses Myc and glycolysis
(A) Microarray analysis showed suppression of Myc signaling in Foxp3 vs. empty vector (EV) transduced T cells (3/group). (B) Chromatin immunoprecipitation of gDNA from 16 h co-stimulated Treg using Foxp3 pulldown showed identifies the TATA box of Myc as a Foxp3 binding site. Data pooled from five independent experiments (paired Student t-test). (C) Tconv and Treg were co-stimulated and cultured with 25 U × ml−1 IL-2, and RNA was obtained at the indicated time points. Tconv strongly upregulated Myc mRNA while Treg did not. Data pooled from six independent experiments (paired Student t-test). (D, E) Western blotting shows that unlike Tconv, co-stimulated Treg are unable to upregulate Myc, and showed better preservation of Foxo1. (D) Representative and (E, F) pooled data from six (Myc) and three (Foxo1) independent experiments, normalized to freshly isolated Tconv (paired one-way ANOVA). (G) Extracellular acidification rate (ECAR) measurements of 16 h co-stimulated Treg and Tconv indicates diminished capacity of Tregs to mount a glycolytic response. (G) Pooled glycolytic reserve data related to (F), 3/group, paired Student t-test. (H) Treg and Tconv were stimulated with soluble anti-CD3ε mAb and irradiated antigen presenting cells. After three days, effector T cells took up more fluorescent-labeled glucose (2-NBDG) than Treg. Data representative of two independent experiments. * and ** indicate p-values <0.05 and <0.01, respectively. Error bars indicate SEM. Abbreviations: Aldoa, Aldolase A; Pfkl, 6-phosphofructokinase, liver; Gpi, Glucose-6-phosphate isomerase; Pgam, Phosphoglycerate mutase; Hk, Hexokinase; Ldha, Lactate dehydrogenase A; Eno, Enolase; n.s., not significant; Pgk, Phosphoglycerate kinase; Pkm, pyruvate kinase, muscle; Pfkp, Phosphofructokinase, platelet; Thbs, Thrombospondin; Dusp, Dual specificity protein phosphatase; Cdkn2b, Cyclin-dependent kinase 4 inhibitor B; Cdk, Cyclin-dependent kinase; Apex, DNA-(apurinic or apyrimidinic site) lyase; Ncl, Nucleolin; Ccne1, Cyclin E1; Trfc, Transferrin receptor 1; Ccna2, Cyclin A1; 2-DG, 2-Deoxy-D-glucose.
Figure 3
Figure 3. Impairment in ETC complex I, but not complex IV, reduce Treg suppressive function
(A) NAD/NADH and (B) ATP measurements in heart tissue from age and gender matched ND6mut (ETC complex I defect), CO1mut (ETC complex IV defect) and co-housed wild type control mice (4–6/group). ND6mut mice show reduced NAD relative to NADH, with normal ATP production. CO1mut mice are capable of NADH to NAD oxidation, but show impaired ATP production. (C, D) Comparison of the ability of ND6mut versus control Tregs to suppress proliferation of CFSE-labeled T-effector (Teff) cells in vitro, stimulated with anti-CD3ε mAb and irradiated CD90.2 antigen presenting cells. (C) Representative flow cytometry and (D) cumulative analysis showing Treg from aged ND6mut mice have weaker suppressive Treg function versus results for WT Treg. Student’s t-test; data pooled from 11 observations and four independent experiments. (E) Comparison of the ability of CO1mut versus control Tregs shows no difference in suppressive function. (F) Cumulative data; Student’s t-test. Data pooled from 10 observations and three independent experiments. All wild type controls were age- and gender matched. * indicates p<0.05, and error bars indicate SEM.
Figure 4
Figure 4. Tregs favor oxidation of L-lactate to pyruvate over reduction of pyruvate to L-lactate
(A) Experimental design. (B) Left panels (red): Heavy glucose derivative analysis of M+3 pyruvate and M+3 L-lactate (with 3 × [13C]-atoms and no [12C]-atoms) shows that Tconv form more pyruvate and L-lactate than Treg. M+3 L-lactate was undetectable in Tregs. Right panel (blue): Both Tconv and Treg convert L-lactate to pyruvate. (C-F) Tricarboxylic acid derivative analysis shows that both Treg and Tconv integrate glucose and L-lactate into the Krebs cycle. Data pooled from three independent experiments (paired Student t-test). Abbreviations: LGHL, Low glucose, high L-lactate. M+ refers to tricarboxylic acid derivatives with at least one [13C]-atom (after background correction). Error bars indicate SEM.
Figure 5
Figure 5. L-lactate impairs T effector cells but not Tregs
(A) C57BL/6 splenocytes were labeled with CFSE and stimulated with 1 μg × ml−1 soluble CD3ε mAb, and CD4+ as well as CD8+ T cell proliferation was assessed after three days. Incremental doses of Na L-lactate suppressed T cell proliferation compared to NaCl control. Data pooled from four independent experiments (paired Student t-test). (B) CD4+CD25 Tconv were CFSE labeled and stimulated with anti-CD3ε mAb and irradiated antigen presenting cells. Reduced ambient glucose augmented the suppressive effect of pH neutral Na L-lactate suppression of T cell proliferation. Data representative of three independent experiments. (C) CFSE labeled effector T cells (TE) were co-stimulated with anti-CD3ε mAb and irradiated CD90.2 antigen presenting cells, and suppressed by adding regulatory T cells (TR) at the indicated ratios. In contrast to TE proliferation, TR suppressive function is not impaired by added Na L-lactate (7/group, paired Student t-test). (D) Treg suppression assay with CD90.1 Treg and CD90.2 effector T cells to track proliferation of each subpopulation. Na L-lactate impaired Teff proliferation, but not TR. Data representative of three independent experiments. (E) Representative and (F) quantified data from 10 independent Treg induction experiments under the same conditions as in Fig 1A (paired Student t-test). Added pH neutral Na L-lactate augments induced Treg formation. (G) B6/Rag1−/− mice were adoptively transferred with 1 × 10⁶ Tconv ± 2.5 × 10⁵ Treg cells, and treated i.p. with 60 μl × g−1 of 150 mM Na L-lactate or NaCl control for seven days. Administration of Na L-lactate reduced TE (CD90.1+CD4+) homeostatic proliferation without affecting TR suppressive function. * and ** indicates p<0.05 and p<0.01, respectively (3–11/group, ANOVA with Tukey’s multiple comparisons test). (H, I): Cardiac allografts from BALB/c (H-2d) donors were transplanted into the abdomens of MHC-mismatched C57BL/6 (H-2b) recipients. Recipients were then treated for 14 days with 0.2 mg × kg−1 × d−1 rapamycin i.p., and 60 μl × g−1 body weight of 150 mM Na L-lactate (9 μmol × g−1 × d−1, 10/group) or NaCl (5/group) control. (H) Na L-lactate injections led to a brief prolongation of allograft survival (Mantel Cox test). (I) Allograft histology at 20–28 d post-transplant shows a similar degree of lymphocyte infiltration, with equal CD3 and Foxp3 cells (4–5/group). Error bars indicate SEM.
Figure 6
Figure 6. Effects of L-lactate on T cell function are LDH dependent
(A) CFSE labeled effector T cells (Teff) were co-stimulated with anti-CD3ε mAb and irradiated CD90.2 antigen presenting cells in low glucose media (20 mg × dl−1), and suppressed by adding regulatory T cells (Treg) at the indicated ratios. Teff proliferation was impaired with Na L-lactate, and restored by addition of the LDH inhibitor (LDHi) GSK 2837808A. Data representative of three independent experiments. (B-D): CD4+CD25 Tconv were CFSE labeled and cultured under polarizing conditions to form iTreg (see Fig. 1A) in low glucose media (20 mg × dl−1). After 4 days, Foxp3+ iTreg formation was assessed. Na L-lactate did, as expected (Fig. 6E, F) increase iTreg formation. This was reverted by LDH inhibition. (B) Quantitative (4/group) and (C) representative data. (C) Interestingly, iTreg that upregulated Foxp3 were not impaired in their ability to proliferate, whereas T cells that did not upregulate Foxp3 (‘non-iTreg’) were suppressed by the addition of L-lactate (pink arrows). Exposure to a LDH inhibitor reversed this suppression, and protected the non-iTreg from impaired proliferation by Na L-lactate. (D) Quantitative proliferation data, 4/group. *, **, and *** indicates p<0.05, p<0.01, and p<0.001, respectively (paired one-way ANOVA for B & D). Error bars indicate SEM.
Figure 7
Figure 7. Foxp+ Treg have higher NAD:NADH ratios
(A) Conceptual model of how Foxp3+ Treg can escape the suppressive effects of low glucose, high L-lactate environments. (B) CD4+CD25 Tconv were isolated from Foxp3creYFP mice, co-stimulated, and cultured under polarizing conditions to form iTreg, and then separated by fluorescence-activated cell sorting (FACS) into CD4+YPF+ “iTreg” and CD4+YFP “non-iTreg” (see Figure 1A). After separation, the cells were re-exposed to stimulation conditions for one hour, and then harvested for NAD and NADH measurements. Expression of Foxp3 increased the fraction of NAD. Errors bars indicate SEM. (C, D) Tconv were CFSE labeled and co-stimulated for three days with soluble CD3ε mAb and irradiated antigen presenting cells in low glucose media (20 mg × dl−1) with added 5–20 mM of either NaCl, Na L-lactate, or Na pyruvate. (C) Flow cytometry (+20 mM) and (D) pooled data from 3–8 independent experiments shown. * indicates p<0.05 (one-way ANOVA), error bars indicate SEM.

Comment in

Similar articles

Cited by

References

    1. Akimova T, Beier UH, Wang L, Levine MH, Hancock WW. Helios expression is a marker of T cell activation and proliferation. PLoS One. 2011;6:e24226. - PMC - PubMed
    1. Akimova T, Levine MH, Beier UH, Hancock WW. Standardization, Evaluation, and Area-Under-Curve Analysis of Human and Murine Treg Suppressive Function. Methods Mol Biol. 2016;1371:43–78. - PMC - PubMed
    1. Akimova T, Xiao H, Liu Y, Bhatti TR, Jiao J, Eruslanov E, Singhal S, Wang L, Han R, Zacharia K, et al. Targeting sirtuin-1 alleviates experimental autoimmune colitis by induction of Foxp3+ T-regulatory cells. Mucosal Immunol. 2014;7:1209–1220. - PMC - PubMed
    1. Battke F, Symons S, Nieselt K. Mayday--integrative analytics for expression data. BMC Bioinformatics. 2010;11:121. - PMC - PubMed
    1. Beier UH, Angelin A, Akimova T, Wang L, Liu Y, Xiao H, Koike MA, Hancock SA, Bhatti TR, Han R, et al. Essential role of mitochondrial energy metabolism in Foxp3(+) T-regulatory cell function and allograft survival. FASEB J. 2015;29:2315–2326. - PMC - PubMed

MeSH terms