. 2017 Jul;7(7):716-735.
doi: 10.1158/2159-8290.CD-16-0441. Epub 2017 Apr 17.

Chemotherapy-Resistant Human Acute Myeloid Leukemia Cells Are Not Enriched for Leukemic Stem Cells but Require Oxidative Metabolism

Affiliations

Chemotherapy-Resistant Human Acute Myeloid Leukemia Cells Are Not Enriched for Leukemic Stem Cells but Require Oxidative Metabolism

Thomas Farge et al. Cancer Discov. 2017 Jul.

Abstract

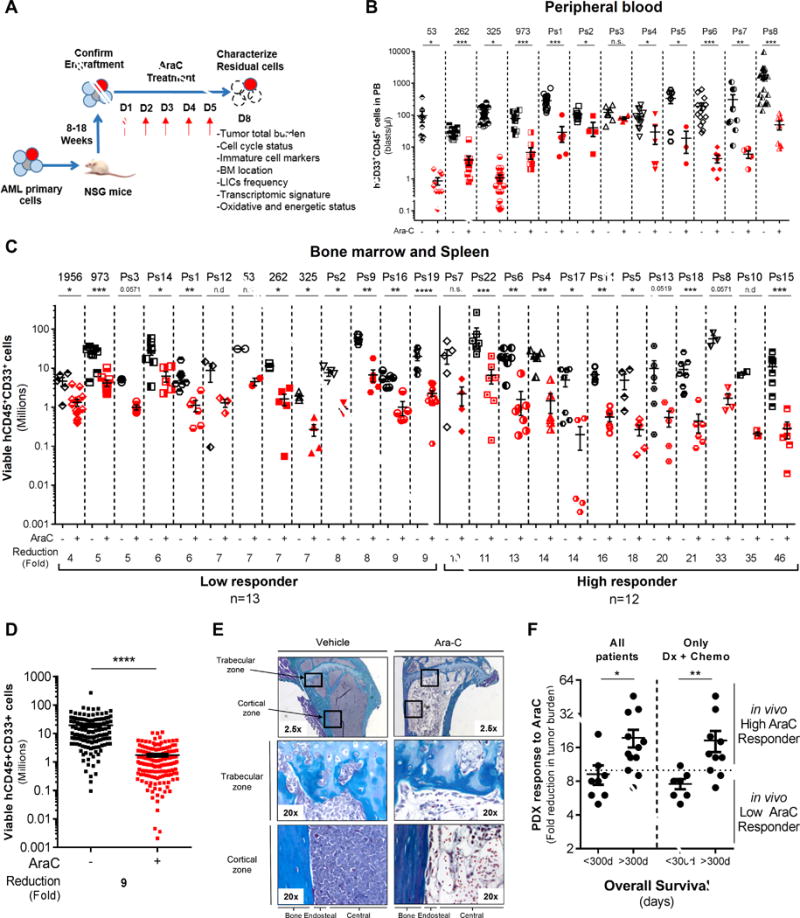
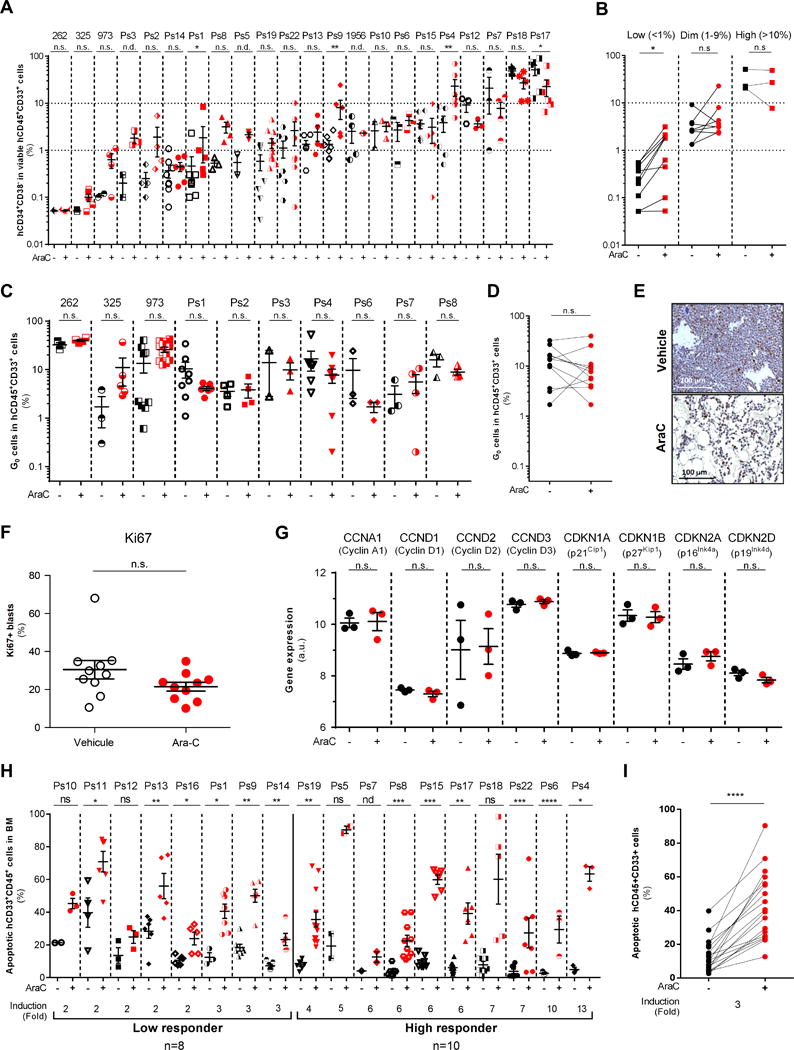
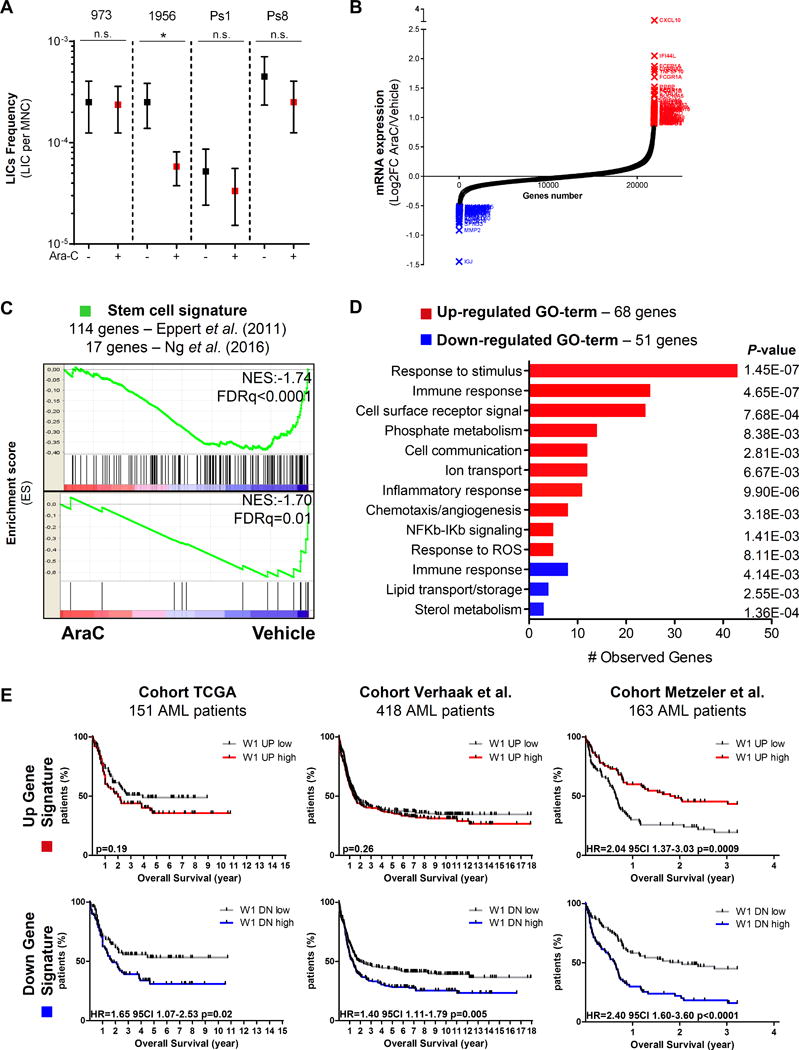
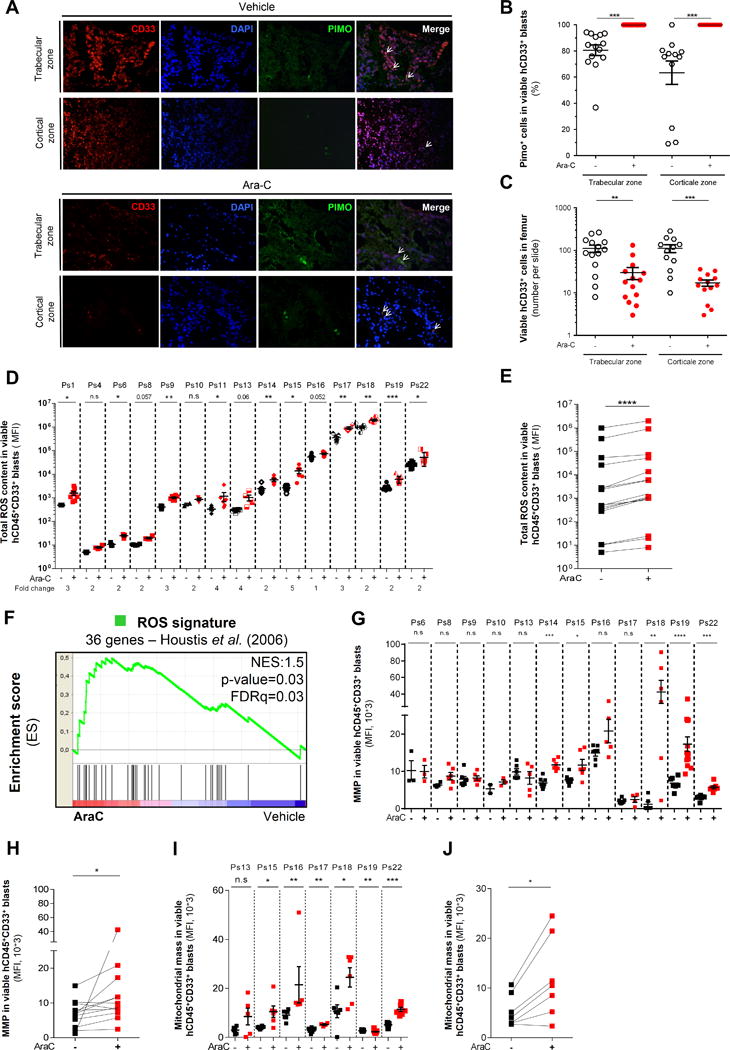
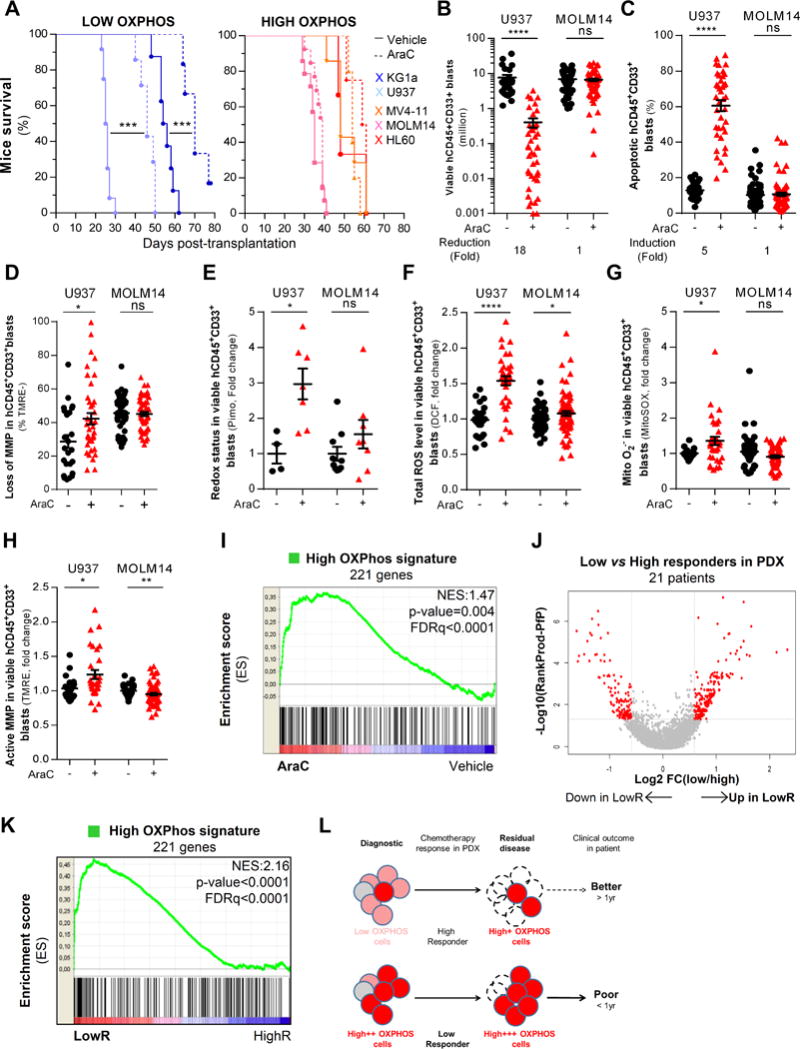
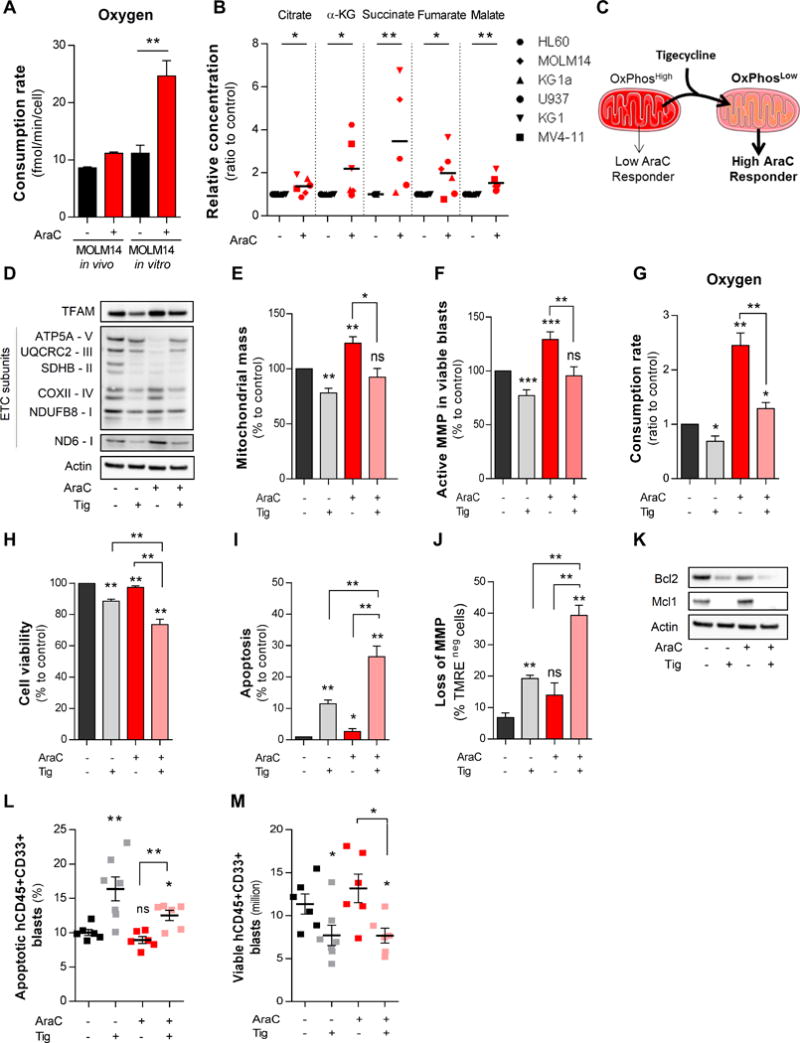
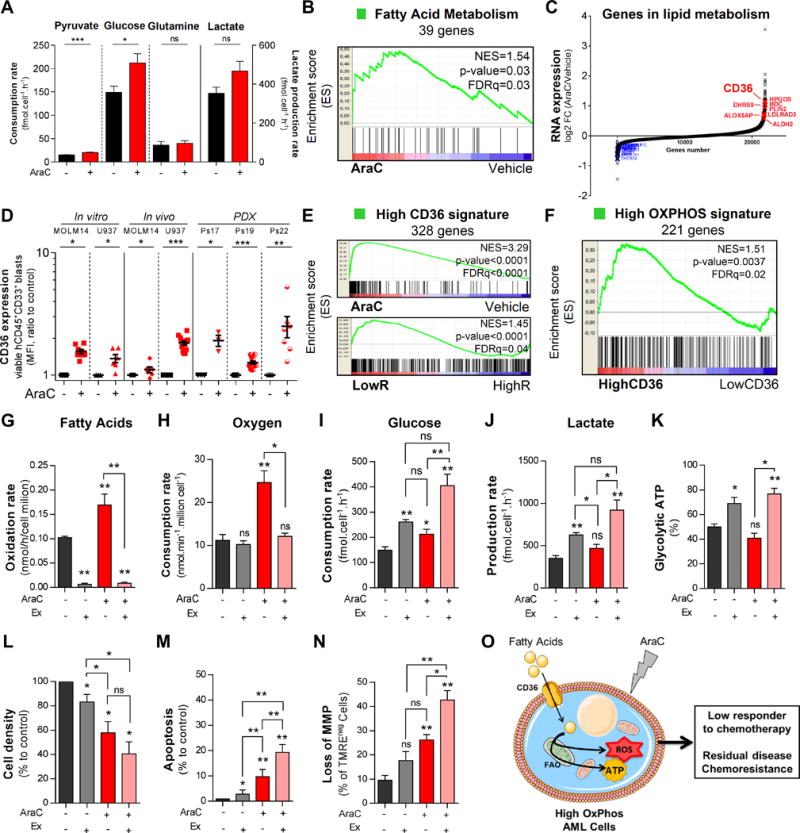
Chemotherapy-resistant human acute myeloid leukemia (AML) cells are thought to be enriched in quiescent immature leukemic stem cells (LSC). To validate this hypothesis in vivo, we developed a clinically relevant chemotherapeutic approach treating patient-derived xenografts (PDX) with cytarabine (AraC). AraC residual AML cells are enriched in neither immature, quiescent cells nor LSCs. Strikingly, AraC-resistant preexisting and persisting cells displayed high levels of reactive oxygen species, showed increased mitochondrial mass, and retained active polarized mitochondria, consistent with a high oxidative phosphorylation (OXPHOS) status. AraC residual cells exhibited increased fatty-acid oxidation, upregulated CD36 expression, and a high OXPHOS gene signature predictive for treatment response in PDX and patients with AML. High OXPHOS but not low OXPHOS human AML cell lines were chemoresistant in vivo. Targeting mitochondrial protein synthesis, electron transfer, or fatty-acid oxidation induced an energetic shift toward low OXPHOS and markedly enhanced antileukemic effects of AraC. Together, this study demonstrates that essential mitochondrial functions contribute to AraC resistance in AML and are a robust hallmark of AraC sensitivity and a promising therapeutic avenue to treat AML residual disease.Significance: AraC-resistant AML cells exhibit metabolic features and gene signatures consistent with a high OXPHOS status. In these cells, targeting mitochondrial metabolism through the CD36-FAO-OXPHOS axis induces an energetic shift toward low OXPHOS and strongly enhanced antileukemic effects of AraC, offering a promising avenue to design new therapeutic strategies and fight AraC resistance in AML. Cancer Discov; 7(7); 716-35. ©2017 AACR.See related commentary by Schimmer, p. 670This article is highlighted in the In This Issue feature, p. 653.


Conflict of interest statement

Disclosure of Potential Conflict of interest

The authors declare no conflict of interest.

Figures

Figure 1
Figure 1
In vivo cytarabine (AraC) treatment induces a significant reduction of the total cell tumor burden in AML-engrafted mice. A, Schematic diagram of the chemotherapy regimen and schedule used to treat NSG-based PDX models with AraC. Peripheral blood engraftment was assessed between 8–18 weeks and mice were assigned to experimental groups of 4–10 mice with similar average engraftment per group. Mice were treated with vehicle (PBS) or 60mg/kg/d AraC given daily via IP injection for 5 days. Mice were sacrificed post-treatment at day 8 in order to characterize viable residual AML cells. B–C–D, Total number of human viable AML cells expressing CD45, CD33 and CD44 was analyzed and quantified using flow cytometry in AraC-treated AML-xenografted mice compared to PBS-treated AML-xenografted mice in peripheral blood (B; blasts per μL of mice blood) and in bone marrow and spleen (C; total cell tumor burden in Millions). Fold reduction of total cell tumor burden in AraC-treated mice compared with control-treated mice was calculated individually for each AML patient samples and in the entire PDX cohort. E, Goldner staining of bone marrow (tibia section at low/2.5x or high/20x magnification) shows engraftment and localization of AML cells at the cortical and trabecular region of the bone in vehicle (PBS)- and AraC-treated mice. F, Correlative analysis between the in vivo response to AraC using our PDX model and the overall survival of all matched AML patients or of those at diagnosis and that received intensive induction chemotherapy (Dx+Chemo). Graphs of mean ± sem. P values were determined by Mann-Whitney test. n.s., not significant. n.d., not determined. *, P≤0.05; **, P≤0.01; ***, P≤0.001.
Figure 2
Figure 2
In vivo cytarabine (AraC) treatment does not induce any consistent changes in CD34+/−CD38+/− phenotypes nor in quiescent leukemic cells but increases apoptotic cell death in AraC-treated compared to PBS-treated AML-engrafted mice. A–B, Flow cytometry analyses of human viable (AnnexinV/7-AAD) CD45+CD33+ AML cells were performed to assess the percentage of CD34+CD38 cells in AraC-treated AML-xenografted mice compared to vehicle (PBS)-treated AML-xenografted mice (A) and stratified as following their basal level of CD34+CD38 phenotype (B). C–D, Hoechst/Pyronin Y-based flow cytometric assay was performed to measure cells in G0 in human viable (AnnexinV/7-AAD) CD45+CD33+ AML cells in AraC-treated AML-xenografted mice compared to vehicle (PBS)-treated AML-xenografted mice. E, Representative histological section showing Ki67 staining of the bone marrow. Scale bar, 100 μm. F, Ki67+ cycling cells quantification shows no difference between PBS-treated mice and AraC-treated mice. G, Expression level of genes involved into cell cycle checkpoint and G0-to-G1 transition in residual AML cells after AraC treatment compared to PBS. (H–I) Percent of human apoptotic CD45+CD33+ AML cells was assessed by AnnexinV/7AAD-based flow cytometric assay in AraC-treated AML-xenografted mice compared to vehicle (PBS)-treated AML-xenografted mice. Graphs of mean ± sem. P values were determined by Mann-Whitney test (A–C–F–G–H) or Wilcoxon matched-pairs signed rank test (B–D–I). n.s., not significant. n.d., not determined. *, P≤0.05; **, P≤0.01; ***, P≤0.001.
Figure 3
Figure 3
In vivo cytarabine (AraC) treatment does not enrich in leukemia-initiating stem cells (LICs) in AML-engrafted mice but uncovers a specific gene signature of immune/inflammatory stress response in AraC-resistant cells from AML-engrafted mice. A, The frequency of LICs from 4 different PDX was calculated for each treatment (vehicle/PBS versus AraC) group using regression analysis (L-Calc software). Graph of mean ± range. *P≤0.05. Mann-Whitney test was performed. B, Up- (red) and down- (blue) regulated gene signatures were generated from transcriptomes of human residual AML cells purified from AraC-treated AML-xenografted mice or vehicle (PBS)-treated AML-xenografted mice. C, Gene Set Enrichment Analysis (GSEA) of stem cell signatures functionally identified by Eppert et al. (13) or Ng et al. (28) was performed using transcriptomes of human residual AML cells purified from AraC-treated (red) compared to PBS/control-treated (blue) AML-xenografted mice. Kolmogorov-Smirnov statistical test was performed. D, Gene Ontology (GO) classification of up- (red) or down- (blue) regulated genes was identified in residual AML cells from AraC-treated compared to vehicle (PBS)-treated AML-xenografted mice by Genomatics software analysis. Fisher’s exact test was performed. E, Prognostic correlation of the up- (red, 68 genes) or down- (blue, 51 genes) regulated gene expression signature was performed in three independent AML cohorts of a total of 732 patients. Kaplan-Meier survival curve, number of patients and P values from log-rank tests are displayed.
Figure 4
Figure 4
In vivo residual AML cells have an increased oxidative metabolism with higher ROS content and retained active mitochondria after cytarabine (AraC) treatment. A, Representative histological section of bone marrow showing intracellular pimonidazole staining of viable CD33+ AML cells in trabecular and cortical zone of the femur from mice treated with vehicle (PBS) and AraC (60mg/kg/d; 5 days). B, Quantification of pimonidazole positive cells showing altered intracellular redox state in viable CD33+ cells after AraC treatment in vivo. C, Number of viable CD33+ AML cells in femur in the regard of different histological (trabecular versus cortical) section in both PBS-treated and AraC-treated AML-xenografted mice. D–E, Intracellular ROS levels were assessed using DCF-DA probe and analyzed by flow cytometry in human viable (AnnexinV/7-AAD) CD45+CD33+ AML cells from AraC- and vehicle (PBS)-treated AML-xenografted mice. F, Gene Set Enrichment Analysis (GSEA) of ROS signature generated by Houstis et al. (2006) was performed from transcriptomes of human residual AML cells purified from AraC-treated (red) compared to vehicle (PBS)-treated (blue) AML-xenografted mice. Kolmogorov-Smirnov statistical test was performed. G–H, Active mitochondrial membrane potential was assessed in human viable (AnnexinV/7-AAD) CD45+CD33+ AML cells from AraC-treated and vehicle (PBS)-treated AML-xenografted mice by flow cytometry using the cell permeant fluorescent TMRE probe. I–J, Mitochondrial mass was measured in human viable (AnnexinV/7-AAD) CD45+CD33+ AML cells from AraC- and vehicle (PBS)-treated AML-xenografted mice by flow cytometry using MitoTracker® Green (MTG) probe. Graphs of mean ± sem. P values were determined by Mann-Whitney test (B–C–D–G–I) or Wilcoxon matched-pairs signed rank test (E–H–J). n.s., not significant. *, P≤0.05; **, P≤0.01; ***, P≤0.001.
Figure 5
Figure 5
AML cells with high oxidative phosphorylation activity are more resistant to cytarabine (AraC) chemotherapy in vivo and residual human AML cells after AraC treatment in AML-engrafted mice exhibit a HIGH OXPHOS gene signature in vivo. A, Kaplan-Meier curves of mice survival were established for HIGH and LOW OXPHOS AML cell lines engrafted in NSG mice and treated with AraC (30mg/kg/day) or PBS during 5 days. Significance was determined by log-rank tests. B, Total cell tumor burden of human viable CD45+CD33+ AML cells was analyzed and quantified in PBS- and AraC-treated AML mice xenografted wit HIGH (MOLM14) and LOW (U937) OXPHOS AML cell lines using flow cytometry. C, Percent of human apoptotic CD45+CD33+ AML cells was analyzed using AnnexinV/7AAD-based flow cytometric assay in PBS- and AraC-treated MOLM14- or U937-xenografted mice. D, Loss of mitochondrial membrane potential was assessed with fluorescent TMRE probe using flow cytometry in human CD45+CD33+ AML cells in PBS- and AraC-treated MOLM14- or U937-xenografted mice. E, Intracellular redox status was assessed using pimonidazole probe and analyzed by flow cytometry in viable human AML cells from MOLM14- or U937-xenografted mice after PBS and AraC treatment. F, Intracellular total ROS levels were assessed using DCF-DA probe and analyzed by flow cytometry in viable human AML cells from MOLM14- or U937-xenografted mice after PBS and AraC treatment. G, Mitochondrial superoxide production was measured by MitoSOX probe using flow cytometry in viable human AML cells from MOLM14- or U937-xenografted mice after PBS and AraC treatment. H, Active mitochondrial membrane potential was assessed by flow cytometry using the fluorescent TMRE probe in viable human AML cells from MOLM14- or U937-xenografted mice after PBS and AraC treatment. I, Gene set enrichment analysis of the HIGH OXPHOS gene signature in viable human residual AML cells from AraC- and PBS-treated AML-xenografted mice. J, Volcano plot of most differentially expressed (230 up- and 151 down- regulated) genes identified in transcriptomes of AML patients that are Low compared to High Responders to AraC in PDX models. The adjusted p-values based on –log10 were plotted against the log2 ratio of gene expression level for all genes. K, Gene set enrichment analysis of the HIGH OXPHOS gene signature in transcriptomes of AML patients that are Low (red) compared to High (blue) responder in PDX models. L, Schematic diagram of the chemotherapy response, residual disease and their clinical outcome of HIGH OXPHOS versus LOW OXPHOS AML patients. Graphs of mean ± sem. Kolmogorov-Smirnov statistical test was performed. Mann-Whitney test was performed (A-K) n.s., not significant. *, P≤0.05; **, P≤0.01; ***, P≤0.001.
Figure 6
Figure 6
Cytarabine (AraC) residual AML cells increase mitochondrial respiration and targeting HIGH OXPHOS with tigecycline (TIG) enhances AraC chemotherapy efficacy in AML. A, Rates of oxygen consumption in HIGH OXPHOS MOLM14 cells were measured after PBS and AraC treatment both in vitro and in vivo using oxygraph with Clark electrode and Seahorse. B, Intracellular TCA cycle metabolites were quantified in PBS- or AraC-treated AML cell lines in vitro by ion chromatography coupled to mass spectrometry (IC-MS). C, Schematic diagram of TIG-induced effects on shifting HIGH OXPHOS towards LOW OXPHOS state that leads to a significant abrogation of AraC resistance in HIGH OXPHOS MOLM14 cells. D, Protein expression of mitochondrial transcription factor (mtTFAM) and oxidative phosphorylation (OXPHOS) complexes was assessed by western blot after 24h treatment with AraC (2μM) and TIG (50μM) in MOLM14 cells in vitro. E, Mitochondrial mass and F, active mitochondrial membrane potential were assessed by flow cytometry using the fluorescent MitoTracker® Green (MTG) and TMRE probes, respectively, in MOLM14 cells after PBS, TIG, AraC or TIG+AraC treatment. For each parameter the values were normalized to PBS-treated samples. G, Oxygen consumption rate in MOLM14 cells after PBS, TIG, AraC or TIG+AraC treatment. H, Cell viability after 24h of treatment were determined with trypan blue count. I, Percent of human apoptotic cells was measured in MOLM14 cells after PBS, TIG, AraC or TIG+AraC treatment using AnnexinV/7AAD-based flow cytometric assay. J, Loss of mitochondrial membrane potential was assessed in MOLM14 cells after PBS, TIG, AraC or TIG+AraC treatment by flow cytometry with TMRE probe. K, Protein expression of anti-apoptotic proteins (MCL1 and BCL2) was quantified in MOLM14 cells after PBS, TIG, AraC or TIG+AraC treatment by western blot analysis. L, Percentage of human apoptotic CD45+CD33+ AML cells was measured in MOLM14-xenografted mice after PBS, TIG, AraC or TIG+AraC treatment using AnnexinV/7AAD-based flow cytometry. M, Total cell tumor burden of viable human CD45+CD33+ AML cells was analyzed and quantified in MOLM14-xenografted mice after PBS, TIG, AraC or TIG+AraC treatment using flow cytometry. Graphs of mean ± sem. P values were determined by Mann-Whitney test. n.s., not significant. *, P≤0.05; **, P≤0.01; ***, P≤0.001.
Figure 7
Figure 7
Cytarabine (AraC) residual cells increases mitochondrial fatty acid oxidation and targeting HIGH OXPHOS metabolism with Etomoxir enhances AraC chemotherapy efficacy in AML. A, Metabolomic profiling of extracellular metabolites was performed to quantify the rate of production and consumption of extracellular glucose, glutamine, pyruvate and lactate following 24h AraC (2μM) treatment in MOLM14 cells using 1D1H NMR spectra. B, Gene set enrichment analysis of fatty acid metabolism gene signature was performed with transcriptomes of viable human residual AML cells from AraC and PBS-treated AML-xenografted mice. C, Genes involved in lipid metabolism including CD36 are upregulated in AraC-residual AML cells compared to vehicle-treated AML cells in PDX. D, Cell surface expression of CD36 was analyzed and quantified in viable human CD45+CD33+ AML cells after PBS and AraC treatment from U937 and MOLM14 cell lines in vitro and in vivo, and in three different PDX using flow cytometry. E, Gene Set Enrichment Analysis of High CD36 gene signature was performed from transcriptomes of human residual AML cells purified from vehicle (PBS)- and AraC treated xenografted mice (top) and from transcriptomes of AML patients that are Low versus High Responder to AraC treatment in NSG mice (bottom). Kolmogorov-Smirnov statistical test was performed. F, Gene Set Enrichment Analysis of HIGH OXPHOS gene signature was performed from transcriptomes of AML patients that are the highest CD36 mRNA expression compared to those with the lowest expression in TCGA cohort. G, Fatty acid oxidation rate was evaluated 24h after treatment of MOLM14 cells with PBS, AraC, Etomoxir (Ex, 200μM) and AraC+Ex. This assay assessed the labeled 14CO2 after incubation with [1-14C] palmitate acid using scintillation counter and normalized to cell number. H, Oxygen Consumption Rate was measured by Clark electrode at 24h post-treatment of MOLM14 cells with PBS, AraC, Ex and AraC+Ex in vitro. H–J, Glucose consumption and lactate production rate in extracellular medium were evaluated using 1D 1H NMR spectra. K, Percentage of glycolytic ATP production were quantified in MOLM14 cells after PBS, AraC, Ex and AraC+Ex in vitro treatment by CellTiter-Glo® Assay kit using a plate reading spectrophotometer. L, Cell density was determined with trypan blue count after 24h treatment of MOLM14 cells with PBS, AraC, Ex and AraC+Ex in vitro. M, Percentage of apoptotic cells was measured after 24h treatment of MOLM14 cells with PBS, AraC, Ex and AraC+Ex using AnnexinV/7AAD-based flow cytometry. N, Loss of mitochondrial membrane potential was assessed following 24h treatment of MOLM14 cells with PBS, AraC, Ex and AraC+Ex by fluorescent TMRE probe staining using flow cytometry. O, Schematic diagram of mechanism-of-resistance of AraC based on fatty acids as key source for maintaining HIGH OXPHOS metabolism and support cell survival upon AraC treatment. Graphs of mean ± sem. P values were determined by Mann-Whitney test. n.s., not significant. *, P≤0.05; **, P≤0.01; ***, P≤0.001.

Comment in

Similar articles

Cited by

References

    1. Tallman MS, Gilliland DG, Rowe JM. Drug therapy for acute myeloid leukemia. Blood. 2005;106 - PubMed
    1. Burnett A, Wetzler M, Lowenberg B. Therapeutic advances in acute myeloid leukemia. J Clin Oncol. 2011;29:487–94. - PubMed
    1. Ghiaur G, Wroblewski M, Loges S. Acute myelogenous leukemia and its microenvironment: A Molecular conversation. Semin Hematol. 2015;52:200–6. - PubMed
    1. Pallis M, Turzanski J, Higashi Y, Russell N. P-glycoprotein in acute myeloid leukaemia: therapeutic implications of its association with both a multidrug-resistant and an apoptosis-resistant phenotype. Leuk Lymphoma. 2002;43:1221–8. - PubMed
    1. Buzzai M, Licht JD. New molecular concepts and targets in acute myeloid leukemia. Curr Opin Hematol. 2008;15:82–7. - PubMed

MeSH terms