. 2017 Jun 1;77(11):2857-2868.
doi: 10.1158/0008-5472.CAN-16-2913. Epub 2017 Apr 17.

Targeting Autocrine CCL5-CCR5 Axis Reprograms Immunosuppressive Myeloid Cells and Reinvigorates Antitumor Immunity

Affiliations

Targeting Autocrine CCL5-CCR5 Axis Reprograms Immunosuppressive Myeloid Cells and Reinvigorates Antitumor Immunity

Yi Ban et al. Cancer Res. .

Abstract

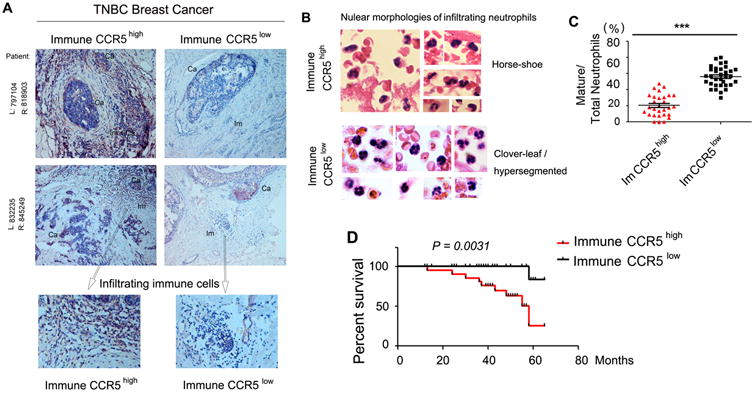
The tumor-promoting potential of CCL5 has been proposed but remains poorly understood. We demonstrate here that an autocrine CCL5-CCR5 axis is a major regulator of immunosuppressive myeloid cells (IMC) of both monocytic and granulocytic lineages. The absence of the autocrine CCL5 abrogated the generation of granulocytic myeloid-derived suppressor cells and tumor-associated macrophages. In parallel, enhanced maturation of intratumoral neutrophils and macrophages occurred in spite of tumor-derived CCL5. The refractory nature of ccl5-null myeloid precursors to tumor-derived CCL5 was attributable to their persistent lack of membrane-bound CCR5. The changes in the ccl5-null myeloid compartment subsequently resulted in increased tumor-infiltrating cytotoxic CD8+ T cells and decreased regulatory T cells in tumor-draining lymph nodes. An analysis of human triple-negative breast cancer specimens demonstrated an inverse correlation between "immune CCR5" levels and the maturation status of tumor-infiltrating neutrophils as well as 5-year-survival rates. Targeting the host CCL5 in bone marrow via nanoparticle-delivered expression silencing, in combination with the CCR5 inhibitor Maraviroc, resulted in strong reductions of IMC and robust antitumor immunities. Our study suggests that the myeloid CCL5-CCR5 axis is an excellent target for cancer immunotherapy. Cancer Res; 77(11); 2857-68. ©2017 AACR.


Conflict of interest statement

Conflicts of Interests: the authors declare no conflicts of interests.

Figures

Figure 1
Figure 1
Alterations of maturation status of myeloid granulocyte lineage in the absence of host CCL5. (A) ccl5−/− mice have significantly smaller total burden of 4T1 tumor. 4T1 tumor cells were transplanted into mammary pads of Balb/c WT or ccl5-/- mice. Representative tumor volumes, tumor weights (g) and tumor growth curves were shown as indicated. (B) H&E stained 4T1 tumor sections. Pictures are representative of six 4T1 tumors carried by WT or ccl5−/− mice. (C) Flow cytometric analysis of Ly6G/6C expression in tumor-infiltrating Ly6G+ cells sorted via magnetic beads from WT or ccl5−/− mice. (D) H&E staining of intratumoral Ly6Clow/−/Ly6Ghigh (P1, WT), Ly6Cint/ly6Gint (P2, ccl5−/−) and Ly6Chigh/Ly6Ghigh (P3, ccl5−/−) cells. Ly6G+ cells described in 1C were further FASC-sorted based on various Ly6G/6C levels. (E) Flow cytometric data showing side scatters of populations (P1-3) with various levels of Ly6C expression. (F) Flow cytometric analysis of LAMP2 expression in tumor-infiltrating P1 and P2. (G) Phagocytosed fluorescence of BM-derived macrophages, P1, P2 and P3 cells. Cells were sorted as described in 1D. (H) Flow cytometric analysis of CD86 and MHCII expression in tumor-infiltrating Ly6G+ cells sorted as described in 1C. Histogram shows CD86 expression of Ly6G-sorted / MHCII+−gated cells. Ly6G+ cells were magnetically sorted from 3-5 pooled 4T1 tumors / group, and data shown in 1A,1C-1H are representative of 2-5 independent experiments (3-5 mice/group). Phagocytosed fluorescence detection in 4 wells; mean ± SEM.
Figure 2
Figure 2
Dependence of TAM differentiation on host CCL5. (A) Flow cytometric detection of inflammatory monocytes (CCR2+/CX3CR1low) in whole BM aspirates pooled from WT or ccl5−/− mice with or without 4T1 tumor. (B) Flow cytometric analysis of CCR2 and F4/80 in sorted Ly6C+ cells from pooled 4T1 tumors carried by WT or ccl5−/− mice. (C) Flow cytometric analysis of CD11bhigh/MHCII+ (MTMs) and CD11blow/MHCII+ (TAMs) in ungated single cell suspension of pooled 4T1 tumors carried by WT or ccl5−/− mice. (D) Quantification of CD11C+/MHCII+/VCAM1+ TAMs in 4T1 tumors carried by WT or ccl5−/− mice, mean± SEM. (E) Edu incorporation in sorted intratumoral CD11b+/MHCII+ cells from WT or ccl5−/− mice. Flow cytometric analysis was performed at 18 h after Edu addition. (F) Flow cytometric analysis for green emission of MTM and TAM populations in 4T1 tumors carried by recipient mice. All data are representative of 2-3 independent experiments with cells pooled from 3-5 Balb/c mice / group.
Figure 3
Figure 3
Suspended subtype-switching of MDSCs in the absence of autocrine CCL5. (A) CCL5 expression in BM MDSCs in response to 4T1 progression. (B) At ∼ 4 weeks post-inoculation, BM aspirates from WT and ccl5-/- mice with or without (naive) 4T1 tumor were analyzed flow cytometrically against Ly6C /Ly6G. (C) Sorted BM M-MDSCs (Ly6C+/Ly6G) from naive WT and ccl5−/− mice were cultured in MDSC media for 4 days, followed by analysis on expressions of Ly6C and Ly6G before vs after culture. (D) BM MDSCs (Gr-1+/CD11b+) sorted from WT and ccl5−/− mice with (tumor: tu) or without (naïve:n) 4T1 tumor were subject to qPCR analysis of relative expression of Rb1 (upper, Rb1 mRNA in 4T1 cells was set to 1) and immunoblot analysis (lower). Data are representative of 2-4 experiments with cells pooled from 3-5 mice/group. qPCR in triplicates. mean ± SEM.
Figure 4
Figure 4
Functional defects of Ly6Chigh/Ly6Ghigh MDSCs. (A-C) Sorted BM MDSCs (Gr-1+/CD11b+) described in (3D) were analyzed by Next Generation RNA-sequencing (A) and flow cytometry for expressions of intracellular NOS2 (B) and membrane-bound IL-4Rα (C). (D) Sorted BM MDSCs from naive WT and ccl5−/− mice were cultured in MDSC media. ROS/NO detection dyes were added to cultures and fluorescence was observed as instructed by product manual. (E) ELISA results of secreted TGFβ and IL-10 (24h) by WT MDSCs or ccl5−/− MDSCs. (F) Digested 4T1 tumors carried by WT or ccl5−/− mice were flow cytometrically analyzed for CD8+ T cell infiltration. (G) Splenocytes from 4T1 tumor (4 weeks)-bearing WT and ccl5−/− mice were analyzed for CD3+/CD4+ and CD3+/CD8+ T cells counts. Results represented 2-3 independent experiments with cells pooled from 3-5 mice/group; ELISA in triplets; mean ± SEM.
Figure 5
Figure 5
Unaltered phenotypic and functional defects of ccl5−/− MDSCs in tumor due to persistent absence of CCR5. (A) Flow cytometric analysis on Ly6C/Ly6G expression of MDSC populations in whole population of 4T1 tumors borne by WT or ccl5−/− mice. CCL5 in TME was confirmed by ELISA. (B) Immunoblotting of sorted MDSCs (CD11b+/Gr-1+) from 4T1 tumors (4w) carried by WT and ccl5−/− mice against Rb1 and GAPDH. (C) Immunoblotting of sorted BM-residing and 4T1 tumor-infiltrating MDSCs from WT or ccl5−/− mice against NOS2 and GAPDH (n: naïve; tu: tumor). (D) T cells proliferation in co-culture with tumor-infiltrating WT or ccl5−/− MDSCs. (E) Flow cytometric analysis of GzmB and PD-1 expression in CD8+ T cells infiltrating 4T1 tumors carried by WT or ccl5−/− mice. CD8+ T cells were sorted from 4-8 pooled 4T1 tumors / group via CD8 microbeads. (F) Flow cytometric analysis of CD4+ /FOXP3+ Tregs in inguinal lymph nodes draining 4T1 tumors carried by WT or ccl5−/− mice. (G) Gene expression profiling of CCL5 receptors (CCR1, CCR3 and CCR5) in sorted BM MDSCs as described in 3D. (H-J) Flow cytometric analysis on the expression of CCL5 receptors in sorted BM (H,I) and tumor-infiltrating (J) MDSCs as described previously. (K) Immunoblotting of sorted BM and intratumoral MDSCs against p-JAK3, p-IKBα and GAPDH. Data are representative of 2-3 independent experiments with cells pooled from 3-8 mice / group. mean ± SEM.
Figure 6
Figure 6
Inverse correlation between “immune CCR5” and progression of TNBCs in patients. (A) CCR5 immunochemistry in human TNBC specimens (CCR5: red to brown; nuclei: blue). Representative images of high (CCR5high, left, n=29) and low CCR5 expression (CCR5low, right, n=33) of infiltrating immune cells (Ca: cancer; Im: immune cells). (B) Representative H&E images of nuclear morphologies of intratumoral neutrophils from immune CCR5high (left) vs immune CCR5low (right) groups. (C-D) Percentages of mature neutrophils with hypersegmented nuclei (C) and Kaplan-Meier curve of 5-year-survival rates (D) of immune CCR5high vs CCR5low patients.
Figure 7
Figure 7
Reinvigorated anti-tumor immunity upon treatments targeting CCL5-CCR5 axis. (A) A representative SEM image of MSV nanoparticle. (B) Microscopic analysis of the release of fluorescent siRNA. Alexa555-CCL5-siRNA was released from ESTA-MSV in murine BM in a time dependent manner (Green: ESTA-MSV, Red: Alexa555-CCL5-siRNA, Blue: nuclei). (C) 4T1 tumor growth curve under the treatment of PBS (Mock), MSV nanoparticles loaded with scrambled siRNA (Control) and MSV nanoparticles loaded with CCL5-targeting siRNA (CCL5-targeting) (1st to 3rd treatment indicated by black arrows. The red arrow indicates the time point of analysis). (D-E) Total 4T1 tumor burden (g) (D) and spleen weights (g) (E) of 3 groups described in 7C. (F) Flow cytometric analysis of Ly6C/ Ly6G expression on BM-MDSCs and intratumoral MDSCs in mice treated with control or CCL5-targeting nanoparticles. BM cells were gated on Gr-1+. (G-H) TAMs positive for CD11C, MHCII and VCAM1 (G) and SSClow / CD8+ T cells (H) in 4T1 tumors carried by mice treated with mock, control or CCL5-targeting nanoparticles were counted via flow cytometer. (I) Flow cytometric analysis of GzmB and PD-1 expression by tumor-infiltrating CD8+ T cells sorted via CD8 microbeads. (J-L) Synergistic effects of CCL5-targeting nanoparticles and Maraviroc. Control group were treated with control nanoparticles (i.v) and DMSO (i.p.); the rest 2 groups were respectively treated with Maraviroc only (8mg/kg, i.p.) and Maraviroc combined with CCL5-targeting nanoparticles (i.v.).Tumor weights (J), growth curves (K) and counts of TAMs, tumor-infiltrating CD8+ T cells and GzmB+ / PD-1 / CD8 + T cells (L) in 3 groups were shown as indicated. Data are representative of 2-4 independent experiments (n=4 to 8 / group).

References

    1. Fridlender ZG, et al. Polarization of tumor-associated neutrophil phenotype by TGF-beta: “N1” versus “N2” TAN. Cancer Cell. 2009;16:183–194. - PMC - PubMed
    1. Noy R, Pollard JW. Tumor-associated macrophages: from mechanisms to therapy. Immunity. 2014;41:49–61. - PMC - PubMed
    1. Parker KH, Beury DW, Ostrand-Rosenberg S. Myeloid-Derived Suppressor Cells: Critical Cells Driving Immune Suppression in the Tumor Microenvironment. Adv Cancer Res. 2015;128:95–139. - PMC - PubMed
    1. Engelhardt JJ, et al. Marginating dendritic cells of the tumor microenvironment cross-present tumor antigens and stably engage tumor-specific T cells. Cancer Cell. 2012;21:402–417. - PMC - PubMed
    1. Gabrilovich DI, Nagaraj S. Myeloid-derived suppressor cells as regulators of the immune system. Nat Rev Immunol. 2009;9:162–174. - PMC - PubMed

Publication types