. 2017 May 31;37(22):5574-5586.
doi: 10.1523/JNEUROSCI.3582-16.2017. Epub 2017 Apr 17.

MicroRNA Profiling Reveals Marker of Motor Neuron Disease in ALS Models

Affiliations

MicroRNA Profiling Reveals Marker of Motor Neuron Disease in ALS Models

Mariah L Hoye et al. J Neurosci. .

Abstract

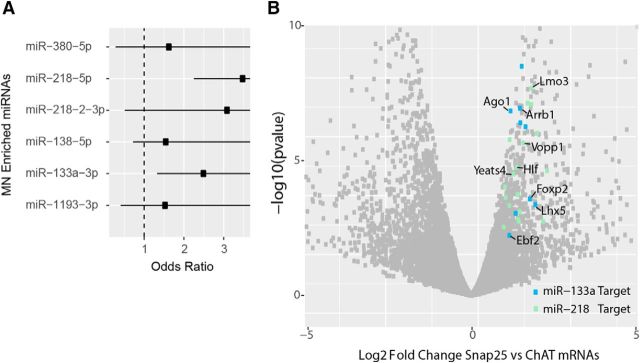
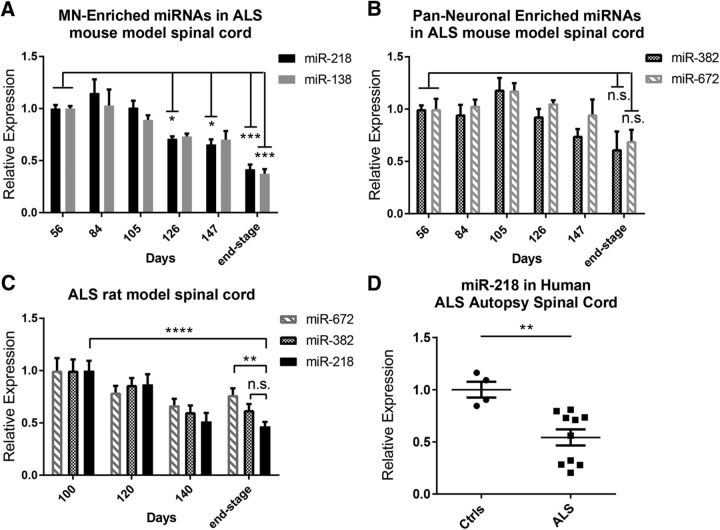
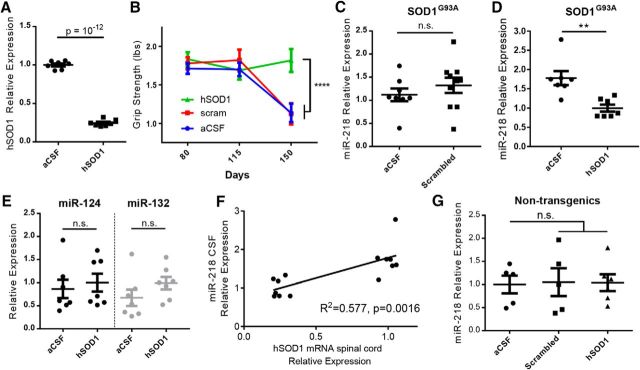
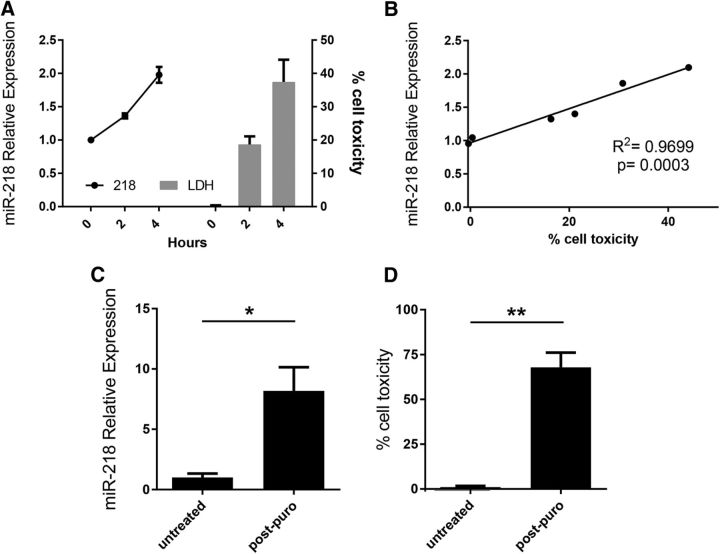
Amyotrophic lateral sclerosis (ALS) is a progressive neurodegenerative disorder marked by the loss of motor neurons (MNs) in the brain and spinal cord, leading to fatally debilitating weakness. Because this disease predominantly affects MNs, we aimed to characterize the distinct expression profile of that cell type to elucidate underlying disease mechanisms and to identify novel targets that inform on MN health during ALS disease time course. microRNAs (miRNAs) are short, noncoding RNAs that can shape the expression profile of a cell and thus often exhibit cell-type-enriched expression. To determine MN-enriched miRNA expression, we used Cre recombinase-dependent miRNA tagging and affinity purification in mice. By defining the in vivo miRNA expression of MNs, all neurons, astrocytes, and microglia, we then focused on MN-enriched miRNAs via a comparative analysis and found that they may functionally distinguish MNs postnatally from other spinal neurons. Characterizing the levels of the MN-enriched miRNAs in CSF harvested from ALS models of MN disease demonstrated that one miRNA (miR-218) tracked with MN loss and was responsive to an ALS therapy in rodent models. Therefore, we have used cellular expression profiling tools to define the distinct miRNA expression of MNs, which is likely to enrich future studies of MN disease. This approach enabled the development of a novel, drug-responsive marker of MN disease in ALS rodents.SIGNIFICANCE STATEMENT Amyotrophic lateral sclerosis (ALS) is a neurodegenerative disease in which motor neurons (MNs) in the brain and spinal cord are selectively lost. To develop tools to aid in our understanding of the distinct expression profiles of MNs and, ultimately, to monitor MN disease progression, we identified small regulatory microRNAs (miRNAs) that were highly enriched or exclusive in MNs. The signal for one of these MN-enriched miRNAs is detectable in spinal tap biofluid from an ALS rat model, where its levels change as disease progresses, suggesting that it may be a clinically useful marker of disease status. Furthermore, rats treated with ALS therapy have restored expression of this MN RNA marker, making it an MN-specific and drug-responsive marker for ALS rodents.

Keywords: ALS; TRAP; miRAP; microRNAs; motor neuron; motor neuron disease.


Figures

Figure 1.
Figure 1.
Generation of cell-specific expression of GFP-myc-Ago2 and identification of CNS cell-type-enriched miRNA expression profiles. A, Mice were generated to express Cre recombinase under cell-type-specific promoters. Cre recombinase drives expression of a tagged miRNA-binding protein, Ago2, in the desired cell type. B, Spinal cord sections from transgenic mice were stained for ChAT (red; MNs) and GFP (green). Scale bar, 50 μm. C, Schematic of miRAP demonstrating selective expression of GFP-myc-tagged Ago2 in MNs, which allows for IP of myc to isolate miRNAs from only MNs or IP of Ago2 to isolate miRNA from all spinal cord cell types. D, Hierarchical heat map clustering demonstrating that spinal cord CNS cell types can be identified by their unique miRNA expression profiles. Colored bars along the right side of the heat map correspond to miRNAs enriched in distinct CNS cell types (orange = GFAP/astrocytes, yellow = Lyz2/microglia, red = ChAT/MNs, green = Syn/all neurons). Values are expressed as log2 fold change. E, 3D PCA illustrating that CNS cell types cluster according to their miRNA expression profiles. The replicates of each spinal cord cell type cluster with each other more so than with any other cell type. miRNA expression from Ago2 IP from one of each of these four mice cluster, indicating that global miRNA signatures are comparable. F, Putative endogenous miRNA controls for CNS cell types. Using global LoessM normalization of the miRNA microarray data, miR-191, miR-24, and miR-30c were found to be expressed consistently across CNS cell types in both brainstem and spinal cord. For the CNS cell types analyzed here, these miRNAs could serve as controls for normalizing miRNA RT-qPCR data. The LoessM-normalized miRNA array data for CNS cell types in both brainstem and spinal cord and the miRNAs found to be enriched in these cell types can be found in Fig. 1-1.
Figure 2.
Figure 2.
Identification of MN-enriched miRNAs in CNS tissues. A, Individual RT-qPCR assays confirming the specificity of MN-enriched miRNAs compared with all other spinal cord neurons. n = 6. Values are expressed as means. B, miR-218 (red) is detected in ChAT+ (green) MNs in the anterior horns of adult mouse spinal cord by in situ hybridization. Scale bar, 50 μm. C, miRAP of LSL-tAgo2, Cnp1-Cre mice followed by individual RT-qPCR assays indicates that MN-enriched miRNAs are significantly more abundant in MNs than oligodendrocytes in the spinal cord. n = 5–6. D, The oligodendrocyte-enriched miRNA miR-338–3p is more abundant in oligodendrocytes than MNs in the spinal cord, indicating that miRAP works in LSL-tAgo2, Cnp1-Cre mice. n = 5–6. Values are expressed as mean ± SEM. Relative expression normalized to a geometric mean of miR-30c, miR-24, and miR-191 (A, C, D). Student's unpaired, two-tailed t test with Bonferroni correction for multiple (five, A) or (six, C and D combined) comparisons. ****p ≤ 0.0001.
Figure 3.
Figure 3.
MN-enriched miRNAs repress non-motor neuron transcription-associated mRNA expression. A, Forest plot indicating the odds ratio of MN depleted mRNAs (Snap25 increased mRNAs) having target binding sites of MN-enriched miRNAs. B, Volcano plot indicating the Snap25-enriched mRNAs containing miR-218 (green) or miR-133a (blue) binding sites. The labeled mRNAs are associated with transcription and transcription regulation. These terms were significantly represented (p = 0.022 and 0.033, respectively, Benjamini–Hochberg corrected) in the Snap25-upregulated mRNAs containing MN-enriched miRNA-binding sites using DAVID analysis.
Figure 4.
Figure 4.
MN-enriched miRNAs are depleted temporally in ALS rodent model and human patient spinal cord. A, The MN-enriched miRNAs miR-218 and miR-138 are significantly depleted in ALS mouse (SOD1G93A) model spinal cord. This depletion occurs temporally and is maximized at end stage. n = 3–4. B, Pan-neuronal enriched miRNAs are not significantly depleted in ALS mouse model spinal cord, even at end stage. n = 3–4. C, MN-enriched miR-218 is significantly depleted in ALS rat model spinal cord and more so than the pan-neuronal miRNAs miR-382 and miR-672. n = 4–5. D, miR-218 is significantly depleted in human ALS patient autopsy spinal cord compared with age-matched controls. n = 4–10. Values are expressed as mean ± SEM. *p ≤ 0.05, **p ≤ 0.01, ***p ≤ 0.001, ****p ≤ 0.0001, one-way ANOVA with multiple comparisons (Dunnett's) (A), Student's unpaired, two-tailed t test (B, D), and two-way ANOVA (C). Relative expression is normalized to RNA input and endogenous miRNA control miR-24 (A, B) or U6 snRNA (C, D).
Figure 5.
Figure 5.
miR-218 levels are maintained in surviving MNs in ALS model mice. A, miR-218 levels in ALS spinal MNs are not significantly changed from presymptomatic (70 d) to symptomatic (140 d) time points in ALS model mice. n = 5/time point. B, miR-218 fluorescent signal in ChAT+ spinal MNs is not changed significantly between littermate control and SOD1G93A 140 d mice. n = 46–49 ChAT+ MNs/group. C, Representative images of miR-218 in situ and ChAT staining in control and SOD1G93A 140 d mouse model spinal cord. Scale bar, 50 μm. D, Quantification of 10 littermate control and 20 SOD1G93A spinal cord sections. The number of ChAT+ spinal MNs per unit area is significantly different between littermate control and SOD1G93A 140 d mice. Values are expressed as mean ± SEM (A, B, D). ****p ≤ 0.0001. Student's two-tailed, unpaired t test (A, B, D).
Figure 6.
Figure 6.
Levels of MN-enriched miRNAs are increased in ALS rat model CSF. A, miR-218 expression is increased temporally in ALS rat model CSF. n = 5–7/time point. The 115 d and 130 d time points included rats ranging from 112–119 d and 126–134 d, respectively. End-stage rats ranged from 160–242 d; average = 192 ± 30 d. In addition, increased miR-218 levels in ALS rat model CSF are not due solely to hSOD1 overexpression. miR-218 CSF levels are not increased at either 90 or 165 d in hSOD1 WT overexpressing rats. n = 2–5/time point. B, The neuronal miRNAs miR-132 and miR-124 are not significantly increased in ALS rat model CSF. Values are expressed as mean ± SEM. Relative expression normalized to a geometric mean of miR-103a-3p, miR-24, and miR-191. *p ≤ 0.05, **p ≤ 0.01, Kruskal–Wallis with multiple comparisons (Dunn) (A) and one-way ANOVA with multiple comparisons (Dunnett's) (B).
Figure 7.
Figure 7.
hSOD1 knockdown specifically and effectively preserves MN function and MN-enriched miRNAs are responsive to therapy. A, hSOD1 mRNA knockdown after treatment with hSOD1 ASO. There is an average 75% reduction in hSOD1 levels in the lumbar spinal cord of SOD1G93A rats treated with SOD1 ASO compared with aCSF-treated controls. n = 7/group. B, Hindlimb grip strength of aCSF, scrambled ASO, and hSOD1 ASO-treated SOD1G93A rats at 80, 115, and 150 d. C, miR-218 CSF levels are not significantly different in aCSF- and scrambled ASO-treated SOD1G93A littermates. n = 8–10. D, miR-218 in CSF is reduced in rats treated with SOD1-lowering ASO compared with aCSF-treated controls. n = 7/group. These aCSF vs scrambled ASO and aCSF vs hSOD1 ASO treatment cohorts were tested at separate time points. E, The neuronal miRNAs miR-132 and miR-124 are not responsive to ALS therapy. n = 7/group. F, miR-218 CSF levels have a strong and significant correlation with hSOD1 mRNA spinal cord levels. G, miR-218 CSF levels are not changed after treatment with aCSF, scrambled, or hSOD1 ASO in nontransgenic rats. n = 5/group. Values are expressed as mean ± SEM and are normalized to GAPDH (A) or a geometric mean of endogenous miRNA biological fluid controls, miR-103a, miR-24, and miR-191 (CE, G). **p ≤ 0.01, ****p ≤ 0.0001, Student's unpaired, two-tailed t test (A, C, D, E), one-way ANOVA (G), two-way ANOVA (B), linear regression analysis (F).
Figure 8.
Figure 8.
Increased miR-218 CSF levels are correlated with number of remaining SMI-32+ spinal MNs in ALS model rats. A, Number of SMI-32+ MNs in the lumbar spinal cord of ALS rats is negatively and highly correlated with their corresponding miR-218 CSF levels. B, Number of SMI-32+ MNs is positively and highly correlated with corresponding miR-218 levels in lumbar spinal cord tissue. Linear regression analysis was used.
Figure 9.
Figure 9.
Extracellular miR-218 levels are increased subsequent to MN injury or death. A, miR-218 levels and LDH levels (shown as percentage cell toxicity) are temporally increased in the media of primary Hb9-GFP MNs treated with 1 mm sodium arsenite. n = 2/group. B, miR-218 media levels are strongly correlated with LDH activity, a marker of cell death. n = 2/group with 3 technical replicates per n. C, miR-218 is increased in the media of iPSC-derived MNs after puromycin treatment. n = 3. D, LDH activity (shown as percentage cell toxicity) is increased after puromycin treatment. n = 3 with 3 technical replicates per n. Values are expressed at mean ± SEM and are normalized to media volume (A, C). *p ≤ 0.05, **p ≤ 0.01, linear regression analysis (B), Student's unpaired, two-tailed t test (C, D).

Similar articles

Cited by

References

    1. Aluise CD, Sowell RA, Butterfield DA (2008) Peptides and proteins in plasma and cerebrospinal fluid as biomarkers for the prediction, diagnosis, and monitoring of therapeutic efficacy of Alzheimer's disease. Biochim Biophys Acta 1782:549–558. 10.1016/j.bbadis.2008.07.008 - DOI - PMC - PubMed
    1. Amin ND, Bai G, Klug JR, Bonanomi D, Pankratz MT, Gifford WD, Hinckley CA, Sternfeld MJ, Driscoll SP, Dominguez B, Lee KF, Jin X, Pfaff SL (2015) Loss of motoneuron-specific microRNA-218 causes systemic neuromuscular failure. Science 350:1525–1529. 10.1126/science.aad2509 - DOI - PMC - PubMed
    1. Andreasen D, Fog JU, Biggs W, Salomon J, Dahslveen IK, Baker A, Mouritzen P (2010) Improved microRNA quantification in total RNA from clinical samples. Methods 50:S6–S9. 10.1016/j.ymeth.2010.01.006 - DOI - PubMed
    1. Ardekani AM, Naeini MM (2010) The role of microRNAs in human diseases. Avicenna J Med Biotechnol 2:161–179. - PMC - PubMed
    1. Bajenaru ML, Zhu Y, Hedrick NM, Donahoe J, Parada LF, Gutmann DH (2002) Astrocyte-specific inactivation of the neurofibromatosis 1 gene (NF1) is insufficient for astrocytoma formation. Mol Cell Biol 22:5100–5113. 10.1128/MCB.22.14.5100-5113.2002 - DOI - PMC - PubMed

Publication types