. 2017 Jun 2;292(22):9394-9408.
doi: 10.1074/jbc.M117.781294. Epub 2017 Apr 17.

CD36 receptor regulates malaria-induced immune responses primarily at early blood stage infection contributing to parasitemia control and resistance to mortality

Affiliations

CD36 receptor regulates malaria-induced immune responses primarily at early blood stage infection contributing to parasitemia control and resistance to mortality

Ramesh P Thylur et al. J Biol Chem. .

Abstract

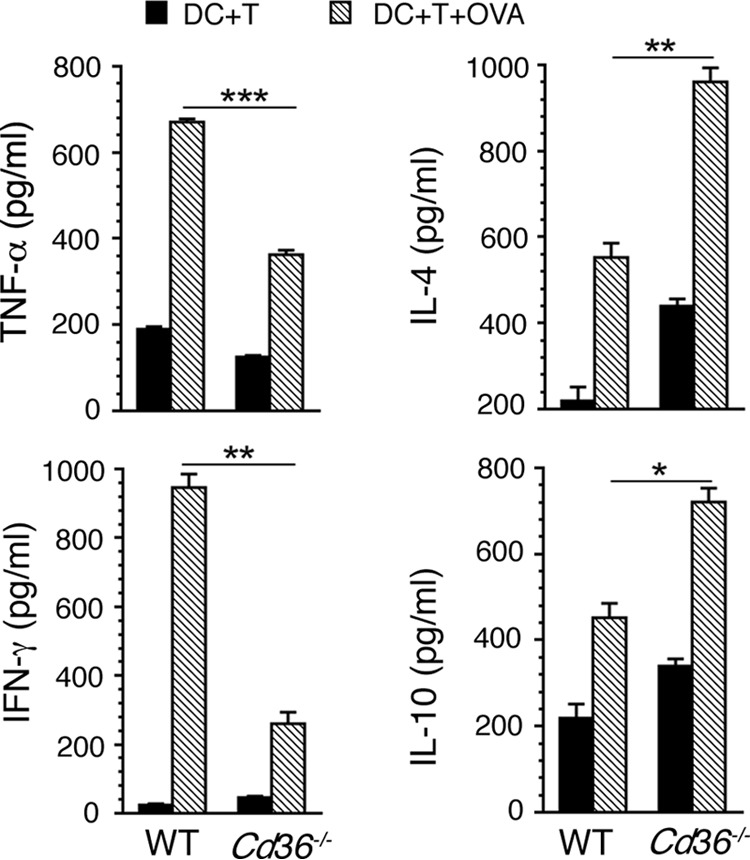
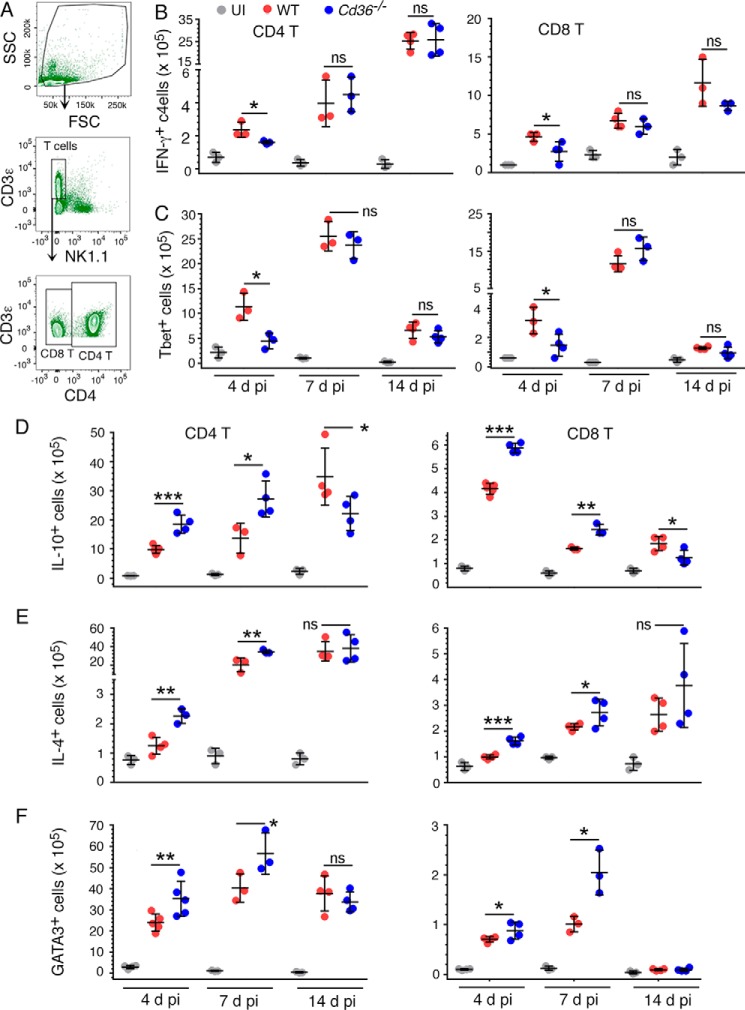
In malaria, CD36 plays several roles, including mediating parasite sequestration to host organs, phagocytic clearance of parasites, and regulation of immunity. Although the functions of CD36 in parasite sequestration and phagocytosis have been clearly defined, less is known about its role in malaria immunity. Here, to understand the function of CD36 in malaria immunity, we studied parasite growth, innate and adaptive immune responses, and host survival in WT and Cd36-/- mice infected with a non-lethal strain of Plasmodium yoelii Compared with Cd36-/- mice, WT mice had lower parasitemias and were resistant to death. At early but not at later stages of infection, WT mice had higher circulatory proinflammatory cytokines and lower anti-inflammatory cytokines than Cd36-/- mice. WT mice showed higher frequencies of proinflammatory cytokine-producing and lower frequencies of anti-inflammatory cytokine-producing dendritic cells (DCs) and natural killer cells than Cd36-/- mice. Cytokines produced by co-cultures of DCs from infected mice and ovalbumin-specific, MHC class II-restricted α/β (OT-II) T cells reflected CD36-dependent DC function. WT mice also showed increased Th1 and reduced Th2 responses compared with Cd36-/- mice, mainly at early stages of infection. Furthermore, in infected WT mice, macrophages and neutrophils expressed higher levels of phagocytic receptors and showed enhanced phagocytosis of parasite-infected erythrocytes than those in Cd36-/- mice in an IFN-γ-dependent manner. However, there were no differences in malaria-induced humoral responses between WT and Cd36-/- mice. Overall, the results show that CD36 plays a significant role in controlling parasite burden by contributing to proinflammatory cytokine responses by DCs and natural killer cells, Th1 development, phagocytic receptor expression, and phagocytic activity.

Keywords: CD36; Plasmodium yoelii; cellular immune response; cytokine induction; humoral response; immune regulation; malaria; phagocytic receptors; phagocytosis; resistance to disease.


Conflict of interest statement

The authors declare that they have no conflicts of interest with the contents of this article

Figures

Figure 1.
Figure 1.
CD36 contributes to malaria parasitemia control and confers resistance to malaria mortality. In these and all other in vivo experiments, WT and Cd36−/− mice were infected by i.p. injection of P. yoelii IRBCs (1 × 10⁶/mouse). Mice were monitored daily for mortality (A), and parasitemias (B) were assessed on alternative days by counting IRBCs in Giemsa-stained blood smears and mean parasitemia values of surviving mice were plotted. A, shown are the combined results of two separate experiments, one performed using seven WT and six Cd36−/− mice and the other using three WT and eight Cd36−/− mice. B, the results are representative of three independent experiments. Error bars indicate S.D. of surviving mice in each group. *, p < 0.05; **, p < 0.01; ***, p < 0.001. C, percent parasitemia in WT and Cd36−/− mice and percentage of difference in parasitemia between WT and Cd36−/− mice at the indicated time points.
Figure 2.
Figure 2.
CD36 regulates cytokine responses to malaria infection. A–G, cytokines in sera prepared from the blood collected from uninfected (UI) mice (n = 3) and P. yoelii-infected WT and Cd36−/− mice (n = 4–5 mice/group) at the indicated time points were analyzed by ELISA. Sera of uninfected mice were analyzed as controls. In A–G, error bars indicate S.D. of mice in each group. *, p < 0.05; **, p < 0.01; ***, p < 0.001; ns, not statistically significant.
Figure 3.
Figure 3.
CD36 regulates malaria infection-induced DC maturation and cytokine production. Mice were infected with P. yoelii as outlined in the legend to Fig. 1. A–E, total splenocytes from uninfected and P. yoelii-infected mice at 4 days pi were stained with antibodies against mouse CD80, CD86, DC surface markers, and cytokines. A–C, gating of DCs (A) and surface expression of CD80 and CD86 by gated DCs (B and C) are shown. B and C, left panels, show histograms of co-stimulatory molecule-expressing DCs from a representative mouse in each group (n = 3–6 mice/group). Shaded area, red line, and blue line, respectively, represent uninfected (UI), infected WT, and infected Cd36−/− mice. Right panels show the expression of CD80 and CD86 by DCs in each mouse group. D and E, the spleen cells from uninfected mice and infected WT and Cd36−/− mice were cultured in 24-well plates for 6 h in the presence of GolgiPlug, stained with antibodies against DC marker proteins, fixed, stained with antibodies against mouse cytokines, and analyzed by flow cytometry. Contour diagrams of cytokine-expressing spleen DCs from a representative mouse at 4 days pi (left panels) and plots showing the frequencies of cytokine-expressing DCs at 4 and 7 days pi in a representative mouse in each group (right panels) (n = 3–4 mice/group) are shown. DCs at 7 days pi were similarly gated for cytokine expression. The data are a representative of three independent experiments. F, pooled DCs isolated from the spleens of uninfected mice and P. yoelii-infected WT and Cd36−/− mice at 5 and 10 days pi in 96-well plates were incubated in complete DMEM at 37 °C. After 24 h, cytokines released into the culture medium were analyzed by ELISA. In B–F, the results are a representative of two independent experiments. Error bars indicate S.D. of mice in each group. *, p < 0.05; **, p < 0.01; ns, not statistically significant. d, days; FSC, forward scatter; SSC, side scatter; GeoMFI, geometric mean fluorescence intensity.
Figure 4.
Figure 4.
CD36-modulates cytokine responses by T cells. DCs (1 × 10⁵ cells/well) isolated from the spleens of P. yoelii-infected WT and Cd36−/− mice at 5 days pi were co-cultured with OT-II T cells (0.5 × 10⁵/well) from uninfected mice in 96-well plates in the presence of 2 μg/ml OVA(323–339) peptide for 72 h. Co-cultures of DCs and OT-II T cells without OVA(323–339) peptide treatment were used as controls. The cytokines in the culture medium were analyzed by ELISA. Data shown are a representative of two independent experiments. Error bars indicate S.D. of triplicate co-cultures. *, p < 0.05; **, p < 0.01; ***, p < 0.001.
Figure 5.
Figure 5.
CD36 contributes to the malaria-induced immune responses by NK cells. Splenocytes from uninfected (UI) and P. yoelii-infected WT and Cd36−/− mice (n = 3 or 4 mice/group) at 4 and 7 days pi were cultured in complete DMEM in the presence of GolgiPlug for 6 h, stained with antibodies against NK cell markers, fixed, then stained with anti-cytokine and anti-Tbet antibodies, and analyzed by flow cytometry. A shows the gating of NK cells. B–E, analysis of gated cytokine- and Tbet-expressing NK cells. Left panels show contour diagrams of NK cells expressing TNF-α (B), IFN-γ (C), Tbet (D), and IL-10 (E) from a representative mouse in each group at 4 days pi; cells from infected mice at 7 days pi were similarly analyzed. Right panels represent frequencies of cytokine- and Tbet-expressing NK cells. Data are a representative of three independent experiments. Error bars indicate S.D. of mice in each group. *, p < 0.05; **, p < 0.01; ns, statistically not significant. d, days; FSC, forward scatter; SSC, side scatter.
Figure 6.
Figure 6.
CD36 contributes to malaria-induced T cell responses. Splenocytes from uninfected and P. yoelii-infected mice (n = 4–5 mice/group) at 4, 7, and 14 days pi were cultured in complete DMEM in the presence of GolgiPlug for 6 h and stained with antibodies against mouse T cell surface markers. The cells were fixed, stained with anti-cytokine and anti-transcription factor antibodies, and analyzed by flow cytometry. A shows the gating of T cells. B–F, the gated T cells from splenocytes of uninfected mice (UI) and infected WT and Cd36−/− mice at the indicated time points of infection were analyzed as outlined in Fig. 5 for NK cells, and the numbers of IFN-γ-, Tbet-, IL-10-, IL-4-, and GATA3-expressing cells were plotted. The data are a representative of three independent experiments. Error bars indicate S.D. of mice in each group. *, p < 0.05; **, p < 0.01; ***, p < 0.001; ns, statistically not significant. d, days; FSC, forward scatter; SSC, side scatter.
Figure 7.
Figure 7.
CD36 up-regulates phagocytic receptor expression and phagocytosis of malaria parasites. P. yoelii IRBCs isolated from the blood of infected WT mice were labeled with CFSE and injected into P. yoelii-infected WT and Cd36−/−mice (n = 3–4/group) at 4, 7, or 13 days pi. After 18 h at each time point, splenocytes from uninfected (UI) mice and infected WT and Cd36−/− mice were prepared and stained with antibodies against surface markers for Mφs and PMNs and the indicated phagocytic receptors. The cells were analyzed by flow cytometry. A, shown is the gating for CD11b+F4/80+ Mφs and CD11bhiLy6Ghi PMNs. B and C, shown are the numbers of CFSE+ IRBCs internalized by spleen Mφs and PMNs (B) and the numbers of the gated receptor-expressing spleen Mφs and PMNs (C). Error bars indicate S.D. of individual mice in each group. *, p < 0.05; **, p < 0.01; ***, p < 0.001; ns, statistically not significant. d, days; FSC, forward scatter; SSC, side scatter.
Figure 8.
Figure 8.
IFN-γ up-regulates phagocytosis of IRBCs and phagocytic receptor expression. BMDMs (5 × 10⁵ cells/well) in 24-well plates were treated with 20 units/ml IFN-γ at 37 °C for 24 h and incubated with CFSE-stained IRBCs (1 × 10⁴ cell/well) for 1 h. The cells were stained with dye-conjugated antibodies against mouse CD11b, CR1/CR2, and Fcα/μR and analyzed by flow cytometry. A--C, shown are percent CFSE+ (A), CR1/CR2+ (B), and Fcα/μR+ (C) BMDMs. Error bars indicate S.D. of quadruplicate cultures. *, p < 0.05; **, p < 0.01; ***, p < 0.001.
Figure 9.
Figure 9.
CD36 has no role in humoral immunity. A and B, mice were infected with P. yoelii and sacrificed at 5 or 8 days pi, and sera from the total blood were prepared. A, the parasite-specific serum IgM levels of mice (n = 3 or 4 mice/group) were analyzed by ELISA. Sera from uninfected WT mice were used as a control. Data are a representative of three independent experiments. ns, statistically not significant. B and C, flow cytometry analysis of splenic B1a and B1b B cells of mice at 5 days pi. B1 cells from spleens of uninfected WT mice were analyzed as a control. Shown are the gating strategy for gating B1a and B1b cells (B) and splenic B1a and B1b cell numbers in infected mice and uninfected control mice (C). D and E, antibody titer (D) and Ig isotypes (E) in sera prepared from P. yoelii-infected WT and Cd36−/− mice (n = 4 or 5/group) at 26 days pi were analyzed by ELISA. Sera of uninfected mice were analyzed as controls. C–E, the data are a representative of two independent experiments. In A and C–E, error bars indicate S.D. of mice in each group. d, days; FSC, forward scatter; SSC, side scatter; FMO, fluorescence minus one.

Similar articles

Cited by

References

    1. World Health Organization (2015) World Malaria Report 2015, World Health Organization, Geneva
    1. Murray C. J., Rosenfeld L. C., Lim S. S., Andrews K. G., Foreman K. J., Haring D., Fullman N., Naghavi M., Lozano R., and Lopez A. D. (2012) Global malaria mortality between 1980 and 2010: a systematic analysis. Lancet 379, 413–431 - PubMed
    1. Battle K. E., Guerra C. A., Golding N., Duda K. A., Cameron E., Howes R. E., Elyazar I. R., Baird J. K., Reiner R. C. Jr., Gething P. W., Smith D. L., and Hay S. I. (2015) Global database of matched Plasmodium falciparum and P. vivax incidence and prevalence records from 1985–2013. Sci. Data 2, 150012. - PMC - PubMed
    1. Howes R. E., Battle K. E., Mendis K. N., Smith D. L., Cibulskis R. E., Baird J. K., and Hay S. I. (2016) Global epidemiology of Plasmodium vivax. Am. J. Trop. Med. Hyg. 95, (suppl.) 15–34 - PMC - PubMed
    1. Baird J. K. (2009) Resistance to therapies for infection by Plasmodium vivax. Clin. Microbiol. Rev. 22, 508–534 - PMC - PubMed

Publication types

MeSH terms