. 2017 Jun 2;292(22):9382-9393.
doi: 10.1074/jbc.M117.788562. Epub 2017 Apr 17.

Hypoxia-inducible factor 1α activates insulin-induced gene 2 (Insig-2) transcription for degradation of 3-hydroxy-3-methylglutaryl (HMG)-CoA reductase in the liver

Affiliations

Hypoxia-inducible factor 1α activates insulin-induced gene 2 (Insig-2) transcription for degradation of 3-hydroxy-3-methylglutaryl (HMG)-CoA reductase in the liver

Seonghwan Hwang et al. J Biol Chem. .

Abstract

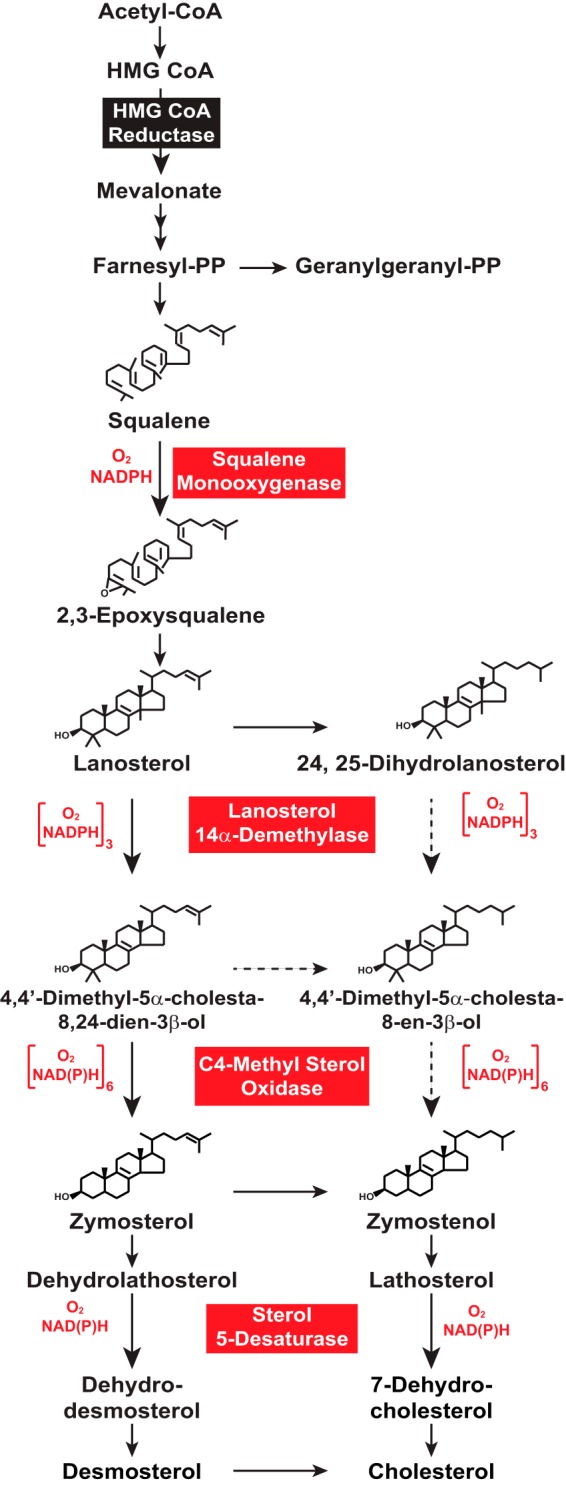
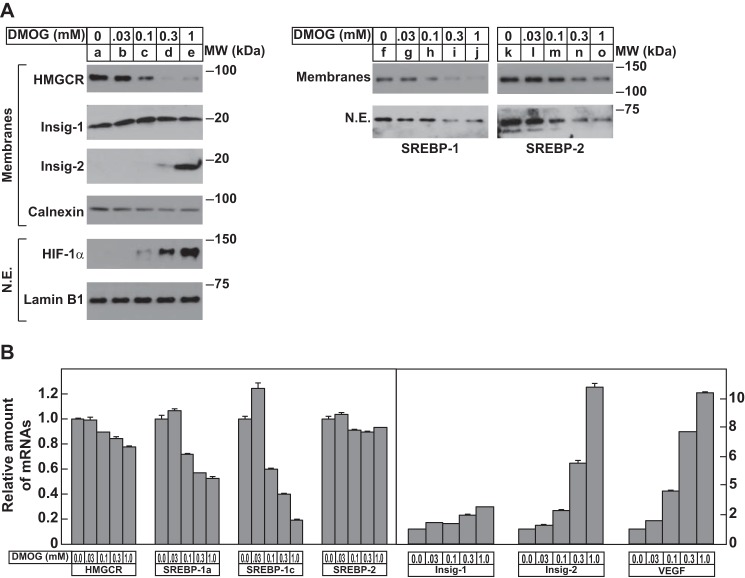
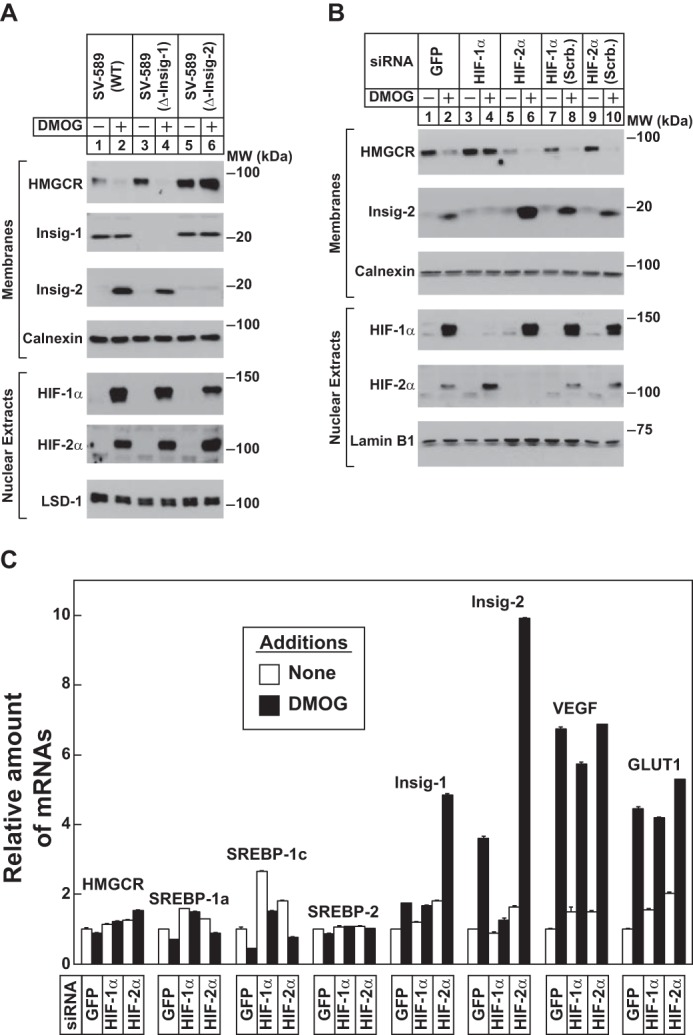
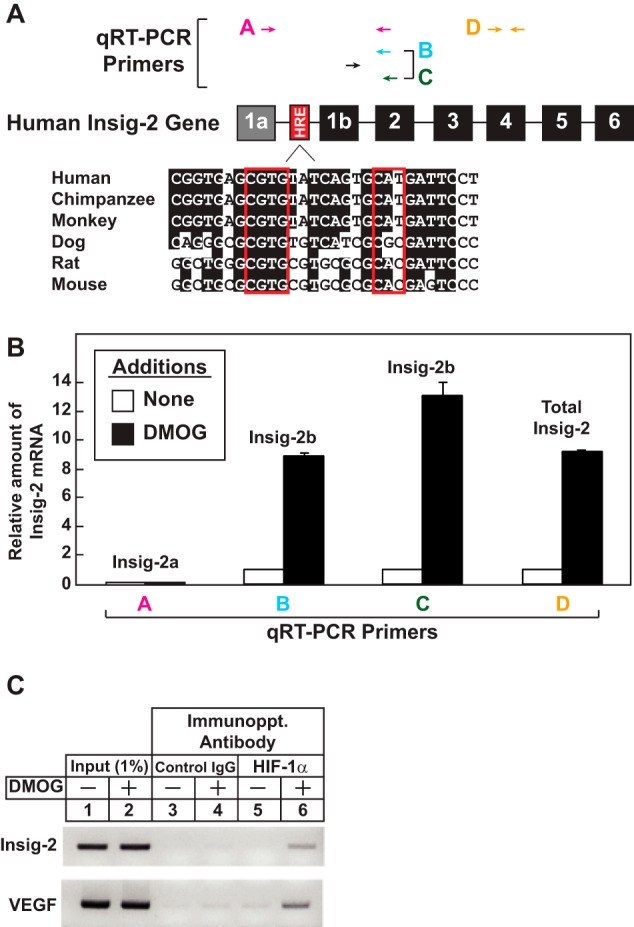
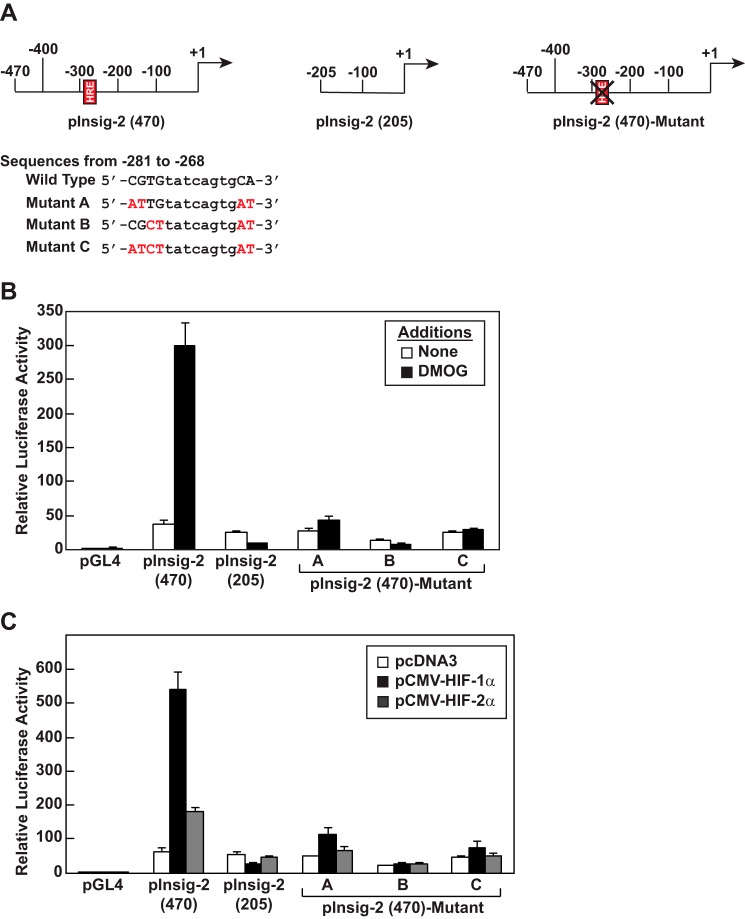
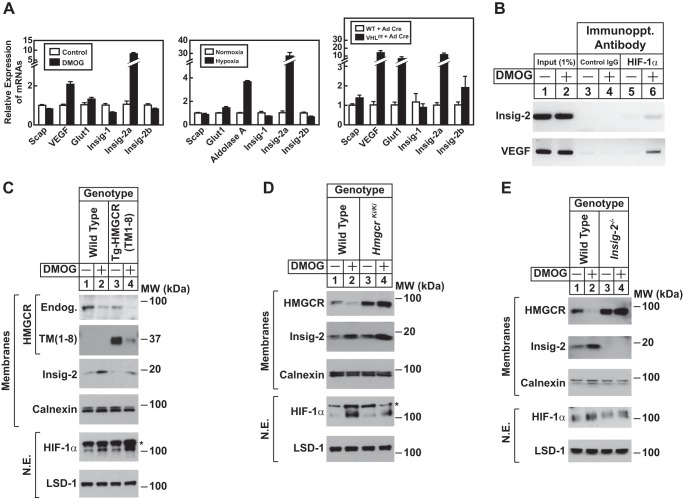
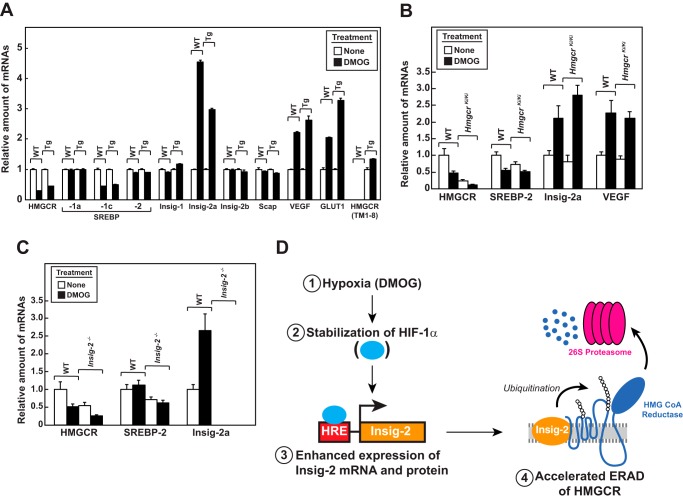
Cholesterol synthesis is a highly oxygen-consuming process. As such, oxygen deprivation (hypoxia) limits cholesterol synthesis through incompletely understood mechanisms mediated by the oxygen-sensitive transcription factor hypoxia-inducible factor 1α (HIF-1α). We show here that HIF-1α links pathways for oxygen sensing and feedback control of cholesterol synthesis in human fibroblasts by directly activating transcription of the INSIG-2 gene. Insig-2 is one of two endoplasmic reticulum membrane proteins that inhibit cholesterol synthesis by mediating sterol-induced ubiquitination and subsequent endoplasmic reticulum-associated degradation of the rate-limiting enzyme in the pathway, HMG-CoA reductase (HMGCR). Consistent with the results in cultured cells, hepatic levels of Insig-2 mRNA were enhanced in mouse models of hypoxia. Moreover, pharmacologic stabilization of HIF-1α in the liver stimulated HMGCR degradation via a reaction that requires the protein's prior ubiquitination and the presence of the Insig-2 protein. In summary, our results show that HIF-1α activates INSIG-2 transcription, leading to accumulation of Insig-2 protein, which binds to HMGCR and triggers its accelerated ubiquitination and degradation. These results indicate that HIF-mediated induction of Insig-2 and degradation of HMGCR are physiologically relevant events that guard against wasteful oxygen consumption and inappropriate cell growth during hypoxia.

Keywords: ER-associated degradation; cholesterol metabolism; endoplasmic reticulum (ER); hypoxia; isoprenoid.


Conflict of interest statement

The content is solely the responsibility of the authors and does not necessarily represent the official views of the National Institutes of Health

Figures

Figure 1.
Figure 1.
The cholesterol biosynthetic pathway in animal cells. The schematic of the cholesterol biosynthetic pathway is based on recent flux studies by Mitsche et al. (42). Reactions that require molecular oxygen are highlighted in red.
Figure 2.
Figure 2.
DMOG enhances expression of Insig-2 and suppresses HMGCR in SV-589 cells. A and B, SV-589 cells were set up on day 0 at 6.0 × 10⁵ cells/100-mm dish in medium A containing 10% FCS. On day 1, cells were switched to the identical medium with the indicated concentration of DMOG. Following incubation for 24 h at 37 °C, cells were harvested for subcellular fractionation (A) or isolation of total RNA (B) as described under “Experimental Procedures.” A, resulting membrane and nuclear extract (N.E.) fractions were subjected to SDS-PAGE (10–30 μg of total protein/lane), followed by immunoblot analysis with antibodies against HMGCR, Insig-1, Insig-2, calnexin, HIF-1α, Lamin B1, SREBP-1, and SREBP-2. MW, molecular weight. B, total RNA from each condition was subjected to quantitative RT-PCR using primers against the indicated gene; cyclophilin B mRNA was used as an invariant control. Each value represents the amount of mRNA relative to that in vehicle-treated cells, which is arbitrarily defined as 1. Error bars represent ± S.E. of triplicate samples.
Figure 3.
Figure 3.
DMOG suppresses HMGCR in SV-589 cells through a mechanism requiring HIF-1α and Insig-2. A, SV-589 (WT), SV-589 (ΔInsig-1), and SV-589 (ΔInsig-2) cells were set up on day 0 at 6.0 × 10⁵ cells/100-mm dish in medium A containing 10% FCS. On day 1, cells were switched to the identical medium in the absence or presence of 0.3 mm DMOG. Following incubation for 24 h at 37 °C, cells were harvested for subcellular fractionation. The resulting membrane and nuclear extract fractions were subjected to SDS-PAGE (10–30 μg total protein/lane), followed by immunoblot analysis with antibodies against HMGCR, Insig-1, Insig-2, calnexin, HIF-1α, HIF-1α, and LSD-1. MW, molecular weight. B and C, SV-589 cells were set up on day 0 at 2.5 × 10⁵ cells/100-mm dish in medium A containing 10% FCS. On day 1, cells were transfected with siRNAs targeting mRNAs encoding GFP, HIF-1α, and HIF-2α, as indicated and described under “Experimental Procedures.” Scrambled (Scrb.) HIF-1α and HIF-2αsiRNAs were used as additional negative controls. On day 2, cells were treated in the absence or presence of 0.3 mm DMOG for 24 h at 37 °C, after which they were harvested for subcellular fractionation (B) and total RNA isolation (C) as described under “Experimental Procedures.” B, aliquots of membrane and nuclear extract fractions (10–30 μg total protein/lane) were subjected to SDS-PAGE, followed by immunoblot analysis with antibodies against HMGCR, Insig-2, calnexin, HIF-1α, HIF-2α, and Lamin B1. C, total RNA from each condition was subjected to quantitative RT-PCR as described in the legend for Fig. 2B. Error bars denote ± S.E. of triplicate samples.
Figure 4.
Figure 4.
DMOG enhances binding of HIF-1α to HRE within intron 1 of the human INSIG-2 gene. A, schematic of the human Insig-2 gene, showing the location of exons and HRE (top panel) and conservation of the Insig-2 HRE sequence across species (bottom panel). Exons are indicated by boxes labeled with the corresponding exon numbers. The position of HRE conserved in mammalian species is indicated by a red box. Arrows denote the location of the primers used in the quantitative RT-PCR experiment shown in B. B, total RNA isolated from SV-589 cells treated with or without 1 mm DMOG for 24 h at 37 °C was subjected to quantitative RT-PCR as described in the legend to Fig. 2B using primer pairs A–D; cyclophilin B mRNA was used as an invariant control. Each value represents the amount of mRNA relative to that in untreated cells, which is arbitrarily defined as 1. Error bars represent the ± S.E. of triplicate samples. C, SV-589 cells were set up on day 0 at 1.0 × 10⁶ cells/150-mm dish in medium A containing 10% FCS. On day 1, cells were switched to the identical medium in the absence or presence of 1 mm DMOG. Following incubation for 24 h at 37 °C, cells were fixed with formalin. After the sheared chromatin was incubated with 4 μg of anti-HIF-1α IgG or control IgG, DNA was purified from each immunoprecipitate and subjected to PCR with primers that flank the HREs in the human Insig-2 or VEGF genes as described under “Experimental Procedures.” The resulting PCR products were visualized on an agarose gel by ethidium bromide staining. Immunoppt., immunoprecipitating.
Figure 5.
Figure 5.
DMOG treatment and HIF overexpression in SV-589 cells activate the human Insig-2 promoter through an HRE-dependent mechanism. A, schematic of pInsig-2 (470) encoding a fragment of intron 1 of the human Insig-2 gene containing the putative HRE (nucleotides −470 to +1 relative to the start site of transcription of the Insig-2 mRNA) linked to the pGL4 firefly luciferase reporter; pInsig-2 (205) contains the luciferase reporter linked to intronic sequences −205 to +1 (relative to the start site of transcription of the Insig-2 mRNA) of the Insig-2 gene, whereas pInsig-2 (470)-Mutant contains the luciferase reporter linked to the 470-nucleotide intronic fragment harboring various mutations within the putative HRE. The sequence of the wild-type and mutant HRE in the human Insig-2 promoter is shown, with mutated nucleotides highlighted in red (bottom panel). B and C, SV-589 cells were set up on day 0 at 4.5 × 10⁴ cells/well of a 6-well plate in medium A containing 10% FCS. B, on day 1, cells were transfected with Renilla luciferase and the indicated Insig-2 HRE-luciferase reporter plasmids as described under “Experimental Procedures.” Following incubation for 5 h at 37 °C, cells were switched to medium A containing 10% FCS in the absence or presence of 1 mm DMOG. After 24 h at 37 °C, cells were harvested, and luciferase activity was measured. Each value represents the amount of firefly luciferase activity normalized to Renilla luciferase activity relative to that in untreated cells transfected with pGL4, which is arbitrarily defined as 1. Error bars denote ± S.E. of three independent experiments. C, SV-589 cells were set up on day 0 and transfected on day 1 with Renilla luciferase and the Insig-2 HRE-luciferase reporter plasmids in the absence or presence of plasmids encoding non-degradable HIF-1α (pCMV-HIF-1α) or HIF-2α (pCMV-HIF-2α) as described in B. On day 2, cells were harvested, and luciferase activity was measured. Values represent firefly luciferase activity normalized to Renilla luciferase activity relative to that in mock-transfected cells, which is arbitrarily defined as 1. Error bars denote the mean ± S.E. of three independent experiments.
Figure 6.
Figure 6.
DMOG-induced expression of the Insig-2a transcript stimulates degradation of HMGCR in livers of mice. A, wild-type C57BL/6J male mice (8–11 weeks of age) were either administered 8 mg/day of DMOG in saline by oral gavage for 5 consecutive days or exposed to normoxia (21% O2) or hypoxia (6% O2) for 6 h as described under “Experimental Procedures.” Vhlf/f mice and wild-type littermates were injected with an adenovirus encoding for Cre recombinase driven by the CMV promoter. Mice were analyzed 4 days after injection. At the end of the treatment periods, the mice were sacrificed. RNA was isolated from the liver, and quantitative real-time PCR analysis was performed as described in the legend for Fig. 2. Each value represents the expression of the indicated gene relative to that in the control group. Data are presented as means ± S.E. (n = 3 for each group subjected to DMOG and hypoxia treatment; n = 6 for each group injected with adenovirus encoding Cre recombinase). B, ChIP assays were performed with livers from male C57BL/6J mice administered intraperitoneal DMOG (8 mg) or saline once daily for 3 days. Four hours after the final injection, liver tissues were fixed with formalin and subjected to ChIP assays using primers that flank HRE in the mouse Insig-2 or VEGF genes as described under “Experimental Procedures.” Immunoppt., immunoprecipitating. C–E, male mice (8–11 weeks of age, 4–6 mice/group) of the indicated genotypes were injected intraperitoneally with DMOG (8 mg) or saline once daily for 3 days. Mice were sacrificed 6 h following the third injection, and livers were harvested for subcellular fractionation as described under “Experimental Procedures.” Aliquots of membrane and nuclear extract (N.E.) fractions (20–50 μg of total protein/lane) for each group were pooled and subjected to immunoblot analysis using anti-T7 IgG (against HMGCR (TM1–8)) and antibodies against endogenous (Endog.) HMGCR, Insig-2, calnexin, HIF-1α, and LSD-1. The asterisks in the HIF-1α blot denote a cross-reactive nonspecific band. MW, molecular weight.
Figure 7.
Figure 7.
DMOG modulates the expression of mRNAs encoding components of the Scap-SREBP pathway in livers of mice. A–C, control and Tg-HMGCR (TM1–8) (A), HmgcrKi/Ki (B), or Insig-2−/− (C) mice (the same as used for Fig. 6, C–E) were administered intraperitoneal saline in the absence or presence of DMOG (8 mg) once daily for 3 days. Mice were sacrificed 6 h after the third injection, and livers were harvested for total RNA isolation. A, total RNA from each tissue was subjected to quantitative PCR using primers for the indicated mRNAs; apoB mRNA was used as an invariant control. Each value represents the amount of mRNA relative to that in the wild type administered saline, which is arbitrarily defined as 1. Error bars show the mean ± S.E. of triplicate samples. B and C, equal amounts of RNA from individual mice were subjected to quantitative RT-PCR using primers against the indicated gene; apoB mRNA was used as an invariant control. Each value represents the amount of mRNA relative to that in the wild type administered saline, which is arbitrarily defined as 1. Error bars denote ± S.E. of four to six individual mice. D, proposed model for HIF-mediated regulation of HMGCR degradation.

Similar articles

Cited by

References

    1. Goldstein J. L., DeBose-Boyd R. A., and Brown M. S. (2006) Protein sensors for membrane sterols. Cell 124, 35–46 - PubMed
    1. Sever N., Song B. L., Yabe D., Goldstein J. L., Brown M. S., and DeBose-Boyd R. A. (2003) Insig-dependent ubiquitination and degradation of mammalian 3-hydroxy-3-methylglutaryl-CoA reductase stimulated by sterols and geranylgeraniol. J. Biol. Chem. 278, 52479–52490 - PubMed
    1. Sever N., Yang T., Brown M. S., Goldstein J. L., and DeBose-Boyd R. A. (2003) Accelerated degradation of HMG CoA reductase mediated by binding of insig-1 to its sterol-sensing domain. Mol. Cell 11, 25–33 - PubMed
    1. Song B. L., Javitt N. B., and DeBose-Boyd R. A. (2005) Insig-mediated degradation of HMG CoA reductase stimulated by lanosterol, an intermediate in the synthesis of cholesterol. Cell Metab. 1, 179–189 - PubMed
    1. Nguyen A. D., Lee S. H., and DeBose-Boyd R. A. (2009) Insig-mediated, sterol-accelerated degradation of the membrane domain of hamster 3-hydroxy-3-methylglutaryl-coenzyme A reductase in insect cells. J. Biol. Chem. 284, 26778–26788 - PMC - PubMed

Publication types

MeSH terms

Substances

LinkOut - more resources