. 2017 May 1;214(5):1471-1491.
doi: 10.1084/jem.20161149. Epub 2017 Apr 17.

Epigenetic regulator CXXC5 recruits DNA demethylase Tet2 to regulate TLR7/9-elicited IFN response in pDCs

Affiliations

Epigenetic regulator CXXC5 recruits DNA demethylase Tet2 to regulate TLR7/9-elicited IFN response in pDCs

Shixin Ma et al. J Exp Med. .

Abstract

TLR7/9 signals are capable of mounting massive interferon (IFN) response in plasmacytoid dendritic cells (pDCs) immediately after viral infection, yet the involvement of epigenetic regulation in this process has not been documented. Here, we report that zinc finger CXXC family epigenetic regulator CXXC5 is highly expressed in pDCs, where it plays a crucial role in TLR7/9- and virus-induced IFN response. Notably, genetic ablation of CXXC5 resulted in aberrant methylation of the CpG-containing island (CGI) within the Irf7 gene and impaired IRF7 expression in steady-state pDCs. Mechanistically, CXXC5 is responsible for the recruitment of DNA demethylase Tet2 to maintain the hypomethylation of a subset of CGIs, a process coincident with active histone modifications and constitutive transcription of these CGI-containing genes. Consequently, CXXC5-deficient mice had compromised early IFN response and became highly vulnerable to infection by herpes simplex virus and vesicular stomatitis virus. Together, our results identify CXXC5 as a novel epigenetic regulator for pDC-mediated antiviral response.


Figures

Figure 1.
Figure 1.
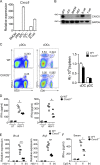
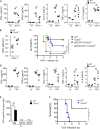
Expression and function of CXXC5 in pDCs. (A) Total mRNAs were extracted from BMDMs, thioglycolate-elicited peritoneal macrophages, Flt3L-differentiated pDCs, GM-CSF–differentiated BMDCs (cDCs), and splenic T and B cells isolated by anti-CD3 or anti-CD19 microbeads, respectively. The relative expression of Cxxc5 over Gapdh was measured by real-time PCR, and the data are presented as mean ± SD. This experiment was conducted twice with similar results. (B) Whole-cell lysates were prepared from Flt3L-pDCs, GM-CSF–cDCs, BMDMs, MEFs, splenic T cells, and B cells, and Western blotting was conducted with anti-CXXC5 antibody. This experiment was conducted twice with similar results. (C) Percentage of cDCs (CD11chi, gated on B220CD3 cells) and pDCs (B220+PDCA1+CD11cint) in spleens was analyzed by flow cytometry, and total numbers of cDCs and pDCs were counted. This experiment was repeated three times, and similar results were obtained. The data are presented as mean ± SD. (D) Splenic pDCs (106 cells/ml) purified from WT and CXXC5−/− mice (n = 4) were infected with HSV-1 for 24 h. Production of IFNα/β was measured by ELISA. This experiment was repeated twice, and representative data (mean ± SD) are shown (*, P < 0.05, analyzed by Student’s t test). (E) WT and CXXC5−/− mice (n = 6) were either uninfected or i.v. infected with HSV-1 (5 × 10⁶ pfu/mouse) for 9 h, and splenocytes were sorted by FACS. Total mRNA was prepared from 105 pDCs (CD11cintB220+/PDCA1+/Siglec-Hhi) and quantified by real-time PCR. This experiment was repeated twice, and representative data are shown (***, P < 0.001, analyzed by Student’s t test). (F) WT and CXXC5−/− mice (n = 3) were either untreated or treated with i.v. injection of 20 µg CpG-A (complexed with 30 µg DOTAP) for 6 h, and sera were collected for ELISA. This experiment was performed three times with similar results (*, P < 0.05, analyzed by Student’s t test).
Figure 2.
Figure 2.
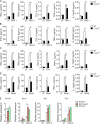
Virus- and TLR7/9-induced gene expression in WT and CXXC5−/− pDCs. (A–D) 2 × 10⁵ Flt3L-differentiated BM-derived pDCs (CD11cintB220+CD11b) sorted by FACS were either untreated (UT) or treated with HSV-1 (MOI: 1; A), CpG-A (2 µg/ml; B), VSV (MOI: 1; C), or R848 (1 µg/ml; D) for 24 h, and the supernatants (n = 3) were collected for ELISA. These experiments were conducted three times, and representative data (mean ± SD) are shown (*, P < 0.05; **, P < 0.01; ***, P < 0.001, analyzed by Student’s t test). (E) WT and CXXC5−/− (KO) Flt3L-pDCs transduced by lentiviral vector or CXXC5-expressing lentiviruses were sorted as GFP-positive cells by FACS and treated with CpG-A (2 µg/ml) for 6 h. Expression levels of Ifnα/β and Tnfα mRNAs were quantified by real-time PCR, and the data are presented as mean ± SD. This experiment was repeated twice with similar results (*, P < 0.05; **, P < 0.01; ***, P < 0.001, analyzed by Student’s t test).
Figure 3.
Figure 3.
Effects of CXXC5 on CpG-B– and LPS-induced signaling in various immune cell populations. (A–D) Flt3L-pDCs (106/ml), splenic B cells (107/ml, purified by anti-CD19 microbeads), GM-CSF–BMDCs (cDCs, 106/ml), and BMDMs (106/ml) were stimulated by CpG-B (100 nM) for 24 h, and supernatants (n = 3) were collected for ELISA. These experiments were conducted three times, and the data are presented as mean ± SD (*, P < 0.05; ***, P < 0.001, by Student’s t test). (E) Splenic B cells (107/ml) were either untreated (UT) or treated with LPS (5 µg/ml) for 48 h, and secreted cytokines were measured by ELISA. This experiment was conducted twice with similar results, and the data are presented as mean ± SD (**, P < 0.01; ***, P < 0.001, by Student’s t test). (F) BMDCs (cDCs; 106/ml) were either untreated or treated with LPS (100 ng/ml) for 4 h, and the induction of Ifnα/β, chemokine, and cytokine mRNAs was analyzed by real-time PCR. This experiment was repeated once, and the data are presented as mean ± SD. (G) Flt3L-differentiated pDCs from WT and CXXC5−/− mice were stimulated with CpG-B (100 nM) for various times. Cell lysates were resolved by 10% SDS-PAGE and probed with the indicated antibodies. This experiment was repeated twice. (H and I) Flt3L-pDCs were stimulated with CpG-B (100 nM) for 2 h, and splenic B cells were treated with LPS (5 µg/ml) or CpG-B (150 nM) for 2 h. After cross-linking and FACS sorting, cell lysates were prepared and immunoprecipitated with 2 µg anti-p65. Immunoprecipitated promoters of proinflammatory genes were measured by real-time PCR and quantified over respective inputs (n = 4). These experiments were repeated twice, and representative data (mean ± SD) are shown (*, P < 0.05; **, P < 0.01; ***, P < 0.001, analyzed by Student’s t test).
Figure 4.
Figure 4.
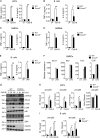
Impact of CXXC5 on CpG-A–induced TLR9 signaling in pDCs. (A and B) Flt3L-differentiated pDCs from WT and CXXC5−/− mice were stimulated with CpG-A (2 µg/ml) for various times. Cell lysates were resolved by 10% SDS-PAGE and probed with the indicated antibodies. These experiments were repeated twice with similar results. (C and D) Flt3L-differentiated pDCs were stimulated with CpG-A (ODN1585; 2 µg/ml) or IFNβ (100 U/ml) for various times (C), and human pDCs sorted from PBMCs of eight healthy individuals were treated with R837 (20 µg/ml) or CpG-A (ODN2216; 1 µM) for 24 h (D). These experiments were repeated twice, and expression levels of Cxxc5 were analyzed by real-time PCR (mean ± SD; ***, P < 0.001). (E) Flt3L-differentiated pDCs were either untreated (UT) or treated with CpG-A (2 µg/ml) for 5 h. Cells were fixed with paraformaldehyde and stained with anti-IRF7 antibodies (red) and DAPI (blue) sequentially. This experiment was repeated twice, and images were collected by a laser capture confocal microscope. Bars: (top) 10 µm; (bottom) 2 µm. (F and G) Flt3L-differentiated pDCs were either untreated or treated with CpG-A (2 µg/ml) for 2 h and cross-linked with paraformaldehyde. pDCs sorted by FACS were lysed for ChIP by anti-IRF7 (3 µg; F) or anti-H4ac, anti-H3K4me3, and anti-H3K27ac (1 µg; G). Immunoprecipitated Ifnα4 and Ifnβ promoter DNA fragments were measured by real-time PCR and quantified over respective inputs. These experiments were repeated twice, and data (n = 3, mean ± SD) were analyzed by Student’s t test (*, P < 0.05; **, P < 0.01; ***, P < 0.001).
Figure 5.
Figure 5.
CXXC5-regulated gene expression in pDCs. (A) Graphic presentation of three groups of genes that were down-regulated >1.5-fold in CXXC5−/− pDCs compared with WT pDCs by microarray analysis. The relative expression of each gene in four different groups is presented as log2 value. (B) Validation of subsets of genes differentially expressed in WT and CXXC5−/− pDCs by real-time PCR. This experiment was conducted twice, and data (mean ± SD) were analyzed by Student’s t test (**, P < 0.01; ***, P < 0.001). (C) Cell lysates were prepared from Flt3L-differentiated WT and CXXC5−/− (KO) pDCs, and Western blotting was conducted to detect the expression of transcriptional factors. This experiment was repeated twice with similar results. (D) Flt3-pDCs were either untreated (UT) or treated with CpG-A (2 µg/ml) for 6 h, and gene expression was analyzed by real-time PCR. This experiment was conducted twice (n = 3), and the data are presented as mean ± SD.
Figure 6.
Figure 6.
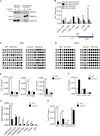
Epigenetic modifications on the CpG island of Irf7 gene. (A) Flt3-pDCs were either untreated or treated with CpG-A (2 µg/ml) for 3 h, and nuclear versus cytoplasmic distribution of CXXC5 was analyzed by Western blotting. This experiment was repeated twice with similar results. (B) Cell lysates from Flt3L-differentiated WT and CXXC5−/− (KO) pDCs were cross-linked and immunoprecipitated with anti-CXXC5. The enrichment of various regions of Irf7 promoter was measured by real-time PCR and quantified over respective inputs. This experiment was repeated three times, and data (n = 4, mean ± SD) were analyzed by Student’s t test (**, P < 0.01). TSS, transcription start site. (C and D) 500 ng genomic DNA from Flt3L-pDCs (C) and GM-CSF–cDCs (D) generated from WT and CXXC5−/− mice were treated with sodium bisulfite, and the CGI region of Irf7 (500–1,000) was amplified by PCR and sequenced (n = 10). This experiment was conducted twice. (E) Flt3L-differentiated pDCs were cross-linked and sonicated, and chromatin fragments were immunoprecipitated with 5hmC antibodies. 5hmC levels at the promoter region of Irf7, Cxcl2, and Tnfα were quantified by real-time PCR (n = 3). This experiment was repeated once, and the data are presented as mean ± SD (***, P < 0.001). (F–H) Enrichment of Ezh2 and Sin3a and histone modifications in Irf7 CGI (500–1,000; F and G) and enrichment of pol II at the promoter region of Irf7, Tnfα, and Cxcl2 (H) in pDCs were quantified by real-time PCR (n = 3). These experiments were repeated twice with similar results (data were analyzed by Student’s t test and are presented as mean ± SD; *, P < 0.05; **, P < 0.01; ***, P < 0.001).
Figure 7.
Figure 7.
CXXC5 recruits Tet2 to regulate the methylation of Irf7 CGI in pDCs. (A) Cell lysates were prepared from WT and CXXC5−/− Flt3L-pDCs and immunoprecipitated (IP) with anti-CXXC5 antibody. The immunoprecipitates and inputs were blotted by anti-Tet2 and anti-CXXC5, respectively. This experiment was repeated once. (B) Whole-cell lysates from Flt3L-differentiated WT and CXXC5−/− (KO) pDCs were cross-linked and immunoprecipitated by control IgG or anti-Tet2. Enrichment of Tet2 on various regions of Irf7 promoter was determined by real-time PCR (n = 3). This experiment was repeated three times, and data (mean ± SD) were analyzed by Student’s t test (**, P < 0.01). (C) Genomic DNA from WT and Tet2−/− Flt3L-pDCs were treated with sodium bisulfite, and the CGI region of Irf7 (500–1,000) was amplified by PCR and sequenced (n = 10). This experiment was conducted twice. (D and E) Flt3L-differentiated pDCs were cross-linked and subjected to ChIP with the indicated antibodies. Histone modifications (D) and enrichment of Ezh2 and Sin3a (E) in Irf7 CGI (500–1,000) were quantified by real-time PCR (n = 3). These experiments were repeated twice, and data were analyzed by Student’s t test and are presented as mean ± SD (*, P < 0.05; ***, P < 0.001). (F) Whole-cell lysates from Flt3L-differentiated WT and Tet2−/− pDCs were resolved by 10% SDS-PAGE and probed with anti-IRF7 and anti-Tet2, respectively. This experiment was repeated once with similar results. (G and H) Flt3L-differentiated pDCs were cross-linked and sonicated, and chromatin fragments were immunoprecipitated with the indicated antibodies. 5hmC levels (G) and pol II enrichment (H) at the promoter regions of Irf7, Cxcl2, and Tnfα were quantified by real-time PCR (n = 3). These experiments were repeated twice with similar results (*, P < 0.05; **, P < 0.01; ***, P < 0.001, analyzed by Student’s t test and are presented as mean ± SD).
Figure 8.
Figure 8.
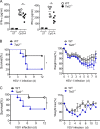
CXXC5−/− mice are vulnerable to viral infection in vivo. (A and B) 6–8-wk-old WT and CXXC5−/− littermates (n = 4) were intravenously infected with HSV-1 (5 × 10⁶ pfu/mouse). The sera were collected at 6 h for ELISA (A) or at 24 h for plaque assay (B). These experiments were repeated three times, and data were analyzed by Student’s t test and are presented as mean ± SD (*, P < 0.05; **, P < 0.01; ns, not significant). (C) 6–8-wk-old WT and CXXC5−/− littermates (n = 10) or CXXC5−/− mice (n = 10) adoptively transferred with 1.2 × 10⁶ Flt3L-pDCs were i.v. infected with HSV-1 (5 × 10⁶ pfu/mouse) and monitored every 12 h for survival (**, P < 0.01; ***, P < 0.01; ns, not significant, log-rank [Mantel–Cox] test). (D–F) 6–8-wk-old WT and CXXC5−/− littermates (n = 5) were intravenously infected with VSV (5 × 10⁶ pfu/mouse). Sera were collected 6 h (D) or 3 d (E) after infection for ELISA, and survival was monitored every 12 h (F). These experiments were repeated once with similar results, and data were analyzed by Student’s t test and are presented as mean ± SD (D and E) or log-rank (Mantel-Cox) test (F; *, P < 0.05; **, P < 0.01; ns, not significant).
Figure 9.
Figure 9.
Tet2−/− mice are susceptible to viral infection in vivo. (A) 105 splenic pDCs sorted from WT and Tet2−/− mice were stimulated by CpG-A (2 µg/ml) for 48 h, and supernatants were collected for ELISA (n = 6). This experiment was conducted three times, and data were analyzed by Student’s t test and are presented as mean ± SD (*, P < 0.05). UT, untreated. (B) 8-wk-old WT (n = 8) and Tet2−/− (n = 14) littermates were intravenously infected with HSV-1 (5 × 10⁶ pfu) and monitored every 12 h for mortality and morbidity. This experiment was conducted twice, and log-rank (Mantel-Cox) test was used for statistical analysis (*, P < 0.05). (C) 8-wk-old WT and Tet2−/− littermates (n = 9) were intravenously infected with VSV (5 × 10⁶ pfu) and monitored every 12 h for survival and weight loss. This experiment was conducted twice, and log-rank (Mantel-Cox) test was used for statistical analysis (data are presented as mean ± SD; *, P < 0.05).
Figure 10.
Figure 10.
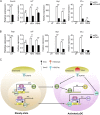
CXXC5 and Tet2 regulate IFN production in human pDCs. (A and B) Control and CXXC5- or Tet2-knockdown Gen2.2 cells were stimulated by HSV-1 (MOI: 2) or R848 (1 µg/ml) for 4 h, and expression of IRF7 and IFNα/β was analyzed by real-time PCR (n = 4). These experiments were repeated twice, and data shown as mean ± SD were analyzed by Student’s t test (**, P < 0.01; ***, P < 0.001). UT, untreated. (C) In light of our data presented here, we propose that CXXC5 may function as an epigenetic reader for hypomethylated CpG islands and work in concert with Tet2 to regulate gene expression in pDCs. By impacting DNA methylation and the ensuing histone modifications, CXXC5 not only promotes constitutive expression of the CGI-containing transcriptional factors (such as IRF7), but also opens up the proinflammatory gene promoters (such as Tnfα), thereby priming pDCs for TLR7/9-induced IFN and proinflammatory responses.

Similar articles

Cited by

References

    1. Andersson T., Södersten E., Duckworth J.K., Cascante A., Fritz N., Sacchetti P., Cervenka I., Bryja V., and Hermanson O.. 2009. CXXC5 is a novel BMP4-regulated modulator of Wnt signaling in neural stem cells. J. Biol. Chem. 284:3672–3681. 10.1074/jbc.M808119200 - DOI - PubMed
    1. Bach P., Kamphuis E., Odermatt B., Sutter G., Buchholz C.J., and Kalinke U.. 2007. Vesicular stomatitis virus glycoprotein displaying retrovirus-like particles induce a type I IFN receptor-dependent switch to neutralizing IgG antibodies. J. Immunol. 178:5839–5847. 10.4049/jimmunol.178.9.5839 - DOI - PubMed
    1. Barozzi I., Simonatto M., Bonifacio S., Yang L., Rohs R., Ghisletti S., and Natoli G.. 2014. Coregulation of transcription factor binding and nucleosome occupancy through DNA features of mammalian enhancers. Mol. Cell. 54:844–857. 10.1016/j.molcel.2014.04.006 - DOI - PMC - PubMed
    1. Blackledge N.P., and Klose R.. 2011. CpG island chromatin: A platform for gene regulation. Epigenetics. 6:147–152. 10.4161/epi.6.2.13640 - DOI - PMC - PubMed
    1. Blackledge N.P., Thomson J.P., and Skene P.J.. 2013. CpG island chromatin is shaped by recruitment of ZF-CxxC proteins. Cold Spring Harb. Perspect. Biol. 5:a018648 10.1101/cshperspect.a018648 - DOI - PMC - PubMed

MeSH terms