. 2017 May 23;114(21):5373-5377.
doi: 10.1073/pnas.1616426114. Epub 2017 Apr 17.

Role of atmospheric oxidation in recent methane growth

Affiliations

Role of atmospheric oxidation in recent methane growth

Matthew Rigby et al. Proc Natl Acad Sci U S A. .

Abstract

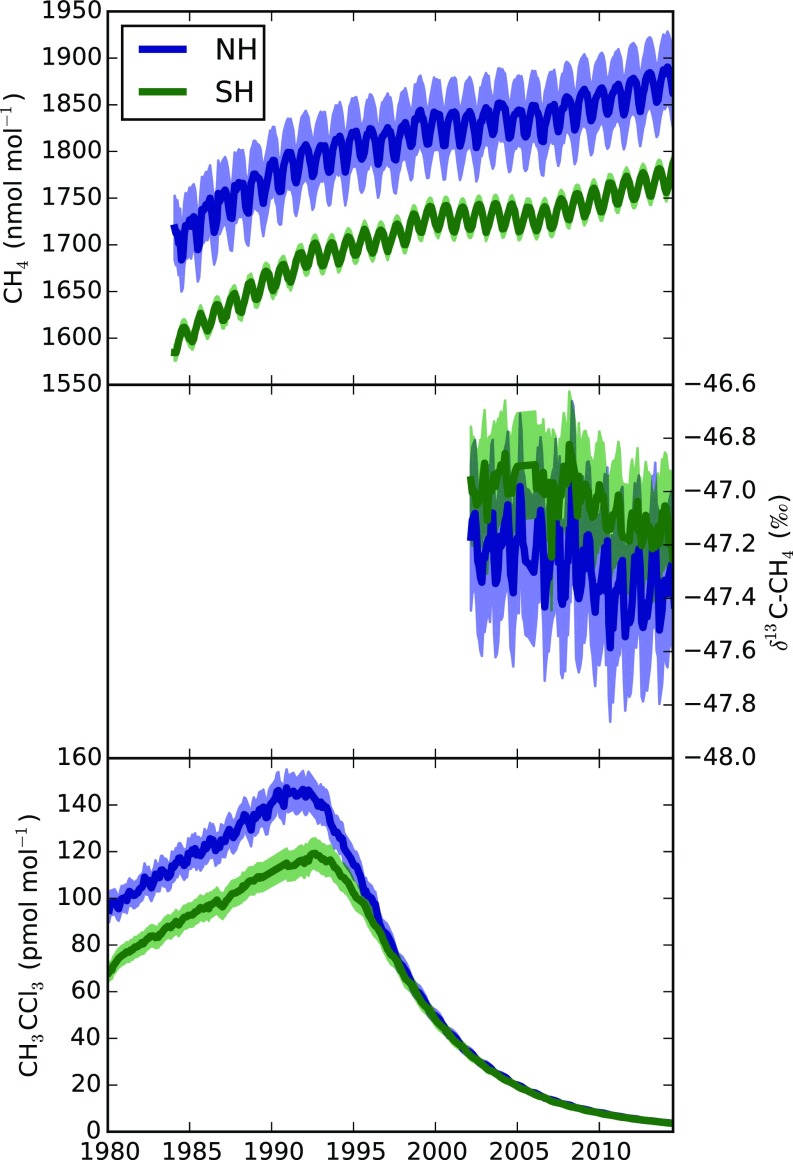
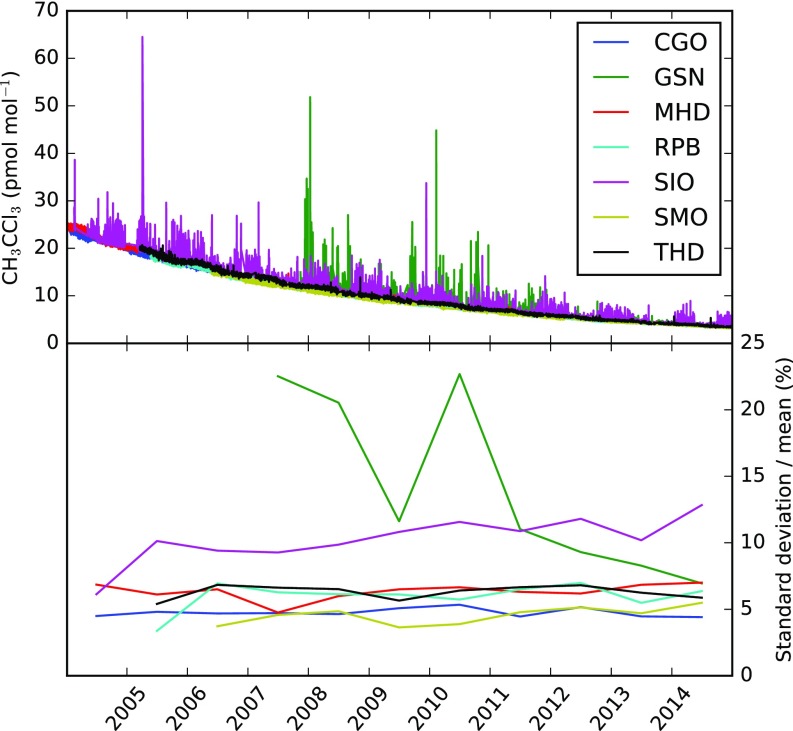
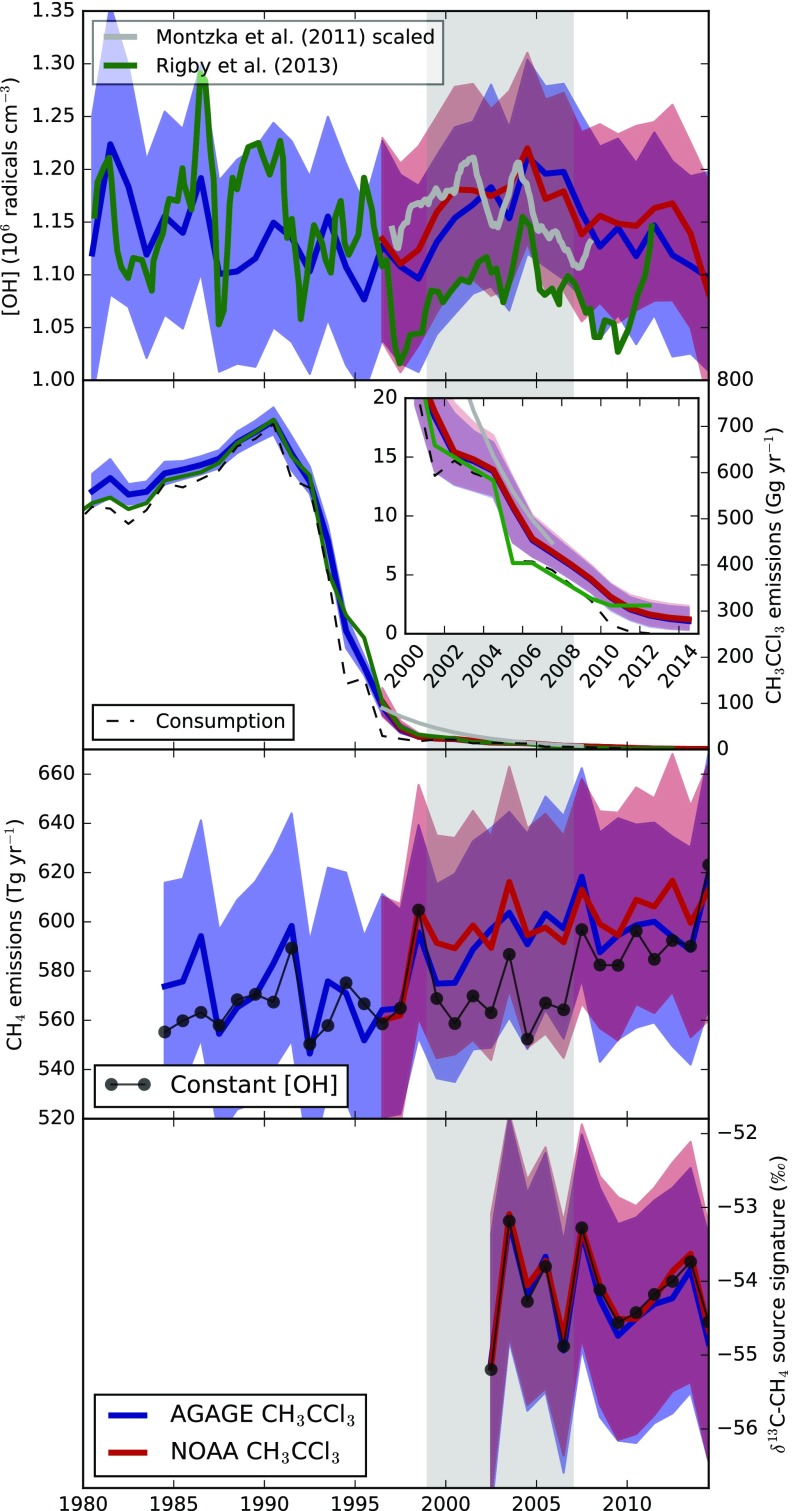
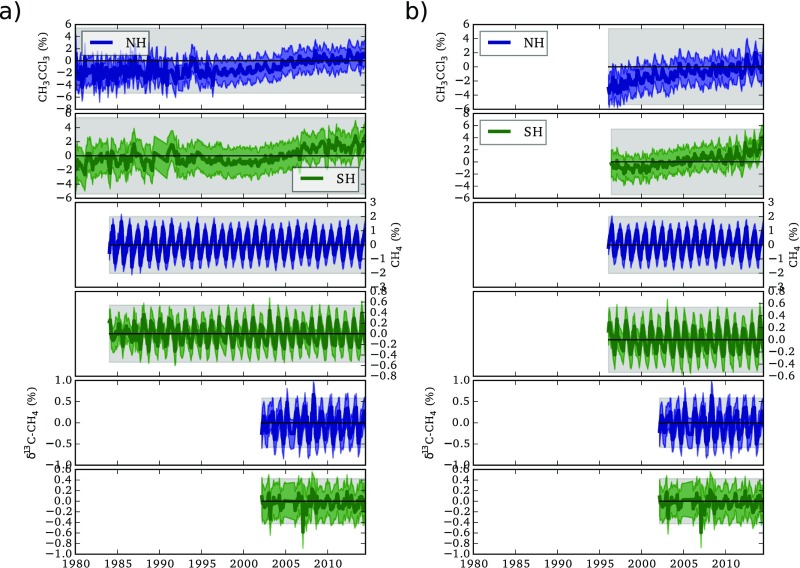
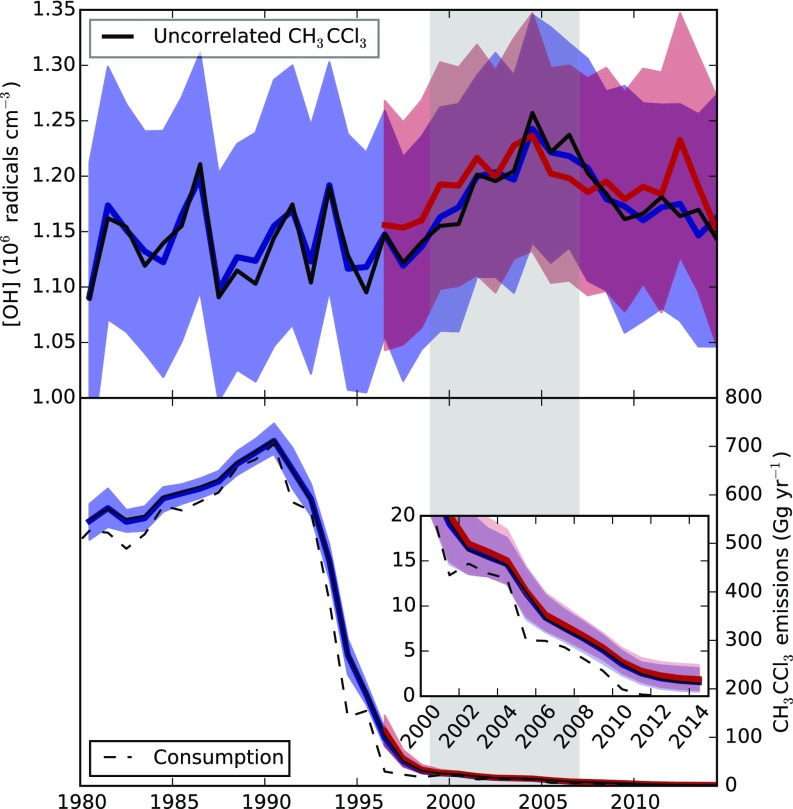
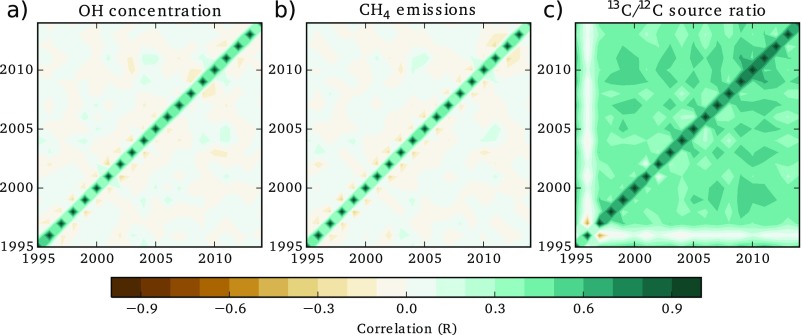
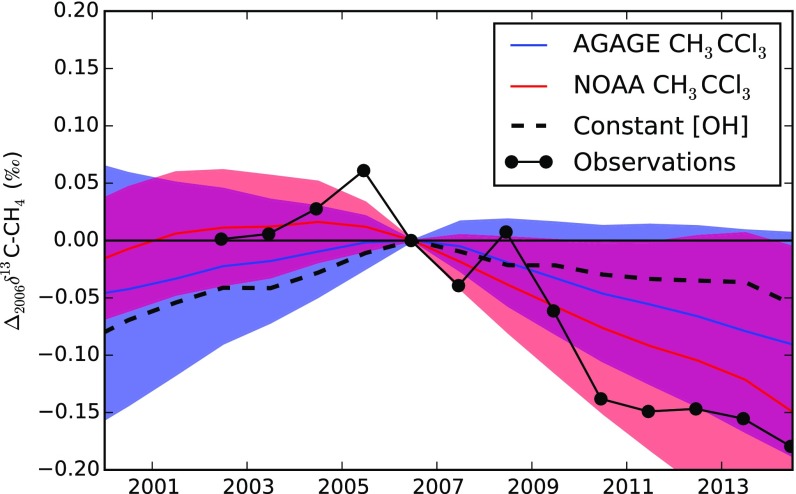
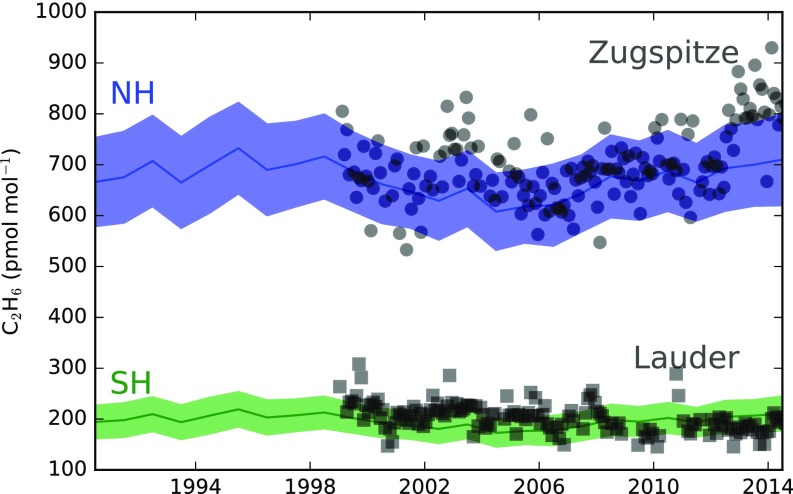
The growth in global methane (CH4) concentration, which had been ongoing since the industrial revolution, stalled around the year 2000 before resuming globally in 2007. We evaluate the role of the hydroxyl radical (OH), the major CH4 sink, in the recent CH4 growth. We also examine the influence of systematic uncertainties in OH concentrations on CH4 emissions inferred from atmospheric observations. We use observations of 1,1,1-trichloroethane (CH3CCl3), which is lost primarily through reaction with OH, to estimate OH levels as well as CH3CC3 emissions, which have uncertainty that previously limited the accuracy of OH estimates. We find a 64-70% probability that a decline in OH has contributed to the post-2007 methane rise. Our median solution suggests that CH4 emissions increased relatively steadily during the late 1990s and early 2000s, after which growth was more modest. This solution obviates the need for a sudden statistically significant change in total CH4 emissions around the year 2007 to explain the atmospheric observations and can explain some of the decline in the atmospheric 13CH4/12CH4 ratio and the recent growth in C2H6 Our approach indicates that significant OH-related uncertainties in the CH4 budget remain, and we find that it is not possible to implicate, with a high degree of confidence, rapid global CH4 emissions changes as the primary driver of recent trends when our inferred OH trends and these uncertainties are considered.

Keywords: 1,1,1-trichloroethane; hydroxyl; inversion; methane; methyl chloroform.


Conflict of interest statement

The authors declare no conflict of interest.

Figures

Fig. 1.
Fig. 1.
(Top) NOAA observations of CH4. (Middle) INSTAAR observations of δ13C-CH4. (Bottom) The AGAGE observations of CH3CCl3. Each plot shows the northern hemisphere (NH) and southern hemisphere (SH) means, and shading indicates the assumed 1-sigma model and measurement uncertainty as defined in SI Materials and Methods.
Fig. S1.
Fig. S1.
(Upper) High-frequency AGAGE Medusa observations at the baseline stations used in the global inversion in addition to; Scripps Institution of Oceanography, La Jolla, CA (SIO); and Gosan, South Korea (GSN). (Lower) Annual SDs relative to the annual mean mole fraction. CGO, Cape Grim, Tasmania; MHD, Mace Head, Ireland; RPB, Ragged Point, Barbados; SMO, Cape Matatula, Samoa; THD, Trinidad Head, CA.
Fig. S2.
Fig. S2.
Percentage difference in the AGAGE and NOAA baseline monthly means at four colocated sites for (A) CH3CCl3 and (B) CH4. CGO, Cape Grim, Tasmania; MHD, Mace Head, Ireland; SMO, Cape Matatula, Samoa; THD, Trinidad Head, CA.
Fig. 2.
Fig. 2.
(Row 1) Inferred tropospheric annual mean OH concentration. (Row 2) Global CH3CCl3 emissions. (Row 3) Global CH4 emissions. (Row 4) Global 13C/12C source isotope ratio of CH4. The blue lines and shading show quantities inferred when AGAGE CH3CCl3 data were used, and the red lines and shading show those inferred using NOAA CH3CCl3 data. Lines indicate the medians, and the shading shows the 16th to 84th percentiles (∼±1 sigma). The green and gray lines in rows 1 and 2 show estimates from previous studies that used the same observations but different methodologies and emissions (13, 24). Inset in row 2 zooms in on the CH3CCl3 emissions from 2000 to 2014. The black lines in rows 3 and 4 show the methane and isotopologue changes inferred when interannually repeating OH was used. The gray shading shows the approximate start and end of the methane pause. Numerical values of the quantities in this figure are available in Dataset S1.
Fig. S3.
Fig. S3.
Percentage difference between modeled and observed mole fractions (model/data) for CH3CCl3, NOAA CH4, and INSTAAR δ13C-CH4 for (A) the AGAGE CH3CCl3 inversion and (B) the NOAA CH3CCl3 inversion. Gray shading indicates the diagonal elements of the model representation uncertainty covariance matrix (1 sigma). Blue lines show the median northern hemisphere (NH) mole fraction, and green lines show the southern hemisphere (SH) mole fraction. The blue and green shading shows the 1-sigma uncertainty in the a posteriori mole fractions. A seasonal cycle is apparent in the CH4 and δ13C-CH4 residual. This finding is because we have assumed that CH4 emissions have no seasonal cycle, which is a clear oversimplification but one that we do not expect to have any impact on our results concerning quantities derived on timescales of at least 1 y. The figure also shows a (nonstatistically significant) trend in the CH3CCl3 residual, which is not inconsistent with the observations, because we have included off-diagonal terms in our representation uncertainty covariance that allow for multiyear trends of the order of a few percent. Therefore, the a posteriori uncertainties in OH and other quantities will be consistent with potential drifts in the atmospheric CH3CCl3 data, such as those shown in the figure. Fig. S4 shows the outcome of an inversion performed with this correlation-length scale set to zero and that it has little major impact on the median solution. In this solution, the “drift” between the observations and the posterior model is negligible.
Fig. S4.
Fig. S4.
Outcome of inversion using CH3CCl3 data alone from either the AGAGE network (blue) or NOAA network (red). Upper shows the derived OH concentration, and Lower shows the derived CH3CCl3 emissions. Shading indicates the 16th and 84th percentile range, and the solid lines show the medians. The black lines show the AGAGE-only inversion with an assumed zero temporal correlation-length scale in the model mismatch uncertainty, which removes the long-term drift in the model data residual (Fig. S3). Inset shows CH3CCl3 emissions from 2000 to 2014.
Fig. S5.
Fig. S5.
Correlation matrices for three annually derived quantities: (A) OH concentrations, (B) CH4 emissions, and (C) 13C/12C source ratios. The figure shows relatively small autocorrelation for OH and CH4 but significant off-diagonal elements for the source signature, indicating that estimates of the source signature in any 1 y are significantly correlated with surrounding years.
Fig. S6.
Fig. S6.
Simulation of the change in global δ13C-CH4 relative to 2006 based on varying OH concentrations from the AGAGE and NOAA inversions (blue and red, respectively), with total CH4 emissions and its source 13C/12C ratio held fixed and varying CH4 emissions from the “constant OH” inversion with the source 13C/12C ratio held constant (dashed line). The black points indicate the observed global mean δ13C-CH4. Each of these signals is a transient response in the model. Over timescales on the order of decades, δ13C-CH4 returns to the values before any perturbations in either the OH concentration or the bulk emissions [similar behavior and response timescales were noted previously (29, 61)].
Fig. S7.
Fig. S7.
Constant emission simulation of northern hemisphere (NH) and southern hemisphere (SH) ethane (blue and green, respectively) based on OH concentrations from the AGAGE CH3CCl3 simulation (blue). The gray data points are previously published deseasonalized column-averaged observations from Zugspitze (45° N, 11° E) and Lauder (45° S, 170° E) (5).

Comment in

References

    1. Kirschke S, et al. Three decades of global methane sources and sinks. Nat Geosci. 2013;6:813–823.
    1. Dlugokencky EJ, et al. Atmospheric methane levels off: Temporary pause or a new steady-state? Geophys Res Lett. 2003;30:3–6.
    1. Rigby M, et al. Renewed growth of atmospheric methane. Geophys Res Lett. 2008;35:L22805.
    1. Dlugokencky EJ, et al. Observational constraints on recent increases in the atmospheric CH4 burden. Geophys Res Lett. 2009;36:L18803.
    1. Hausmann P, Sussmann R, Smale D. Contribution of oil and natural gas production to renewed increase in atmospheric methane (2007–2014): Top–down estimate from ethane and methane column observations. Atmos Chem Phys. 2016;16:3227–3244.

Publication types