. 2017 May 2;114(18):4625-4630.
doi: 10.1073/pnas.1701740114. Epub 2017 Apr 17.

Autonomous sweat extraction and analysis applied to cystic fibrosis and glucose monitoring using a fully integrated wearable platform

Affiliations

Autonomous sweat extraction and analysis applied to cystic fibrosis and glucose monitoring using a fully integrated wearable platform

Sam Emaminejad et al. Proc Natl Acad Sci U S A. .

Abstract

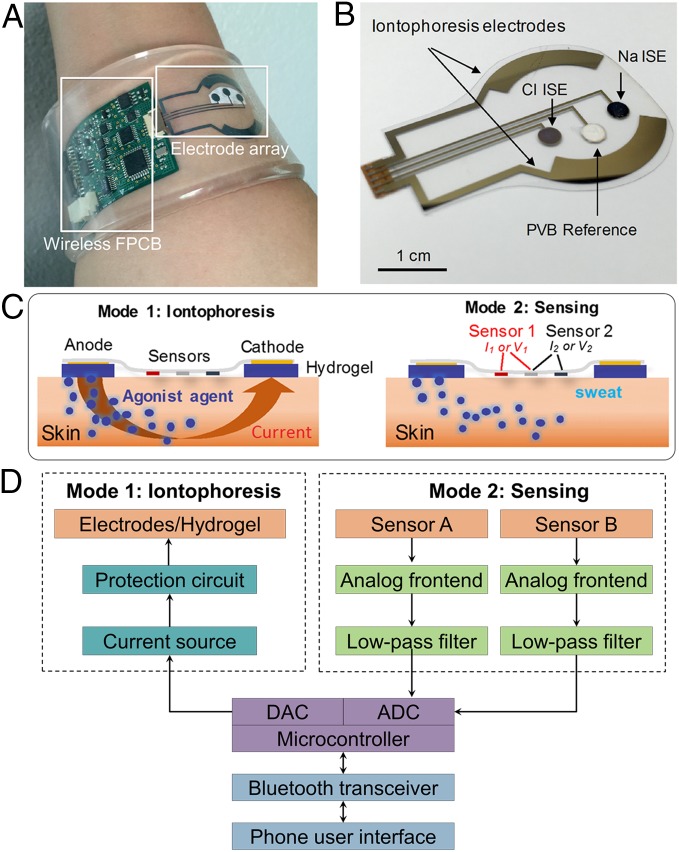
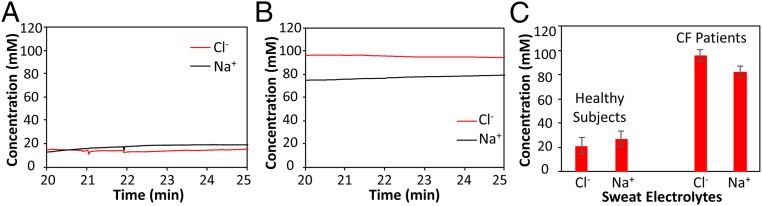
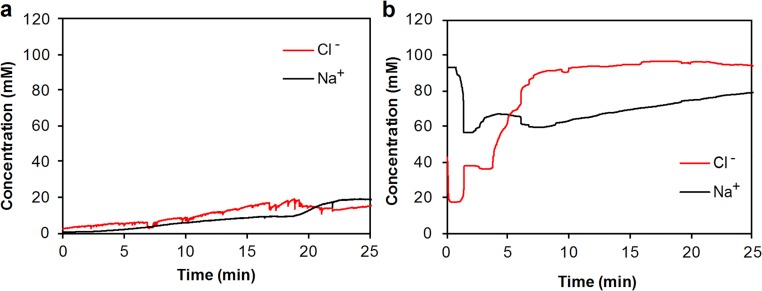
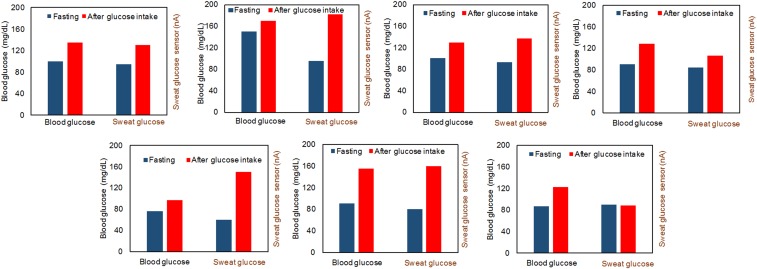
Perspiration-based wearable biosensors facilitate continuous monitoring of individuals' health states with real-time and molecular-level insight. The inherent inaccessibility of sweat in sedentary individuals in large volume (≥10 µL) for on-demand and in situ analysis has limited our ability to capitalize on this noninvasive and rich source of information. A wearable and miniaturized iontophoresis interface is an excellent solution to overcome this barrier. The iontophoresis process involves delivery of stimulating agonists to the sweat glands with the aid of an electrical current. The challenge remains in devising an iontophoresis interface that can extract sufficient amount of sweat for robust sensing, without electrode corrosion and burning/causing discomfort in subjects. Here, we overcame this challenge through realizing an electrochemically enhanced iontophoresis interface, integrated in a wearable sweat analysis platform. This interface can be programmed to induce sweat with various secretion profiles for real-time analysis, a capability which can be exploited to advance our knowledge of the sweat gland physiology and the secretion process. To demonstrate the clinical value of our platform, human subject studies were performed in the context of the cystic fibrosis diagnosis and preliminary investigation of the blood/sweat glucose correlation. With our platform, we detected the elevated sweat electrolyte content of cystic fibrosis patients compared with that of healthy control subjects. Furthermore, our results indicate that oral glucose consumption in the fasting state is followed by increased glucose levels in both sweat and blood. Our solution opens the possibility for a broad range of noninvasive diagnostic and general population health monitoring applications.

Keywords: biosensors; iontophoresis; noninvasive; personalized medicine; wearable.


Conflict of interest statement

The authors declare no conflict of interest.

Figures

Fig. 1.
Fig. 1.
(A) Image of the autonomous sweat extraction and sensing platform (a thin layer of agonist agent hydrogel will be placed underneath the iontophoresis electrodes). (B) Image of iontophoresis and sweat sensor electrodes for Na+ and Cl sensing. (C) Schematic illustrations of the iontophoresis and sensing modes. (D) System-level block diagram of the platform showing the iontophoresis and sensing circuits.
Fig. S1.
Fig. S1.
Image of an FPCB used for electrolyte sensing.
Fig. S2.
Fig. S2.
Analog signal-conditioning circuit schematics of (A) amperometric glucose sensor and (B) potentiometric sensors.
Fig. S3.
Fig. S3.
Schematic showing the current delivery circuitry.
Fig. S4.
Fig. S4.
Custom-developed mobile application interface for wireless control of iontophoresis and data communication. (A) The home page of the application after Bluetooth pairing. (B) Iontophoresis control interface. (C) Data display of sweat analyte levels with data sharing and uploading options.
Fig. 2.
Fig. 2.
Experimental characterizations of the iontophoresis and sensing system. (A) Controlled iontophoresis current output for various resistive loads. (B and C) Programmed iontophoresis current to generate (B) sawtooth and (C) square wave patterns. (D and E) The open-circuit potential responses of the sodium (D) and chloride (E) sensors in NaCl solutions. (F) The chronoamperometric responses of a glucose sensor to glucose solutions. Data recording was paused for 30 s for each solution change.
Fig. S5.
Fig. S5.
Calibration curves for (A) Na+, (B) Cl, and (C) glucose sensors shown in Fig. 2 DF.
Fig. S6.
Fig. S6.
Long-term continuous measurement of a Cl sensor in solutions containing 20, 40, and 80 mM NaCl, respectively. Data recording was paused for 30 s for each solution change.
Fig. S7.
Fig. S7.
Repeatability study of the three different Ag/AgCl-based Cl sensors in NaCl solutions.
Fig. 3.
Fig. 3.
(A) Induced sweat-secretion rate characteristics in response to three different custom-developed cholinergic agonist hydrogels with two different concentrations: acetylcholine (blue), methacholine (black), and pilocarpine (red). Bars represent values for response latency (time in seconds to onset of secretion from start of iontophoresis), response duration (total time in minutes of secretion above baseline, measurements stopped at 60 min), peak secretory rate in response to stimulation, time to reach peak secretory rate, and time spent secreting at the peak rate. (B) Sweat-rate profile pertaining to periodic sweat induction using acetylcholine 1%-based hydrogel with iontophoresis current of 1 mA for 10 s. (C) Sweat-rate profile pertaining to periodic sweat induction using acetylcholine 10%-based hydrogel with iontophoresis current of 1 mA for 5 min (bottom panel). The control curves in B and C represent the sweat-rate profile in the contralateral arm without iontophoresis.
Fig. 4.
Fig. 4.
Wearable sweat extraction and sensing system for CF diagnosis. (A) Real-time on-body measurement of sweat sodium ion and chloride ion levels of a healthy subject after iontophoresis-based sweat stimulation. (B) Real-time measurement of sweat sodium and chloride levels of a CF patient. (C) Comparison of sweat electrolyte levels between six healthy subjects and three CF patients.
Fig. S8.
Fig. S8.
(A) Real-time on-body measurement of sweat sodium ion and chloride ion levels of a representative healthy subject after iontophoresis-based sweat stimulation. (B) Real-time on-body measurement of sweat sodium ion and chloride ion levels of a representative CF patient after iontophoresis-based sweat stimulation.
Fig. 5.
Fig. 5.
Comparison of the blood and sweat glucose levels of seven subjects during 12-h fasting and 1 h after glucose intake (30 g glucose).

Similar articles

Cited by

References

    1. Kim DH, et al. Epidermal electronics. Science. 2011;333(6044):838–843. - PubMed
    1. Hammock ML, Chortos A, Tee BC, Tok JB, Bao Z. 25th anniversary article: The evolution of electronic skin (e-skin): A brief history, design considerations, and recent progress. Adv Mater. 2013;25(42):5997–6038. - PubMed
    1. Bandodkar AJ, Jeerapan I, Wang J. Wearable chemical sensors: Present challenges and future prospects. ACS Sens. 2016;1:464–482.
    1. Wang C, et al. User-interactive electronic skin for instantaneous pressure visualization. Nat Mater. 2013;12(10):899–904. - PubMed
    1. Xu S, et al. Soft microfluidic assemblies of sensors, circuits, and radios for the skin. Science. 2014;344(6179):70–74. - PubMed

Publication types

MeSH terms