

Ambiguity in the causes for decadal trends in atmospheric methane and hydroxyl
- PMID: 28416668
- PMCID: PMC5448216
- DOI: 10.1073/pnas.1616020114
Ambiguity in the causes for decadal trends in atmospheric methane and hydroxyl
Abstract
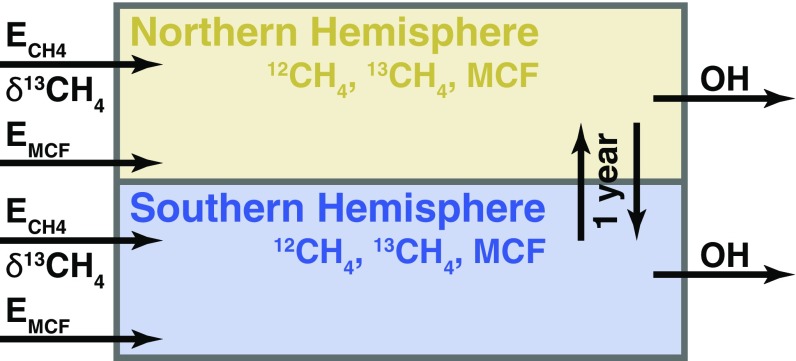
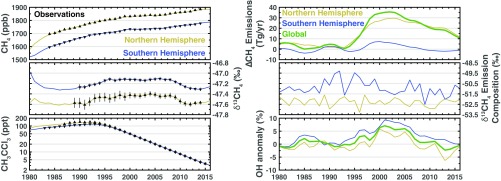
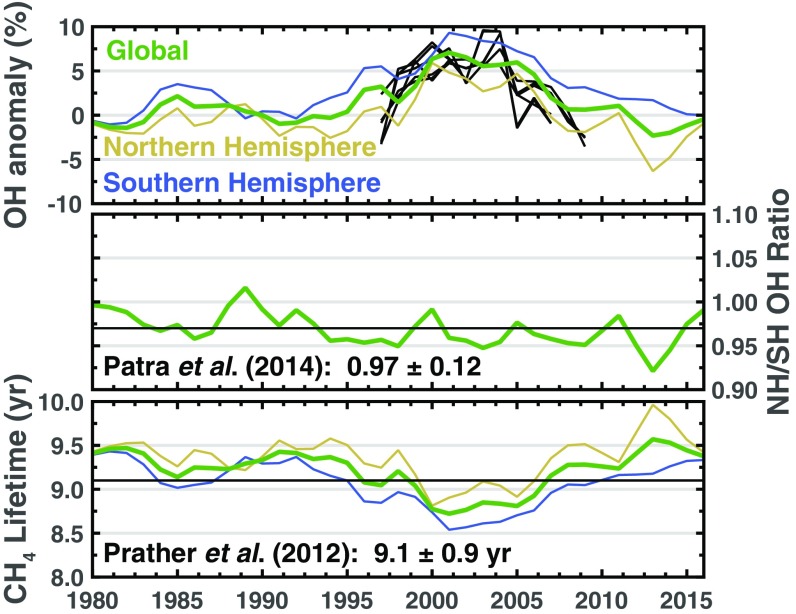
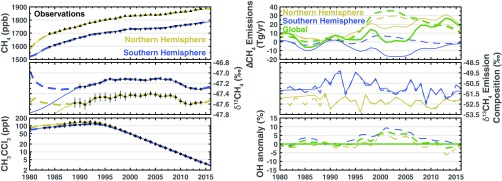
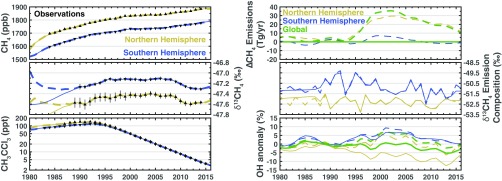
Methane is the second strongest anthropogenic greenhouse gas and its atmospheric burden has more than doubled since 1850. Methane concentrations stabilized in the early 2000s and began increasing again in 2007. Neither the stabilization nor the recent growth are well understood, as evidenced by multiple competing hypotheses in recent literature. Here we use a multispecies two-box model inversion to jointly constrain 36 y of methane sources and sinks, using ground-based measurements of methane, methyl chloroform, and the C13/C12 ratio in atmospheric methane (δ13CH4) from 1983 through 2015. We find that the problem, as currently formulated, is underdetermined and solutions obtained in previous work are strongly dependent on prior assumptions. Based on our analysis, the mathematically most likely explanation for the renewed growth in atmospheric methane, counterintuitively, involves a 25-Tg/y decrease in methane emissions from 2003 to 2016 that is offset by a 7% decrease in global mean hydroxyl (OH) concentrations, the primary sink for atmospheric methane, over the same period. However, we are still able to fit the observations if we assume that OH concentrations are time invariant (as much of the previous work has assumed) and we then find solutions that are largely consistent with other proposed hypotheses for the renewed growth of atmospheric methane since 2007. We conclude that the current surface observing system does not allow unambiguous attribution of the decadal trends in methane without robust constraints on OH variability, which currently rely purely on methyl chloroform data and its uncertain emissions estimates.
Keywords: hydroxyl; methane; oxidative capacity; renewed growth; troposphere.
Conflict of interest statement
The authors declare no conflict of interest.
Figures
Comment in
-
Overexplaining or underexplaining methane's role in climate change.Proc Natl Acad Sci U S A. 2017 May 23;114(21):5324-5326. doi: 10.1073/pnas.1704884114. Epub 2017 May 15. Proc Natl Acad Sci U S A. 2017. PMID: 28507153 Free PMC article. No abstract available.
References
-
- IPCC . Climate change 2013: The physical science basis. In: Stocker TF, Qin D, Plattner G-K, Tignor M, Allen SK, Boschung J, Nauels A, Xia Y, Bex V, Midgley PM, editors. Contribution of Working Group I to the Fifth Assessment Report of the Intergovernmental Panel on Climate Change. Cambridge Univ Press; Cambridge, UK: 2013.
-
- Etheridge DM, Pearman GI, Fraser PJ. Changes in tropospheric methane between 1841 and 1978 from a high accumulation-rate antarctic ice core. Tellus Ser B Chem Phys Meteorol. 1992;44:282–294.
-
- Dlugokencky EJ. Atmospheric methane levels off: Temporary pause or a new steady-state? Geophys Res Lett. 2003;30:1992.
-
- Rigby M, et al. Renewed growth of atmospheric methane. Geophys Res Lett. 2008;35:L22805.
-
- Dlugokencky EJ, et al. Observational constraints on recent increases in the atmospheric CH4 burden. Geophys Res Lett. 2009;36:L18803.
Publication types
LinkOut - more resources
Full Text Sources
Other Literature Sources
Miscellaneous
