Clinical Trial
. 2017 May 2;114(18):4793-4798.
doi: 10.1073/pnas.1618228114. Epub 2017 Apr 17.

Coding of navigational affordances in the human visual system

Affiliations
Clinical Trial

Coding of navigational affordances in the human visual system

Michael F Bonner et al. Proc Natl Acad Sci U S A. .

Abstract

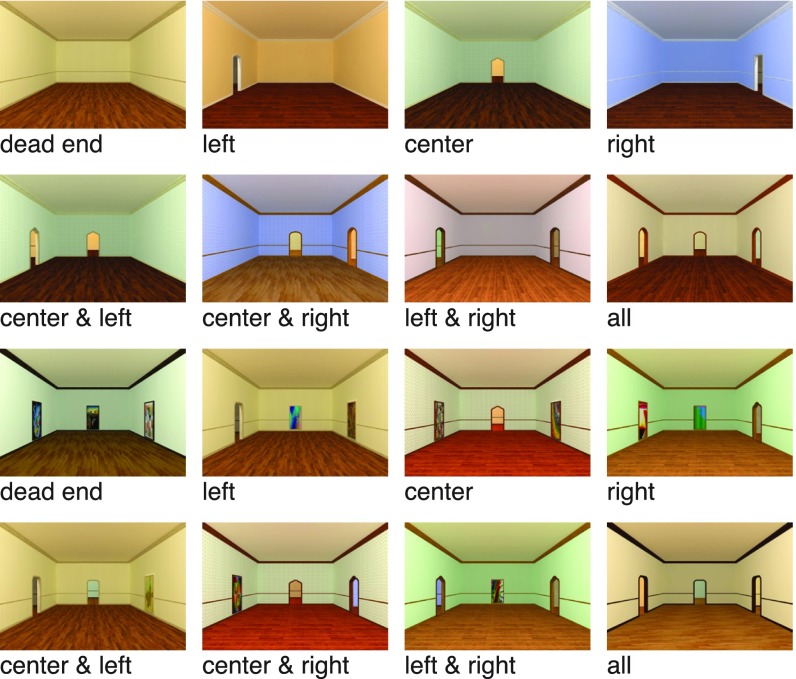
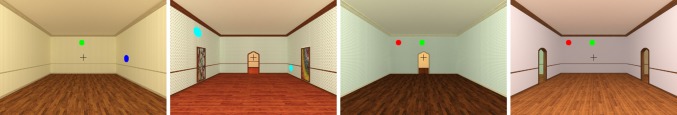
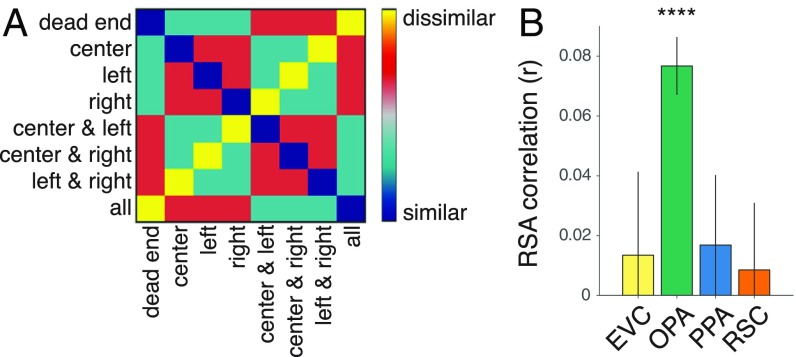
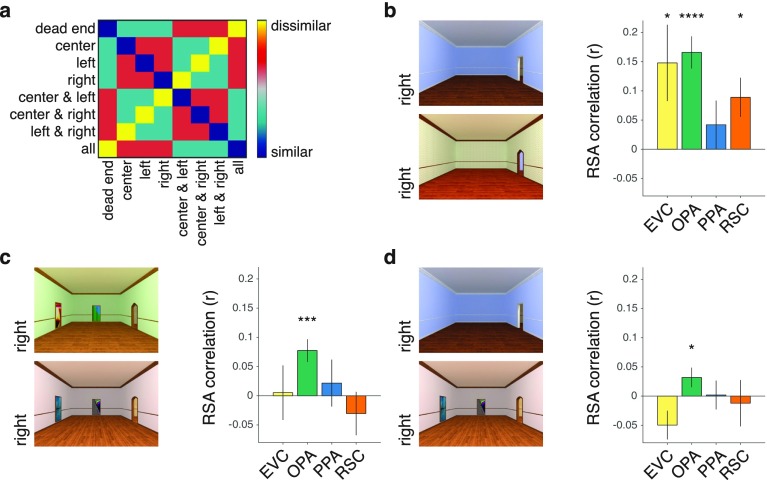
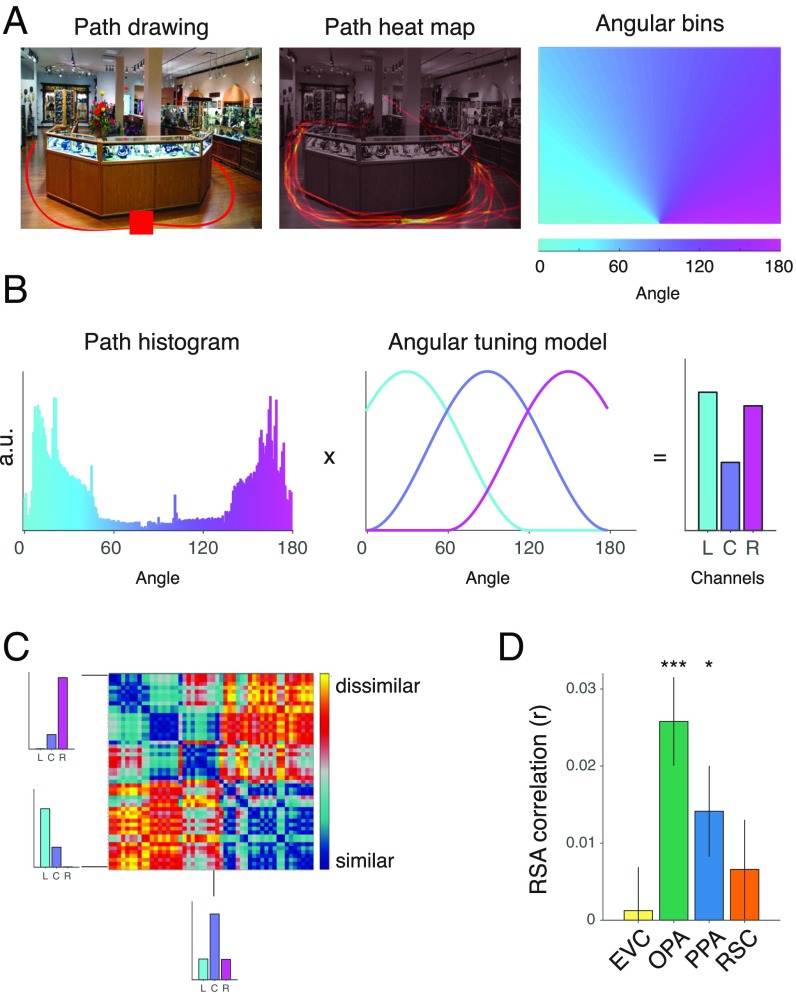
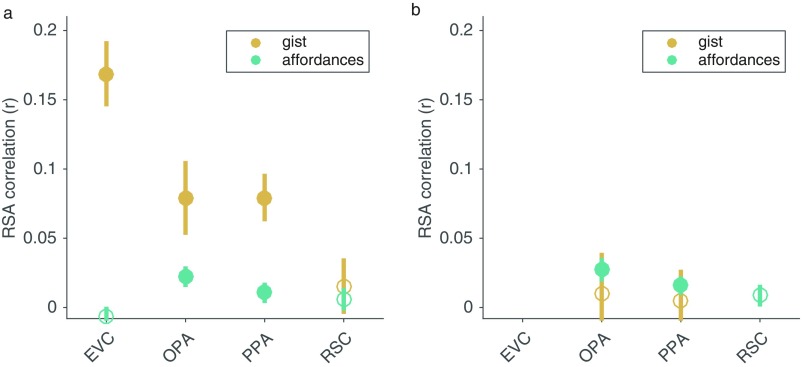
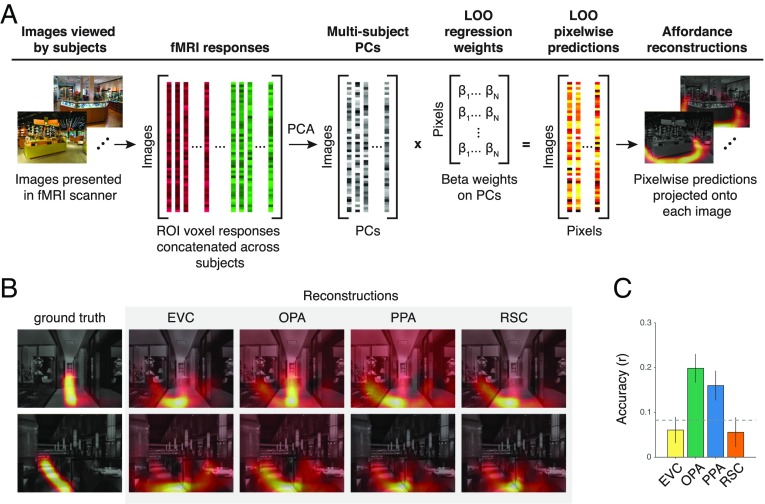
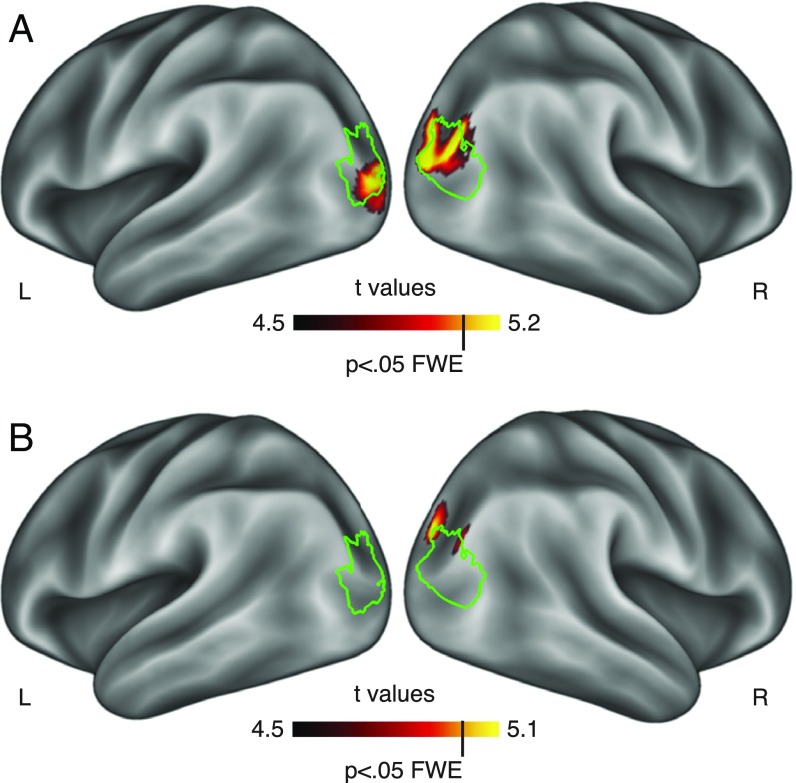
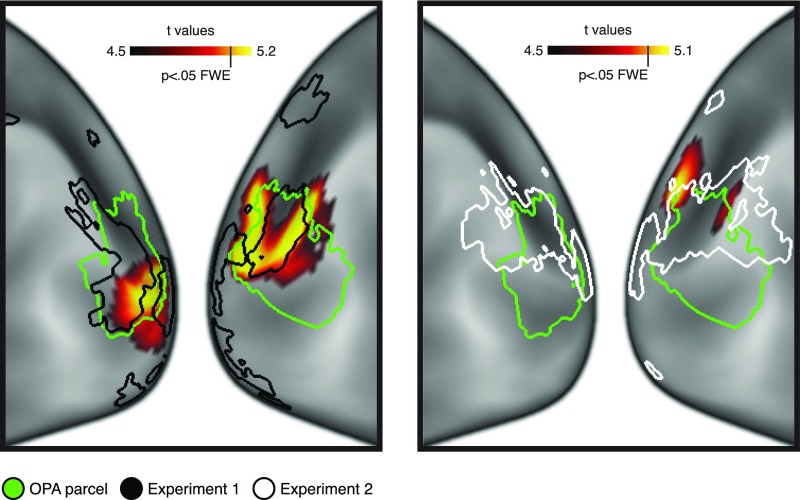
A central component of spatial navigation is determining where one can and cannot go in the immediate environment. We used fMRI to test the hypothesis that the human visual system solves this problem by automatically identifying the navigational affordances of the local scene. Multivoxel pattern analyses showed that a scene-selective region of dorsal occipitoparietal cortex, known as the occipital place area, represents pathways for movement in scenes in a manner that is tolerant to variability in other visual features. These effects were found in two experiments: One using tightly controlled artificial environments as stimuli, the other using a diverse set of complex, natural scenes. A reconstruction analysis demonstrated that the population codes of the occipital place area could be used to predict the affordances of novel scenes. Taken together, these results reveal a previously unknown mechanism for perceiving the affordance structure of navigable space.

Keywords: affordances; dorsal stream; navigation; occipital place area; scene-selective visual cortex.


Conflict of interest statement

The authors declare no conflict of interest.

Figures

Fig. 1.
Fig. 1.
Examples of artificially rendered environments used as stimuli in Exp. 1. Eight navigational-affordance conditions were defined by the number and position of open doorways along the walls. For each condition, we created 18 aesthetic variants that differed in surface textures and the shapes of the doorways (one shown for each condition), and for each of these aesthetic variants, we created one stimulus in which walls with no exit were blank (Top two rows) and one stimulus in which walls with no exit contained an abstract painting (Bottom two rows).
Fig. S1.
Fig. S1.
Examples of rendered environments from Exp. 1 with overlaid colored dots. On each trial, subjects indicated whether the colors of the two dots were the same or different. Positions and colors of the dots were matched across the eight affordance conditions.
Fig. 2.
Fig. 2.
Coding of navigational affordances in artificially rendered environments. (A) Model RDM of navigational affordances defined by overlap in the locations of the open doorways. (B) RSA of this model RDM in each ROI. The OPA showed a strong and reliable effect for the coding of navigational affordances. Error bars represent ± 1 SEM; ****P < 0.0001.
Fig. S2.
Fig. S2.
Coding of navigational affordances in artificially rendered environments is tolerant to visual differences. (A) Model RDM of navigational affordances. (B) RSA for scenes without paintings. The OPA, EVC, and RSC exhibited significant effects, perhaps reflecting low-level visual differences between the affordance conditions. (C) RSA for scenes with paintings. In these comparisons, low-level visual difference between the affordance conditions are reduced; nevertheless, strong coding for affordances is observed in the OPA. (D) RSA for scenes with and without paintings. In these comparisons, scenes with similar affordances are highly dissimilar with respect to low-level visual features, which accounts for the negative correlations in the EVC. Despite this, the coding of navigational affordances remained significant in the OPA. Error bars represent ± 1 SEM; *P < 0.05, ***P < 0.001, ****P < 0.0001.
Fig. S3.
Fig. S3.
fMRI response as a function of the number of doorways in a scene. Each panel shows the mean univariate response within an ROI for stimuli grouped by the number of doorways they contain. Results are plotted separately for scenes with and without paintings (i.e., half of the stimuli contain a painting on any wall without a doorway). For scenes without paintings, the univariate responses in the EVC, OPA, and PPA increased in relation to the number of doorways [repeated-measures F-test for a positive linear effect of doorways; EVC: F(1, 11) = 8.51, P = 0.014; OPA: F(1, 11) = 8.50, P = 0.014; PPA: F(1, 11) = 14.96, P = 0.0026; RSC: F(1, 11) = 2.06, P = 0.18]. However, this effect was not observed in any ROI for stimuli with paintings (all P > 0.62), which are better matched on visual complexity across conditions with different numbers of doorways. This finding suggests that the linear trend in the univariate responses to the no-painting stimuli likely reflects an increase in visual complexity with the increasing number of doorways, rather than a specific effect of the number of pathways. Error bars represent ± 1 SEM.
Fig. S4.
Fig. S4.
Coding of navigational affordances and textural features in artificially rendered environments. (A) Cross-run measures of neural dissimilarity in the PPA. A repeated-measures ANOVA showed significant main effects of textures [F(1, 11) = 7.61, P = 0.019] and affordances [F(1, 11) = 14.74, P = 0.003] and a trend toward an interaction of these factors [F(1, 11) = 3.99, P = 0.071]. Post hoc t tests showed that the effect of affordance coding was only significant for environments with the same textures [t(11) = 4.01, P = 0.001] but not for environments with different textures [t(11) = 0.30, P = 0.385]. (B) Cross-run measures of neural dissimilarity in the OPA. A repeated-measures ANOVA showed significant main effects of textures [F(1, 11) = 8.86, P = 0.013] and affordances [F(1, 11) = 10.24, P = 0.008] and no evidence for an interaction of these factors [F(1, 11) = 0.50, P = 0.494]. Post hoc t tests showed that the effect of affordance coding was significant both for environments with the same textures [t(11) = 2.24, P = 0.023] and for environments with different textures [t(11) = 2.52, P = 0.014]. Error bars represent ± 1 SEM.
Fig. S5.
Fig. S5.
Examples of complex, natural environments used as stimuli in Exp. 2. All images were eye-level photographs of indoor environments with clear navigational paths extending from the implied viewing position.
Fig. S6.
Fig. S6.
Examples of target stimuli (i.e., bathroom scenes) in Exp. 2. Subjects were asked to monitor the semantic categories of the scenes and respond whenever the scene was a bathroom.
Fig. 3.
Fig. 3.
Coding of navigational affordances in natural scenes. (A) In a norming study, a group of independent raters were asked to indicate the paths that they would take to walk through each scene starting from the bottom center of the image (Left). These data were combined across raters to produce a heat map of the possible navigational trajectories through each scene (Center). Angular histograms were created by summing the responses within a set of angular bins radiating from the bottom center of each image (Right). (B) The resulting histograms summarize the trajectory responses across the entire range of angles that are visible in the image. Navigational affordances were modeled using a set of hypothesized encoding channels with tuning curves that broadly code for trajectories to the left (L), center (C), and right (R). Model representations were computed as the product of the angular-histogram vectors and the tuning curves of the navigational-affordance channels. a.u., arbitrary units. (C) A model RDM was created by comparing the affordance-channel representations across images. (D) RSA showed that the strongest effect for the coding of navigational affordances was in the OPA. Error bars represent ± 1 SEM; *P < 0.05, ***P < 0.001.
Fig. S7.
Fig. S7.
Visualization of the navigational-affordance RDM. Using t-distributed stochastic neighbor embedding (t-SNE; perplexity set at 30), a 2D embedding was created that best captures that representational distances of the model RDM (shown in Fig. 3C). The Left panel shows how the stimulus images are arranged in this embedding. The plots on the Right illustrate the response level for each stimulus in the affordance channels of the encoding model (C, center; L, left; R, right; see also Fig. 3B). Colors are scaled to the minimum and maximum within each channel.
Fig. S8.
Fig. S8.
Comparison of RSA effects for navigational affordances and Gist features. (A) Partial correlation analyses were used to identify the RSA correlations that could be uniquely attributed to each model. The RSA effects for the Gist model were strongest in EVC, whereas the effects of the affordance model were strongest in the OPA and PPA. (B) After partialling out the variance of the EVC RDM from each of the other ROIs, the effects of the affordance model remained significant in the OPA and PPA, but the effects of the Gist model dropped and were no longer significant. Error bars represent ±1 SEM. Filled circles indicate significant effects at P < 0.05.
Fig. 4.
Fig. 4.
Reconstruction of navigational-affordance maps. (A) Navigational-affordance maps were reconstructed from the fMRI responses within each ROI. First, a data-fusion procedure was used to create a set of multisubject ROI responses for use in the reconstruction model. For each ROI, principal component analysis (PCA) was applied to a matrix of voxel responses concatenated across all subjects. The resulting multisubject PCs were used as predictors in a set of pixelwise decoding models. These decoding models used linear regression to generate intensity values for individual pixels from a weighted sum of multisubject fMRI responses. The ability of the models to reconstruct the affordances of novel stimuli was assessed through LOO cross-validation on each image in turn. (B) Example reconstructions of navigational-affordance maps from the cortical responses in each ROI. (C) Affordance maps were reconstructed most accurately from the responses of the OPA. Bars represent the mean accuracy across images. Error bars represent ± 1 SEM. The dashed line indicates chance performance at P < 0.05 permutation-test FWE.
Fig. 5.
Fig. 5.
Whole-brain searchlight analyses. (A) RSA of navigational-affordance coding for the artificially rendered environments of Exp. 1. (B) RSA of navigational-affordance coding for the natural scene images of Exp. 2. Consistent with the ROI findings, both experiments show whole-brain corrected effects at the junction of the intraparietal and transverse-occipital sulci. The green outlines correspond to the borders of the OPA parcels.
Fig. S9.
Fig. S9.
Comparison of searchlight and localizer effects. These plots show close-up views of the searchlight results for the navigational-affordance model in Exp. 1 (Left) and Exp. 2 (Right) (see also Fig. 5). The overlaid outlines depict the OPA parcel (green) and localizer effects for the contrast of scenes > objects in Exps. 1 (black) and 2 (white). The localizer effects were thresholded at P < 0.001 uncorrected in a t test across subjects. These localizer clusters extend beyond the probabilistically defined OPA parcel, and they partly diverge across the two experiments. Furthermore, this pattern of divergence in the localizer effects across experiments roughly corresponds to the pattern of divergence in the searchlight effects. Specifically, the localizer and searchlight clusters extend more inferiorly in the subjects from Exp. 1 and more superiorly in the subjects from Exp. 2.

Comment in

Similar articles

Cited by

References

    1. Gibson JJ. Visually controlled locomotion and visual orientation in animals. Br J Psychol. 1958;49:182–194. - PubMed
    1. Gibson JJ. The theory of affordances. In: Shaw R, Bransford J, editors. Perceiving, Acting and Knowing. Erlbaum; Hillsdale, NJ: 1977.
    1. Gallivan JP, Logan L, Wolpert DM, Flanagan JR. Parallel specification of competing sensorimotor control policies for alternative action options. Nat Neurosci. 2016;19:320–326. - PMC - PubMed
    1. Cisek P, Kalaska JF. Neural mechanisms for interacting with a world full of action choices. Annu Rev Neurosci. 2010;33:269–298. - PubMed
    1. Greene MR, Oliva A. Recognition of natural scenes from global properties: Seeing the forest without representing the trees. Cognit Psychol. 2009;58:137–176. - PMC - PubMed

Publication types

LinkOut - more resources